
Binance Coin’s breakout was halted post a broader market dip. Cardano could see a downtrend towards $1.01 in an extended bearish scenario. Finally, Litecoin needed to defend $330-300 to avoid a breakdown towards its 200-SMA.
Binance Coin [BNB]
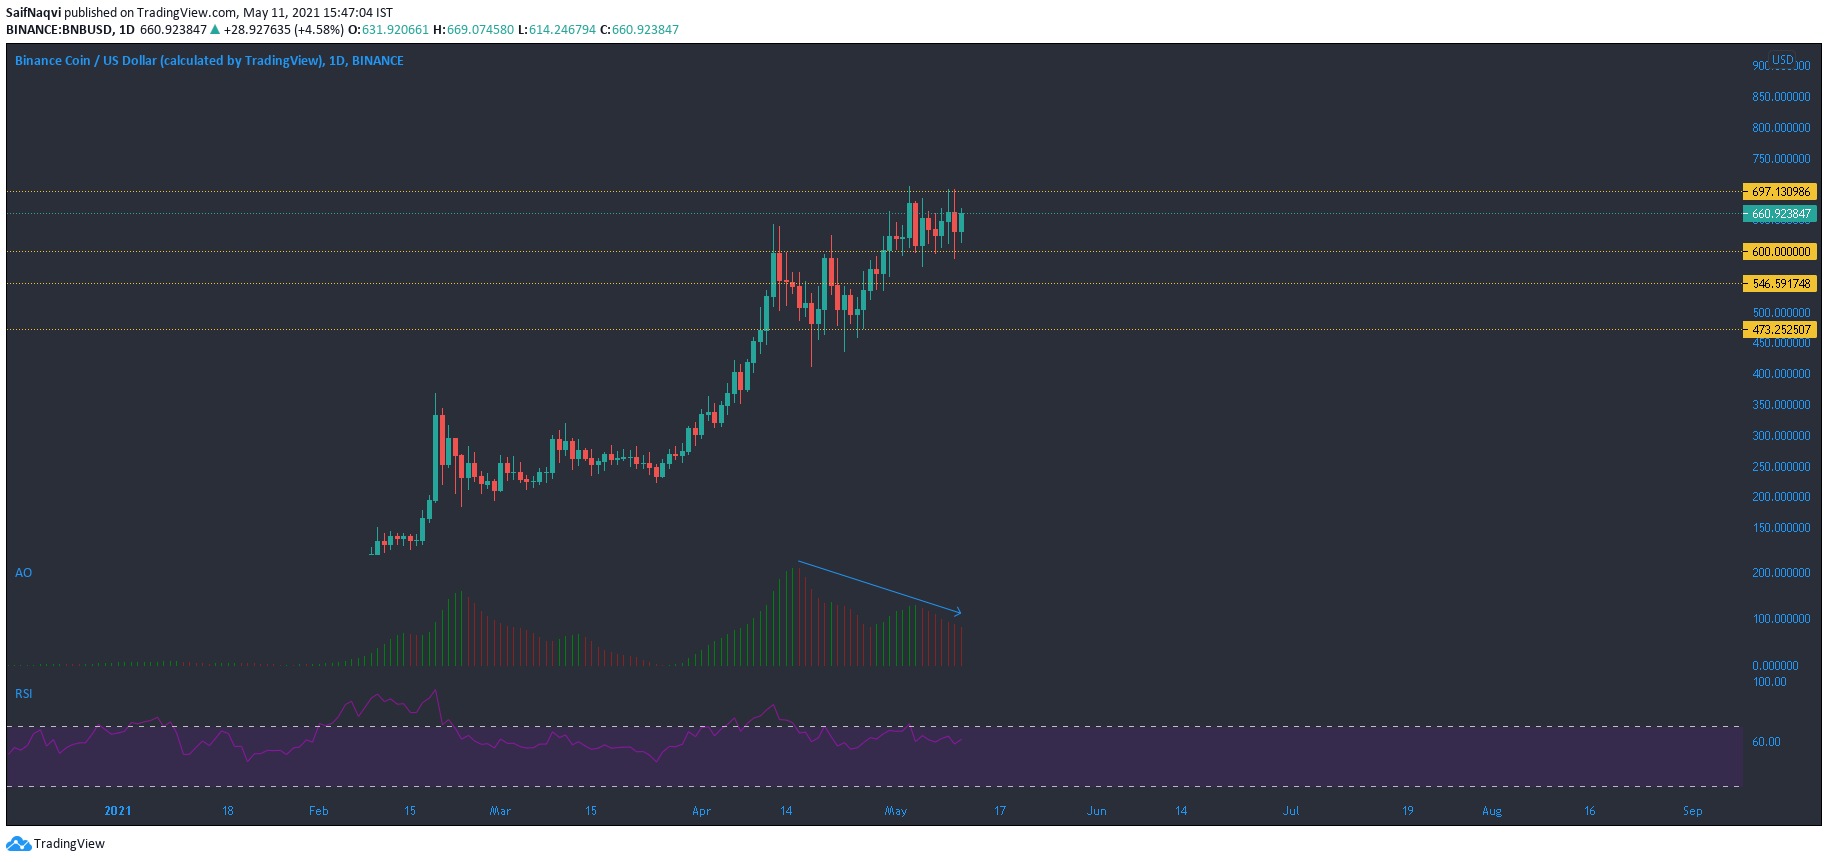
Source: BNB/USD, TradingView
Although Binance Coin did seem to break north from a cup and handle pattern, targets mentioned in a previous analysis were yet to be realized. A pullback in the broader market added further complications as bearish sentiment drove most alts over the last 24 hours. This could be a minor hiccup for BNB, but bulls need to be vigilant of a move below $600. A breakdown could see BNB drop towards $473.2 – a region that has been maintained by the buyers since mid-April.
A bearish twin peak setup on Awesome Oscillator suggested an incoming wave of selling pressure. If $600 is defended, some consolidation could be on the cards before a break above $700. At the time of writing, RSI maintained a bullish territory above 55.
Cardano [ADA]
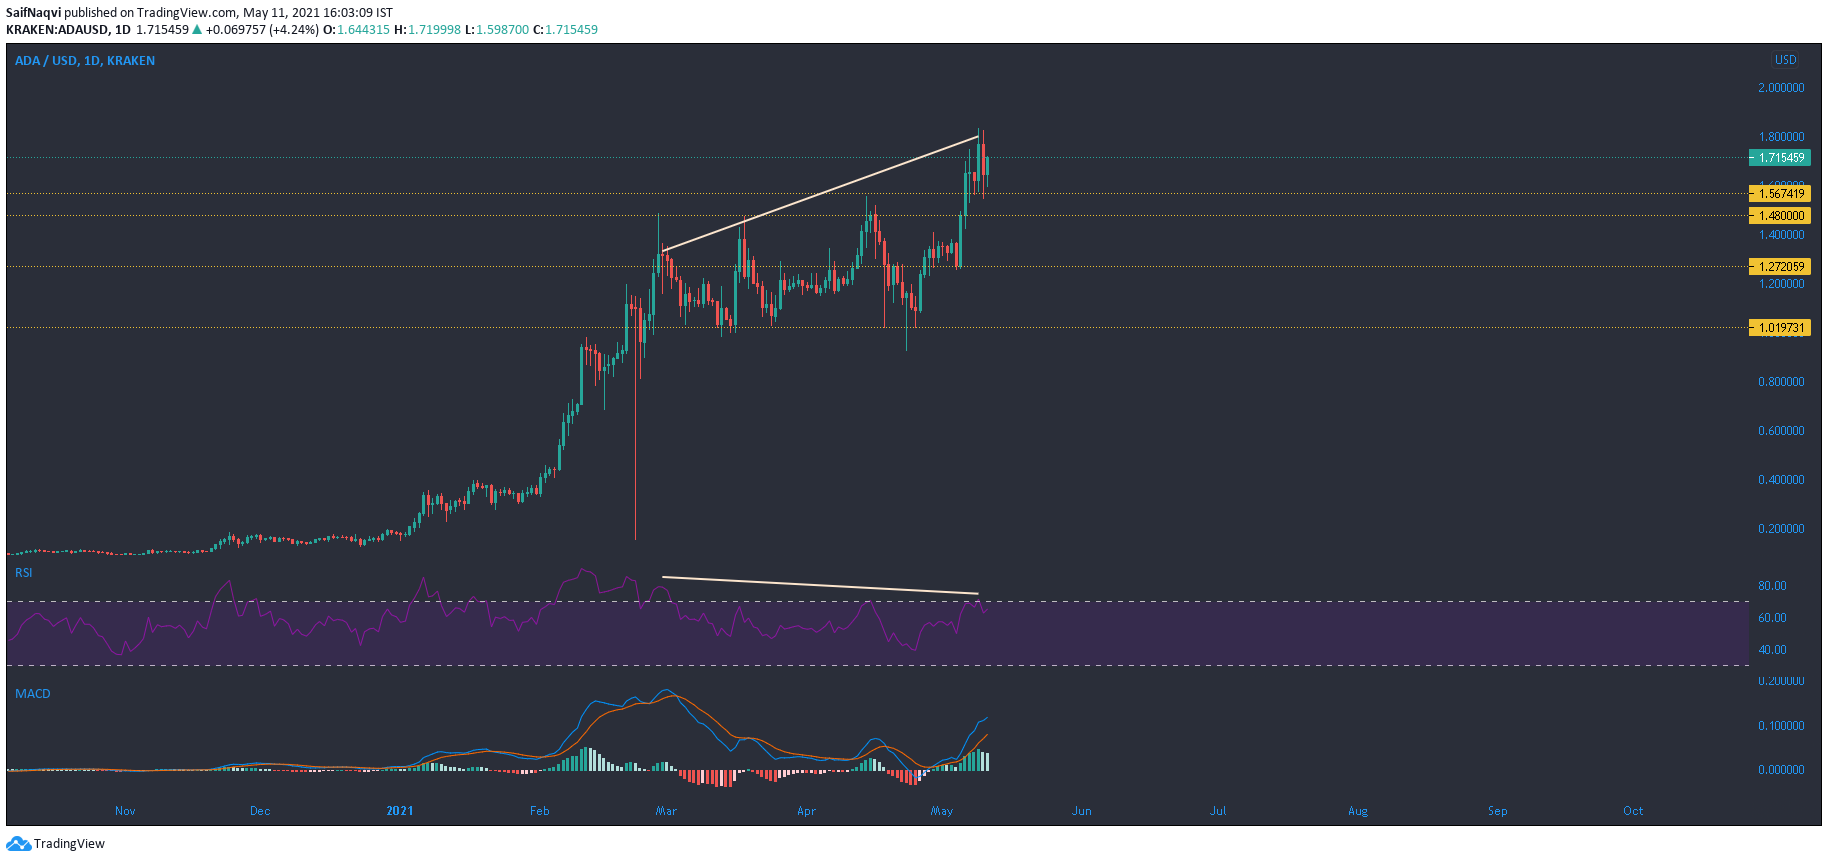
Source: ADA/USD, TradingView
The daily timeframe and 4-hour timeframe showed a contrasting picture of Cardano. On the 4-hour chart, ADA slipped below its 20-SMA and moved towards a defensive area at $1.56-1.55. This area also lay close to the 50-SMA. A bearish outcome would likely see ADA could fall back towards the $1.48-mark. The next support area presented a strong defensive ground between $1.38-$1.27. Losing this area to the bears would be damaging to ADA’s short-mid trajectory and losses could amplify all the way towards $1.01.
On the other hand, the daily chart still indicated a bullish market despite a dip seen over the last 24 hours, however, bearish divergence on RSI suggested weakness in the current price trend. The index has bounced back from 46-48 during the past few weeks, but a dip below 45 would signal an extended sell-off. MACD line moved well above the Signal, but the histogram registered weakening momentum.
Litecoin [LTC]
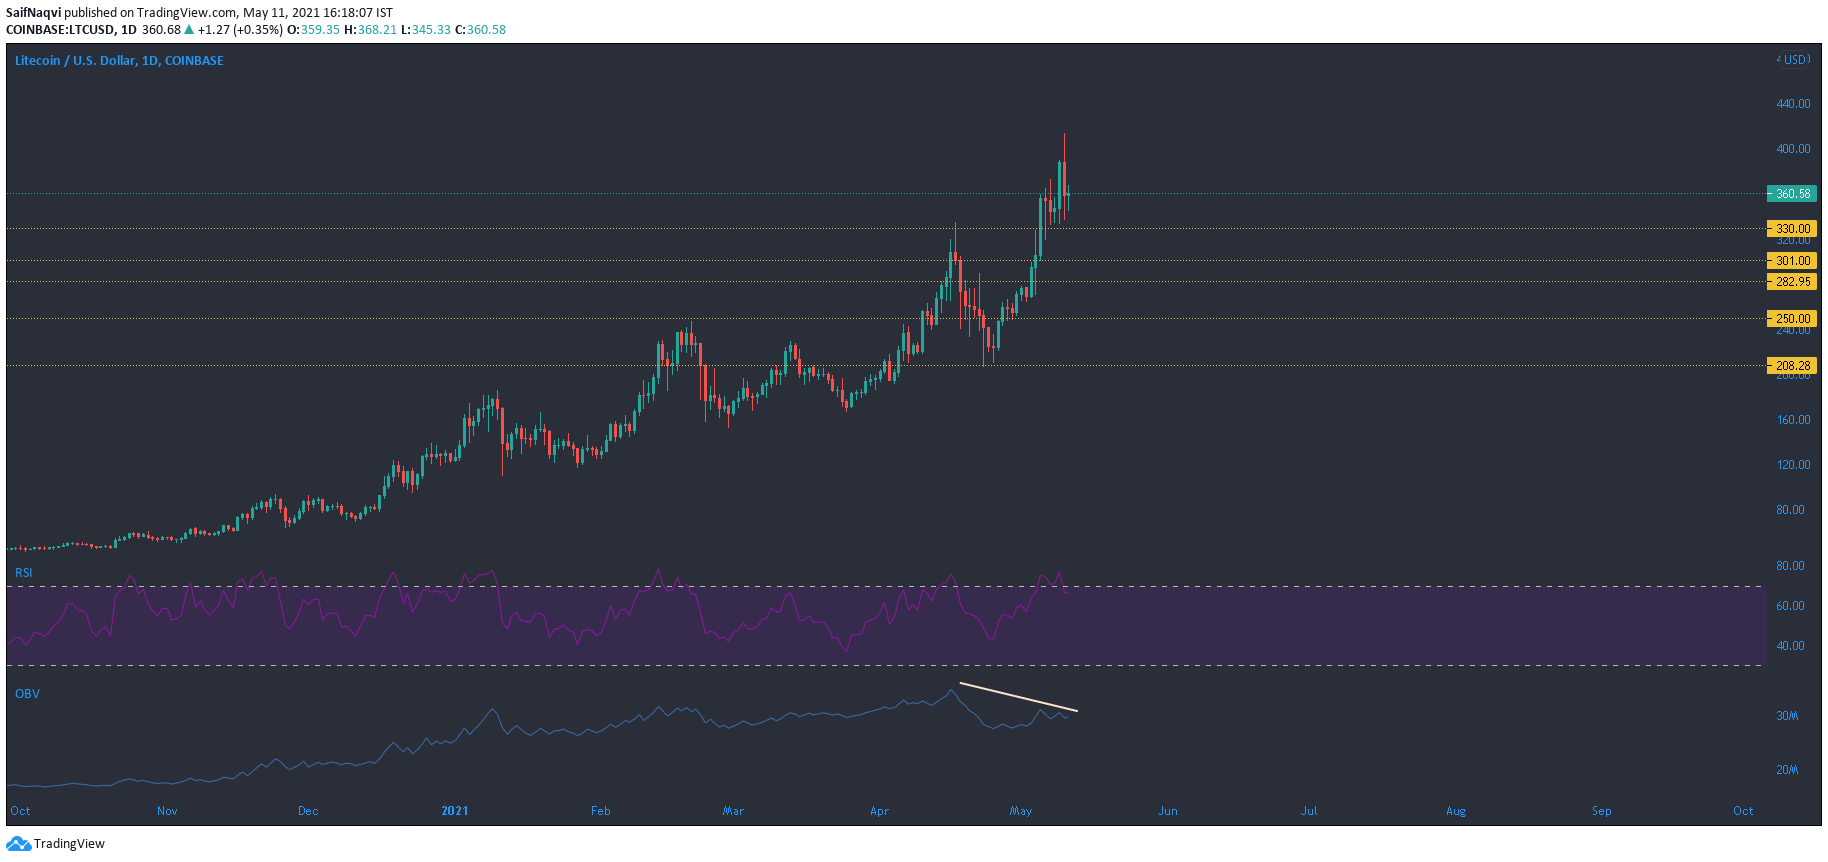
Source: LTC/USD, TradingView
A single candlewick on Litecoin touched above $400 but a correction was forthcoming in the market. RSI’s overbought territory suggested that LTC required stabilization after the recent rally. A reliable support area lay between $330-300 and the 200-SMA traded around $283 (4-hour timeframe). A fall below the long-term moving average could trigger an even sharper sell-off towards $208.
If OBV breaks above its upper-sloping trendline, buying pressure could return and drive LTC to higher levels, but this was unlikely over the coming days.