Binance Coin, Dash, Synthetix Price Analysis: 17 January

Binance Coin looked to revisit $38.72 as the price failed to hold up above its present resistance. Dash formed a symmetrical triangle on the charts and presented the possibility of a breakout above $135.69 resistance while SNX reversed course and fell by over 12% after hitting record levels.
Binance Coin [BNB]
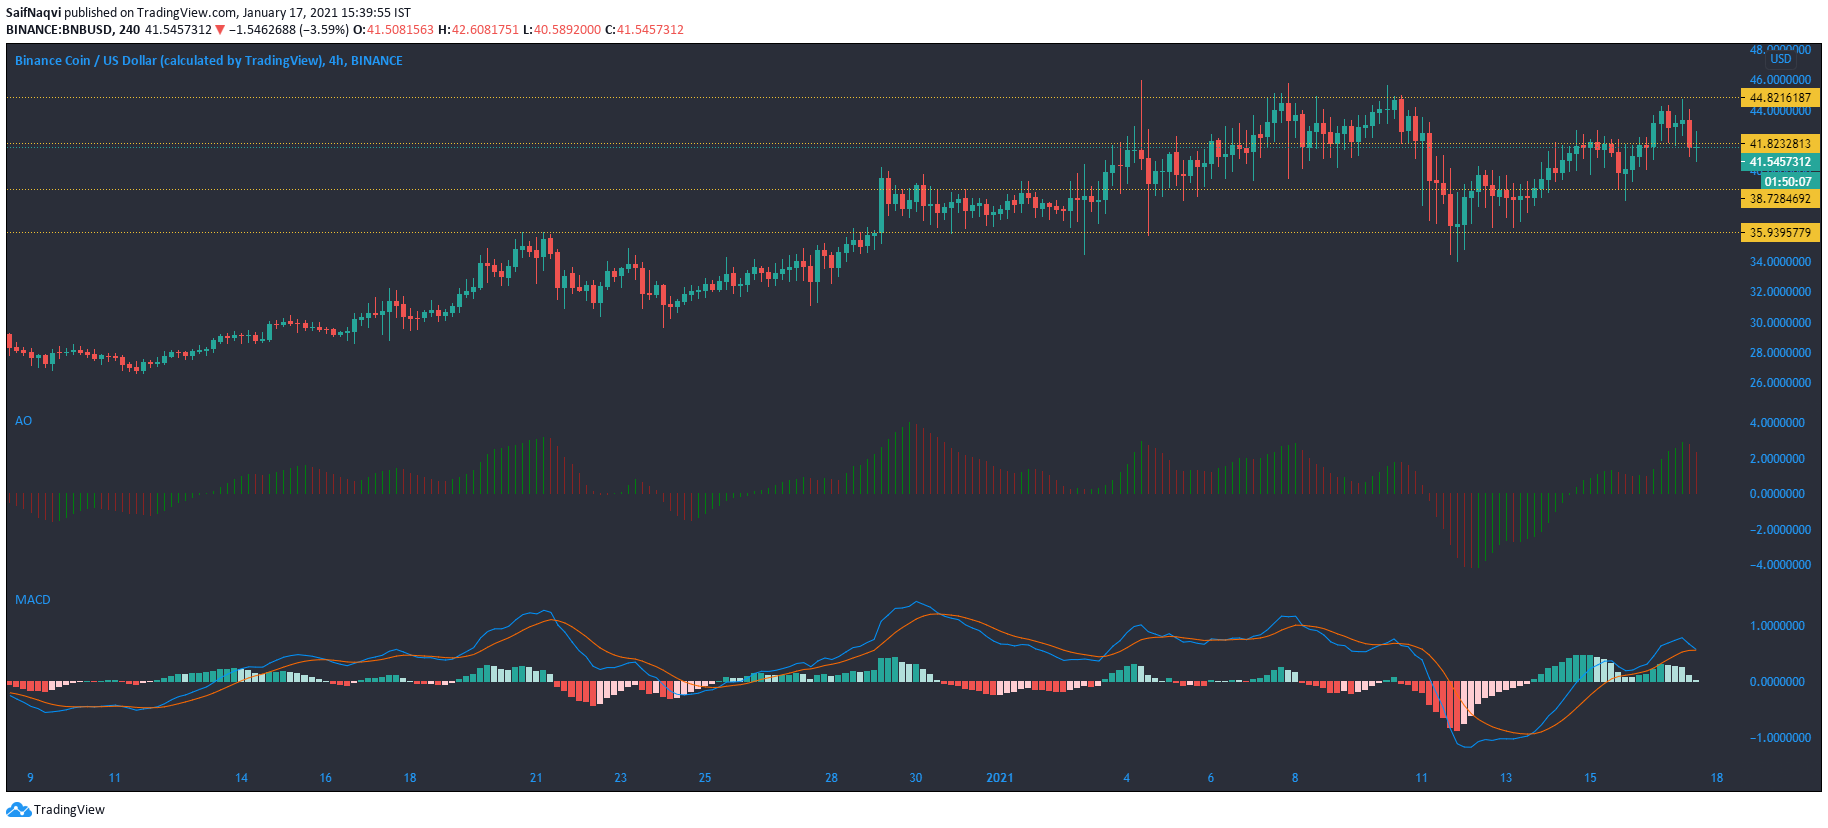
Binance Coin retested $41.8 and moved lower as the bulls failed to lift prices towards $44.82 resistance. Prices could revisit the $38.72 support if the fall continues over the next few trading sessions. If the price rises, that would present an upside of $44.82. However, indicators favored the bears and suggested that a move towards immediate support could be a likely outcome.
The MACD was on the verge of a bearish crossover as the signal line eyed a move above the fast-moving line.
The Awesome Oscillator agreed with the MACD and indicated that momentum was shifting towards the bears.
Dash [DASH]
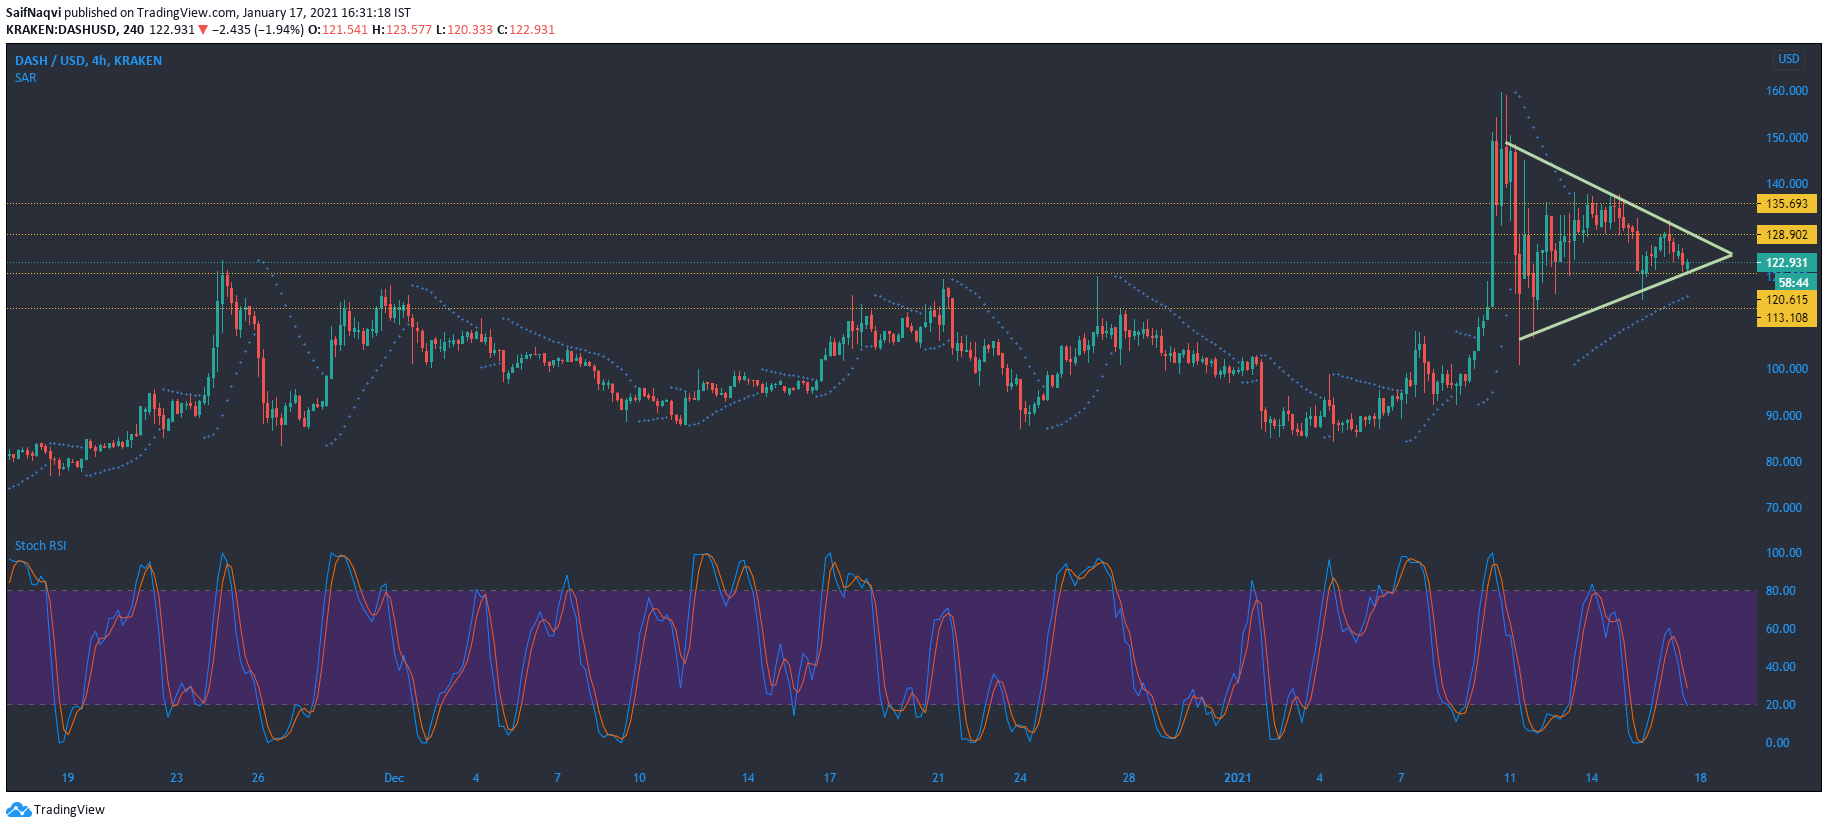
Dash flashed red at press time, as prices traded at $121.84, down by 3.87% in the past 24 hours. A look at the 4hr chart showed that the price had formed a symmetrical triangle, and a breakout could be witnessed over the next few trading sessions. A bullish outcome could see the coin’s trading price rise above its immediate resistance and target a move above the next resistance at $135.69. On the flip side, a downward breakout could see the coin move below support $113.1.
The Stochastic RSI moved in the oversold territory and signaled a potential pullback if the index reverses direction.
The Parabolic SAR’s dotted markers were below the candlesticks and indicated that the price action was in an uptrend.
Synthetix [SNX]
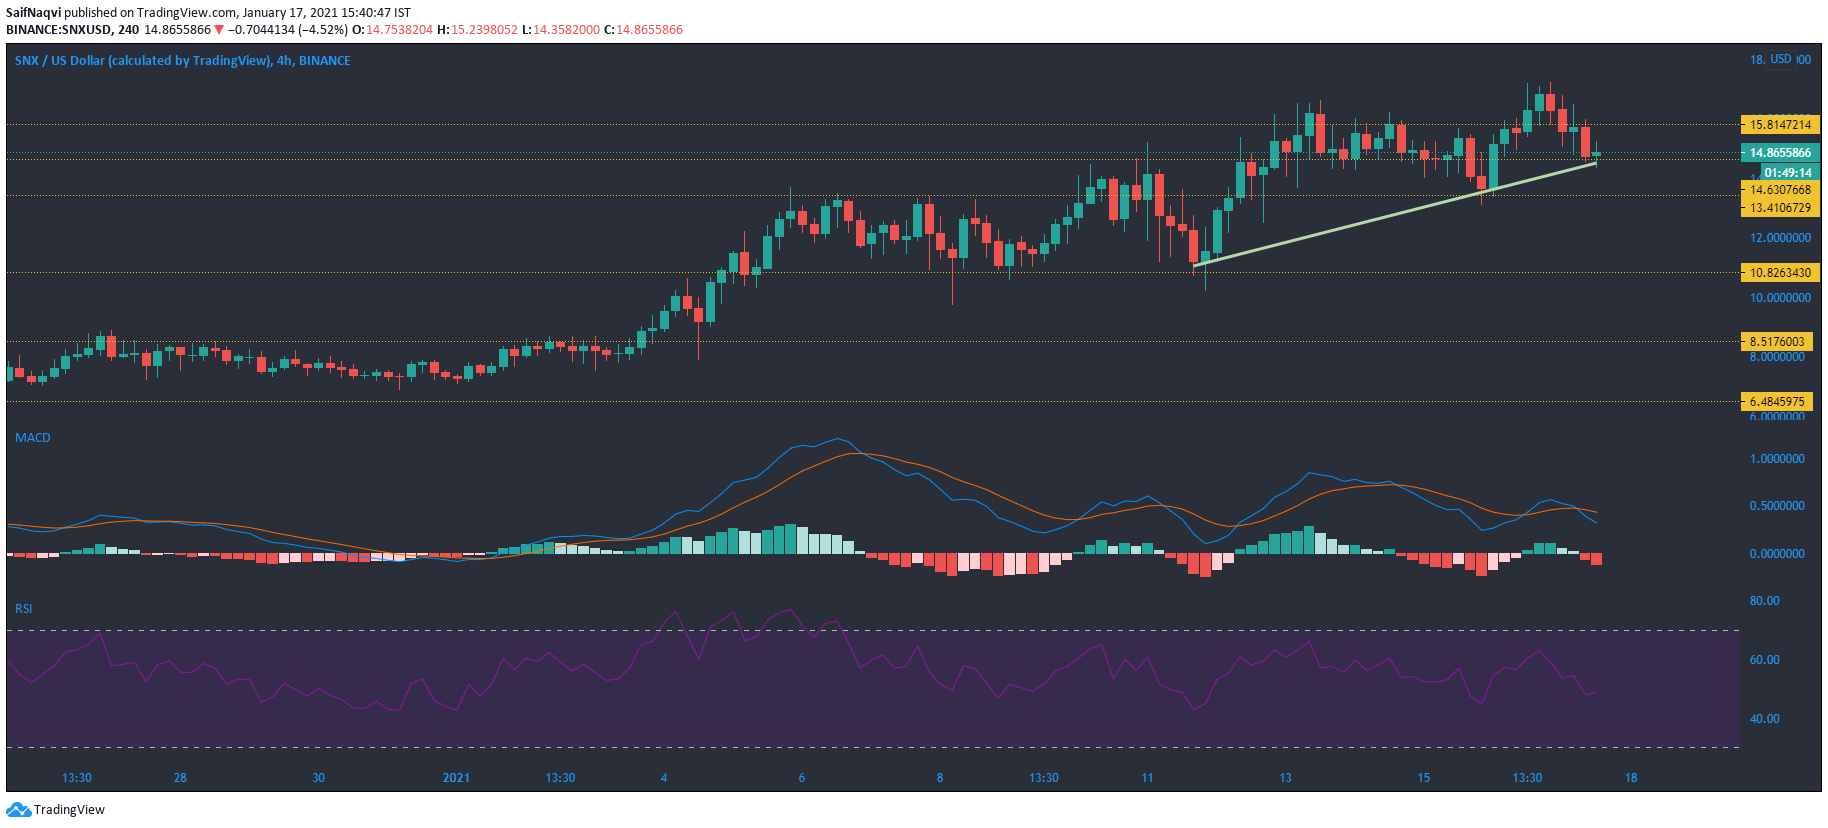
Synthetix hit an all-time high of $17.24 but immediately dropped by over 12% in the last few trading sessions. For now, losses were cut short at $14.63 support, but a fall below the present defense would confirm a bearish pullback.
The Relative Strength Index pointed downwards from the neutral zone. If the index moves into the oversold region, the price could follow suit and drop towards $13.41 support.
The MACD witnessed a bearish crossover as the price fell from record levels. The red bars on the histogram suggested the likelihood of a further pullback in prices.