
The crypto market has been sideways in the past few days after an intense wave of selling. Binance Coin and Litecoin have also been moving sideways after a bounce in the past few days, however, the market structure still had a bearish outlook. Dogecoin has formed an ascending channel, while Waves also has a bearish market structure in the near term.
Binance Coin (BNB)
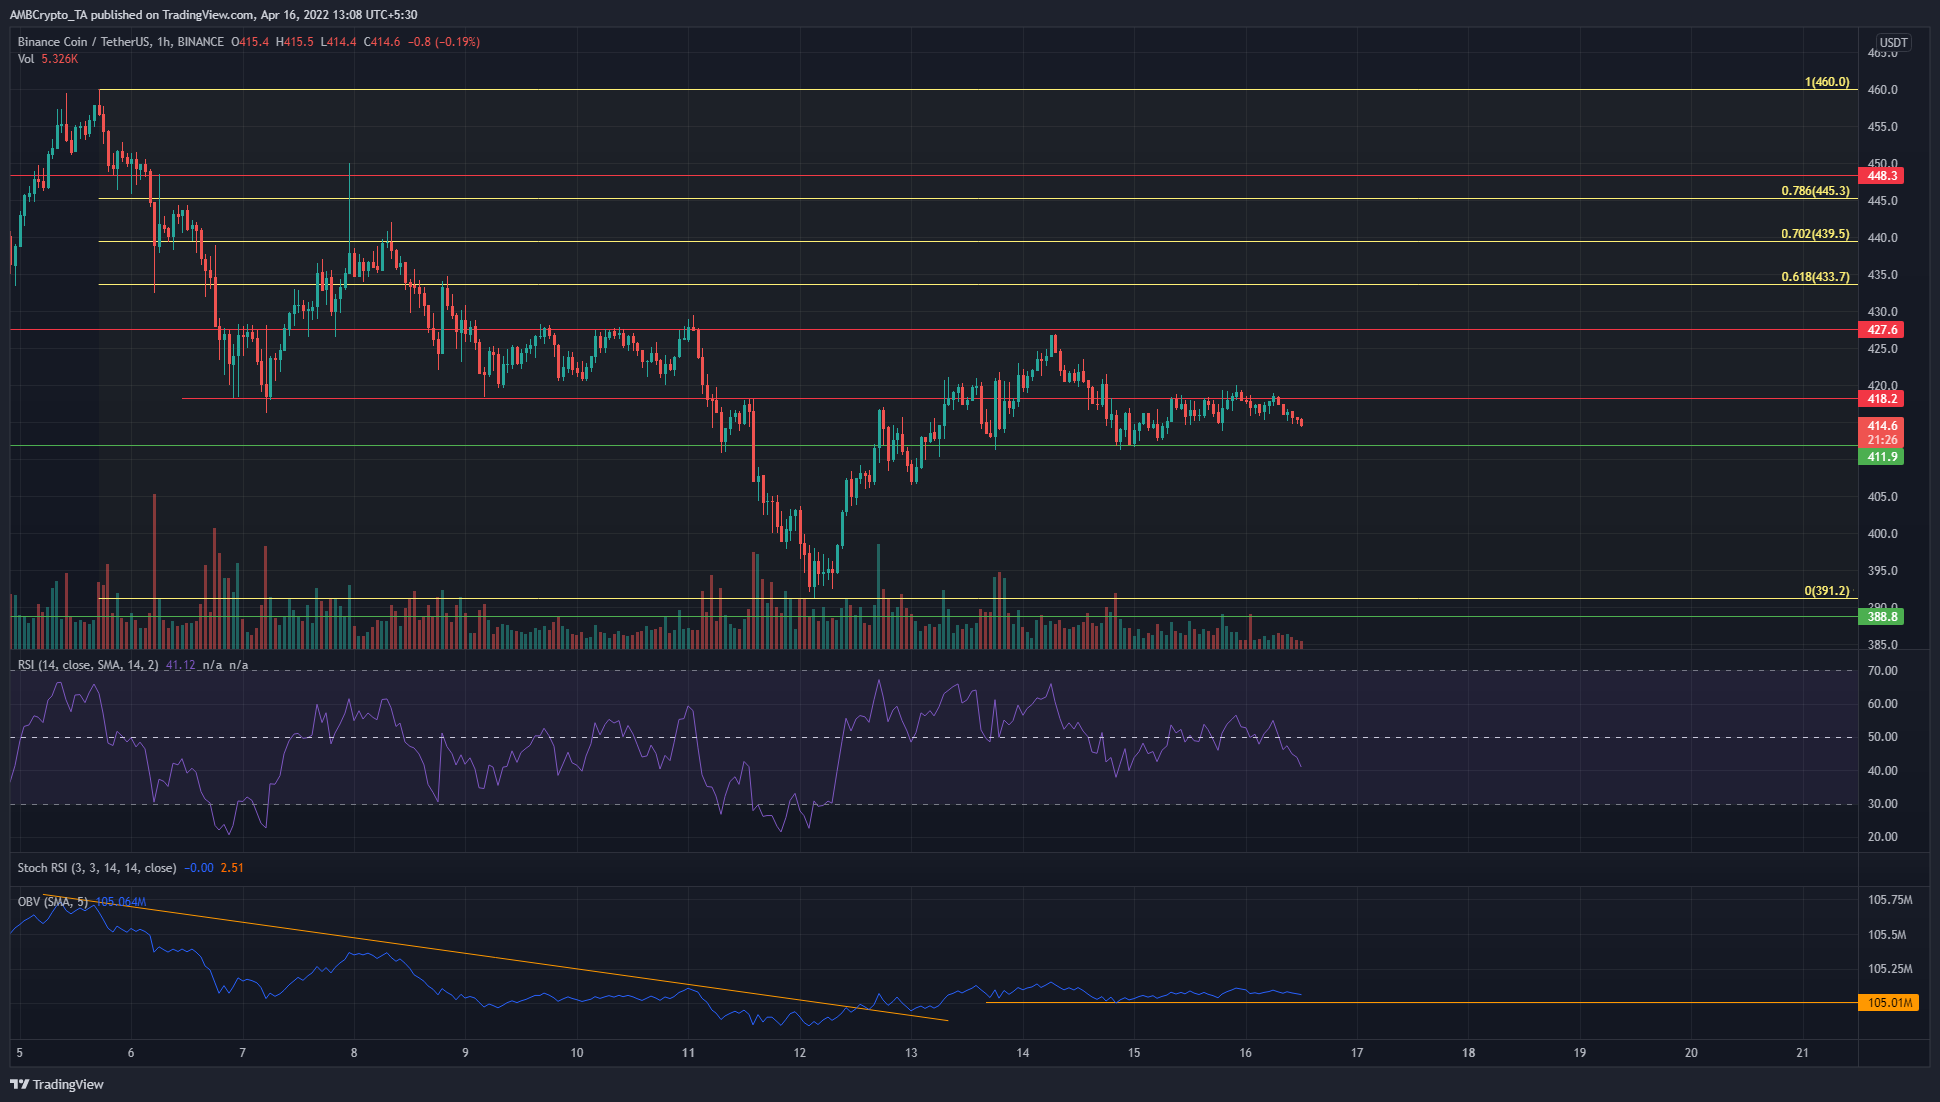
Source: BNB/USDT on TradingView
For Binance Coin, the $418.2 resistance level is a strong level of resistance for the past week. After dipping as far south as $395, BNB saw a bounce to $425. The price has been on a downtrend, or a pullback, from the $460 level. However, BNB has been on an uptrend since late February which meant this move downward could be just a pullback.
The RSI has been hovering around neutral 50 in the past few days and stood at 41 at press time. The OBV has also been in a downtrend but has gone flat in the past couple of days.
Dogecoin (DOGE)
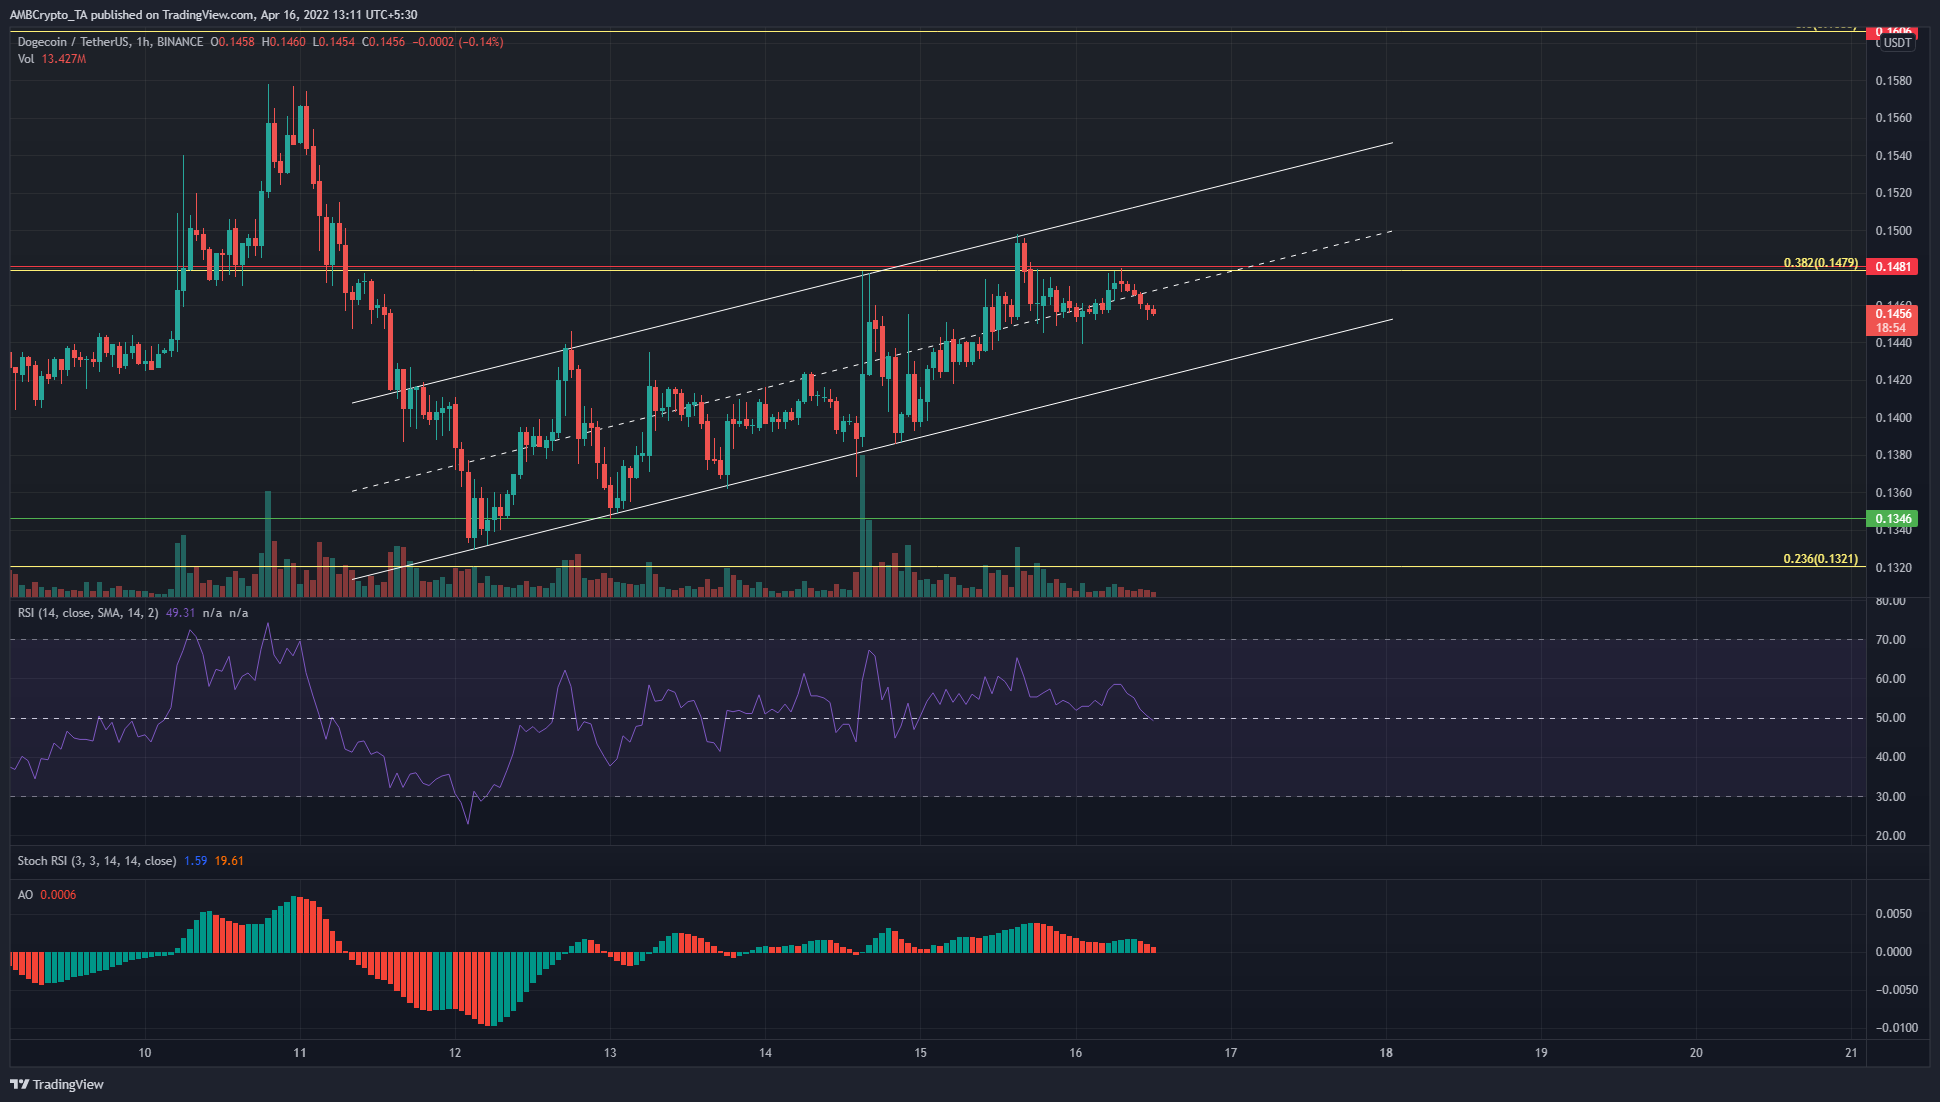
Source: DOGE/USDT on TradingView
Dogecoin has traded within an ascending channel (white) and, at the time of writing it slipped beneath the mid-range. This development, combined with the rejection at the $0.148 level, meant DOGE could dip to the channel lows.
The channel lows could see DOGE bounce higher and possibly climb above the $0.148 level. The RSI stayed above neutral 50, but only barely. The Awesome Oscillator also showed bullish momentum, but not very strong momentum.
Litecoin (LTC)
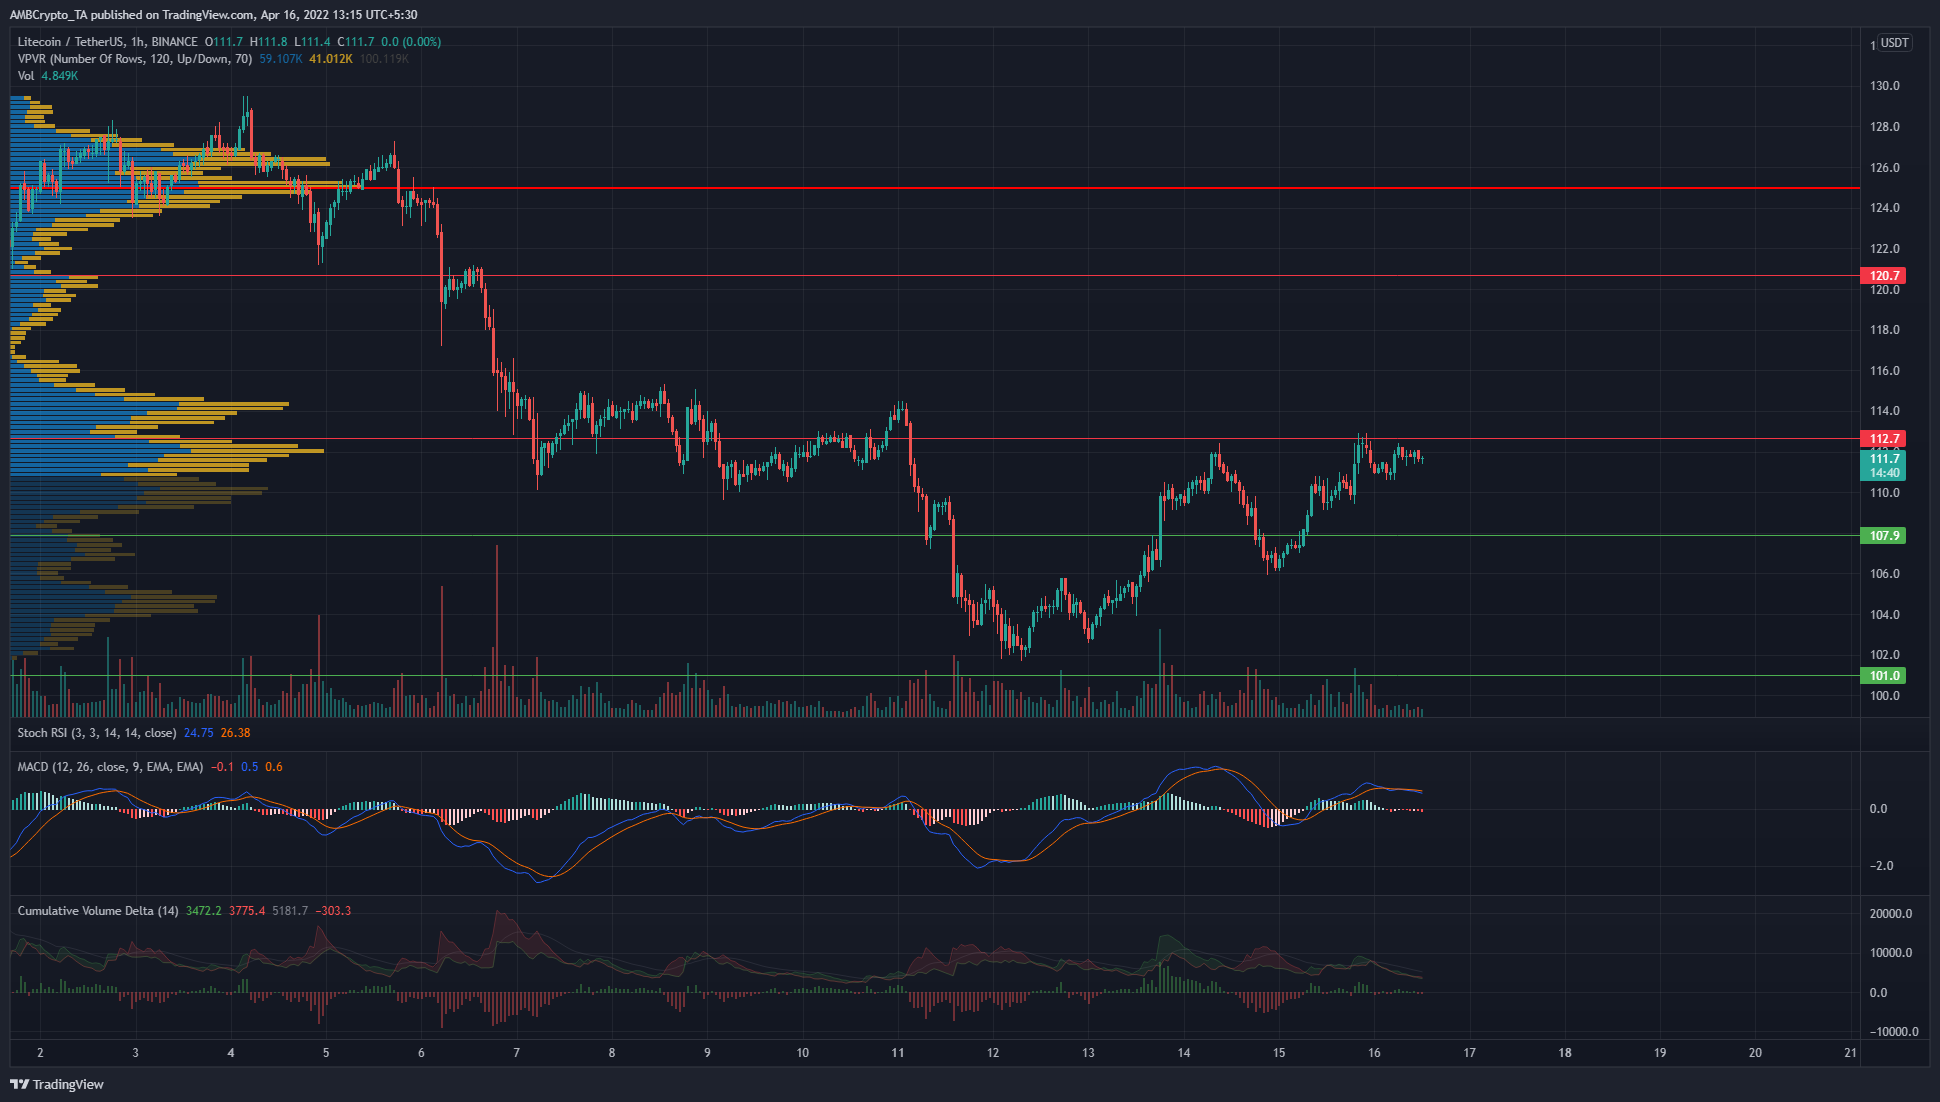
Source: LTC/USDT on TradingView
The Volume Profile Visible Range showed the Point of Control to be at $125. Other high volume nodes for the visible range lie at $$111, $114, and $127. At press time, LTC was trading at the Value Area Lows. If $112.7 can be flipped to support, a bullish move could materialize.
The MACD was flat in the past few days, although it has been above the zero line. The Cumulative Volume Delta did not show heavy buying nor selling in the past couple days, and even before then, has been oscillating from one side to the other.
Therefore, more sideways trading or a possible bullish move could be seen, especially if BNB can climb past $115.8.
Waves (WAVES)
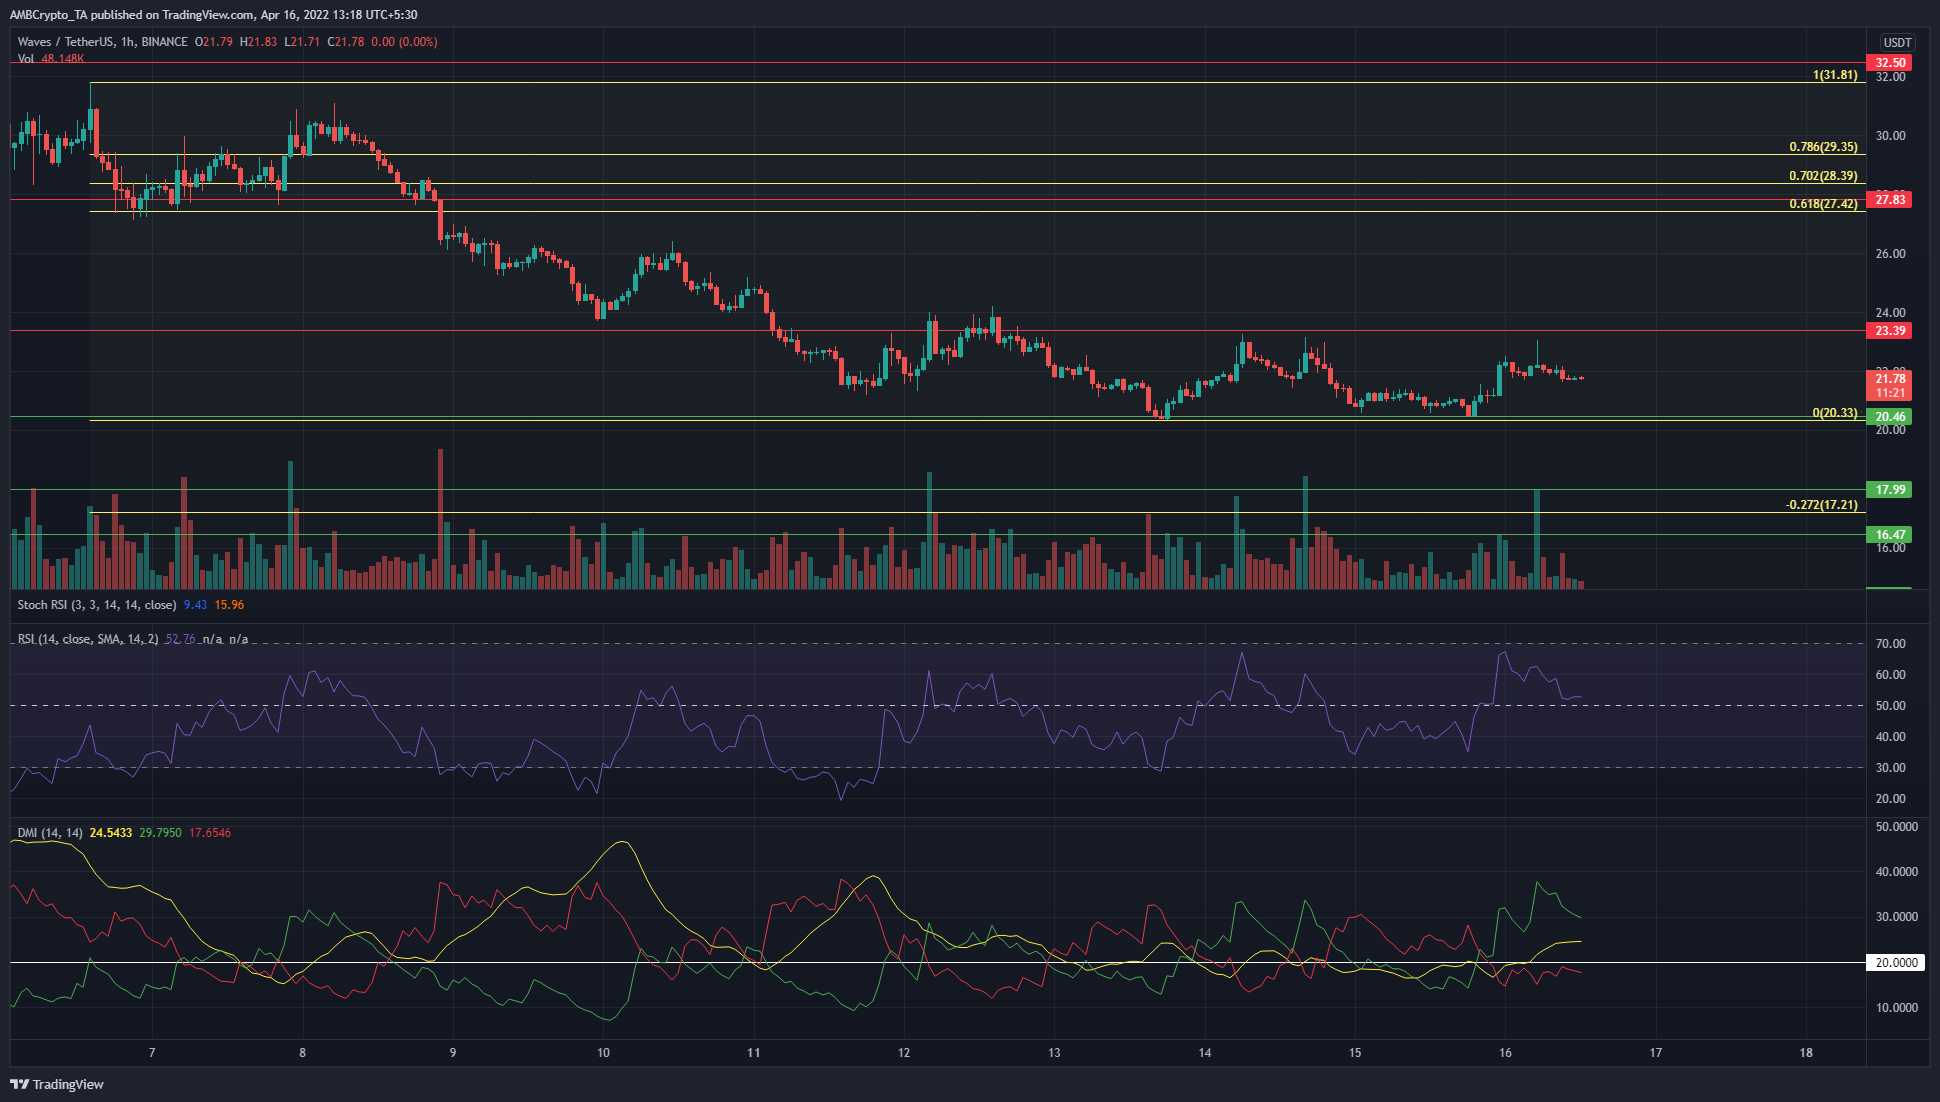
Source: WAVES/USDT on TradingView
Waves has a bearish market structure, as it has formed a series of lower highs and lower lows. The past few days have seen the price defend the $20.46 support level. Following this bounce from $20.46 to $22, the RSI climbed above the neutral 50 line to show bullish momentum.
The DMI also showed a strong bullish trend present in the lower timeframes, as the ADX (yellow) and the +DI (green) rose above the 20 mark. However, the $23.4-$24 area is likely to pose stiff resistance to the bulls.