Binance Coin, Ethereum Classic, VeChain Price Analysis: 22 January

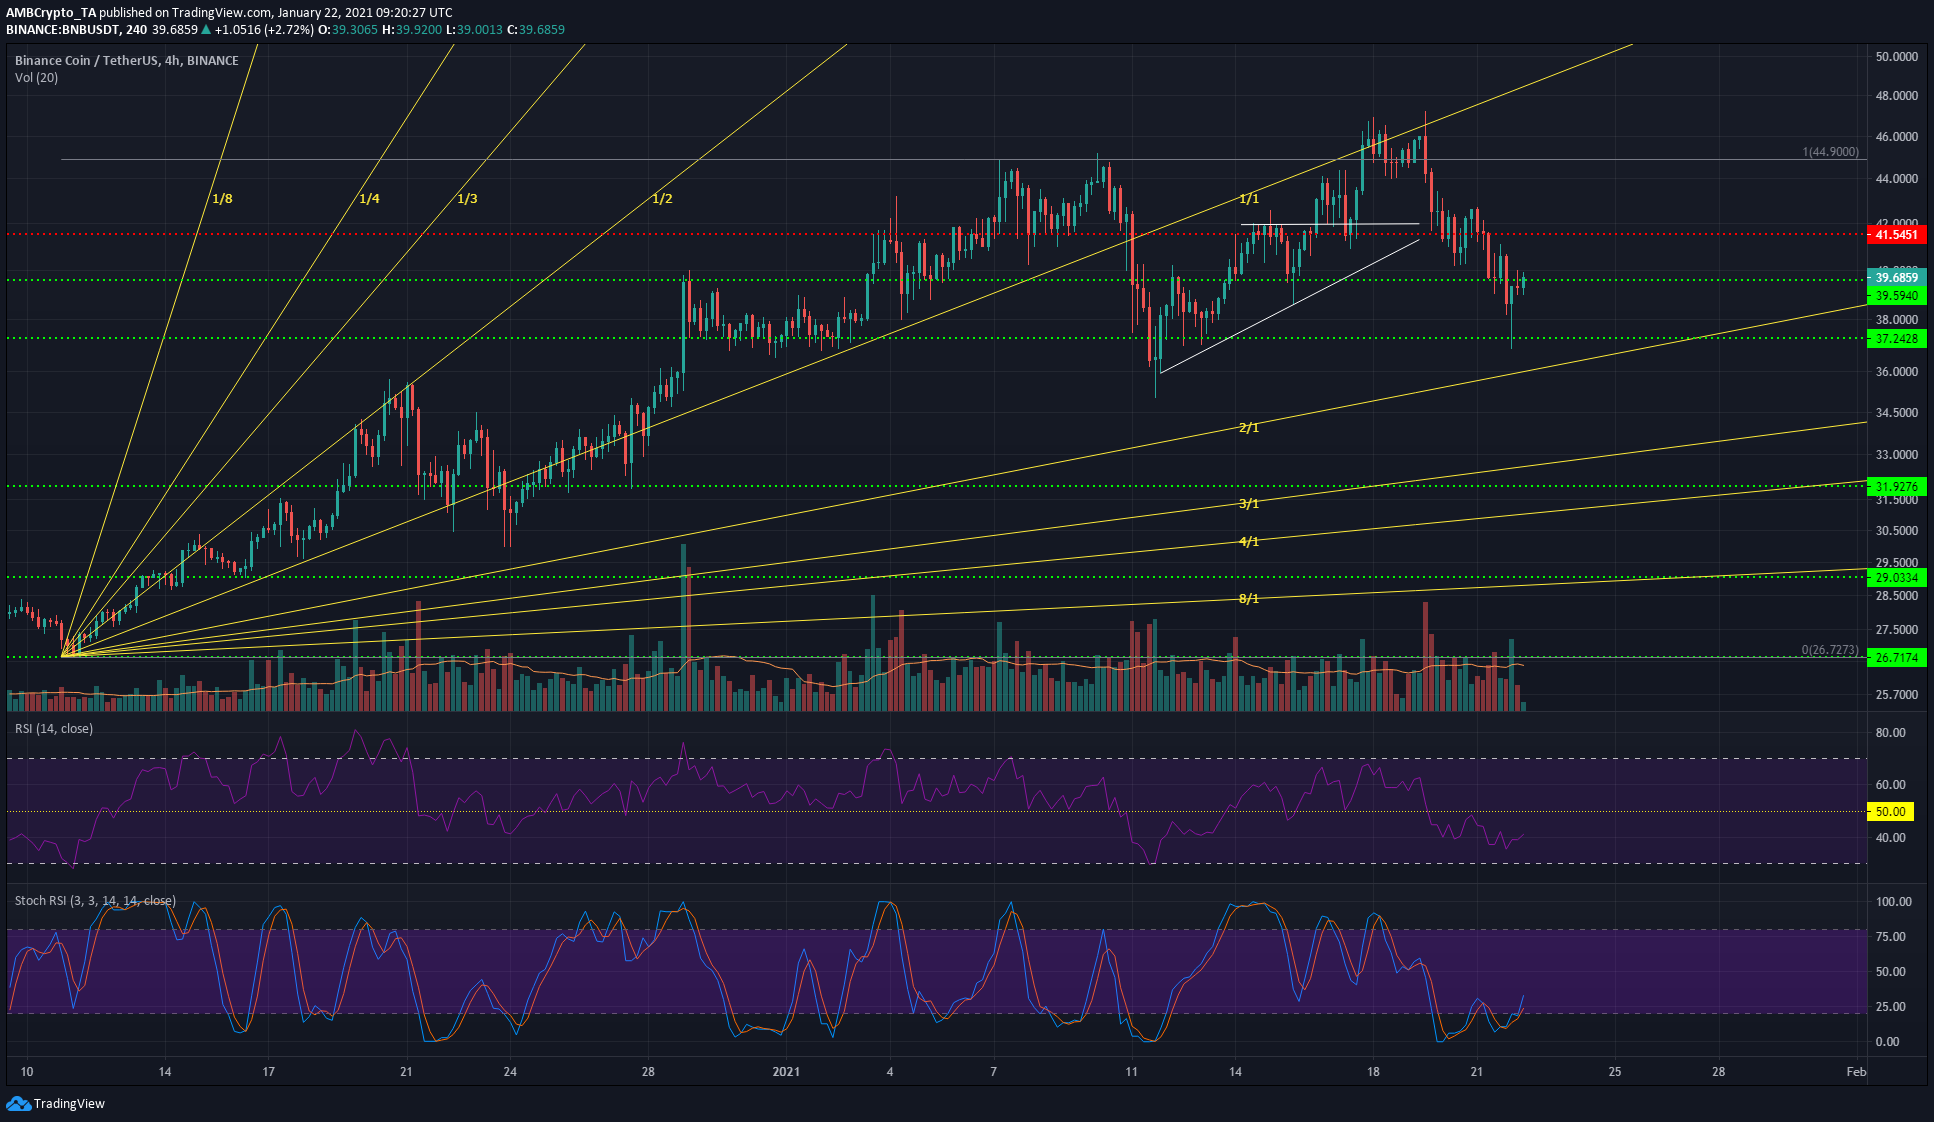
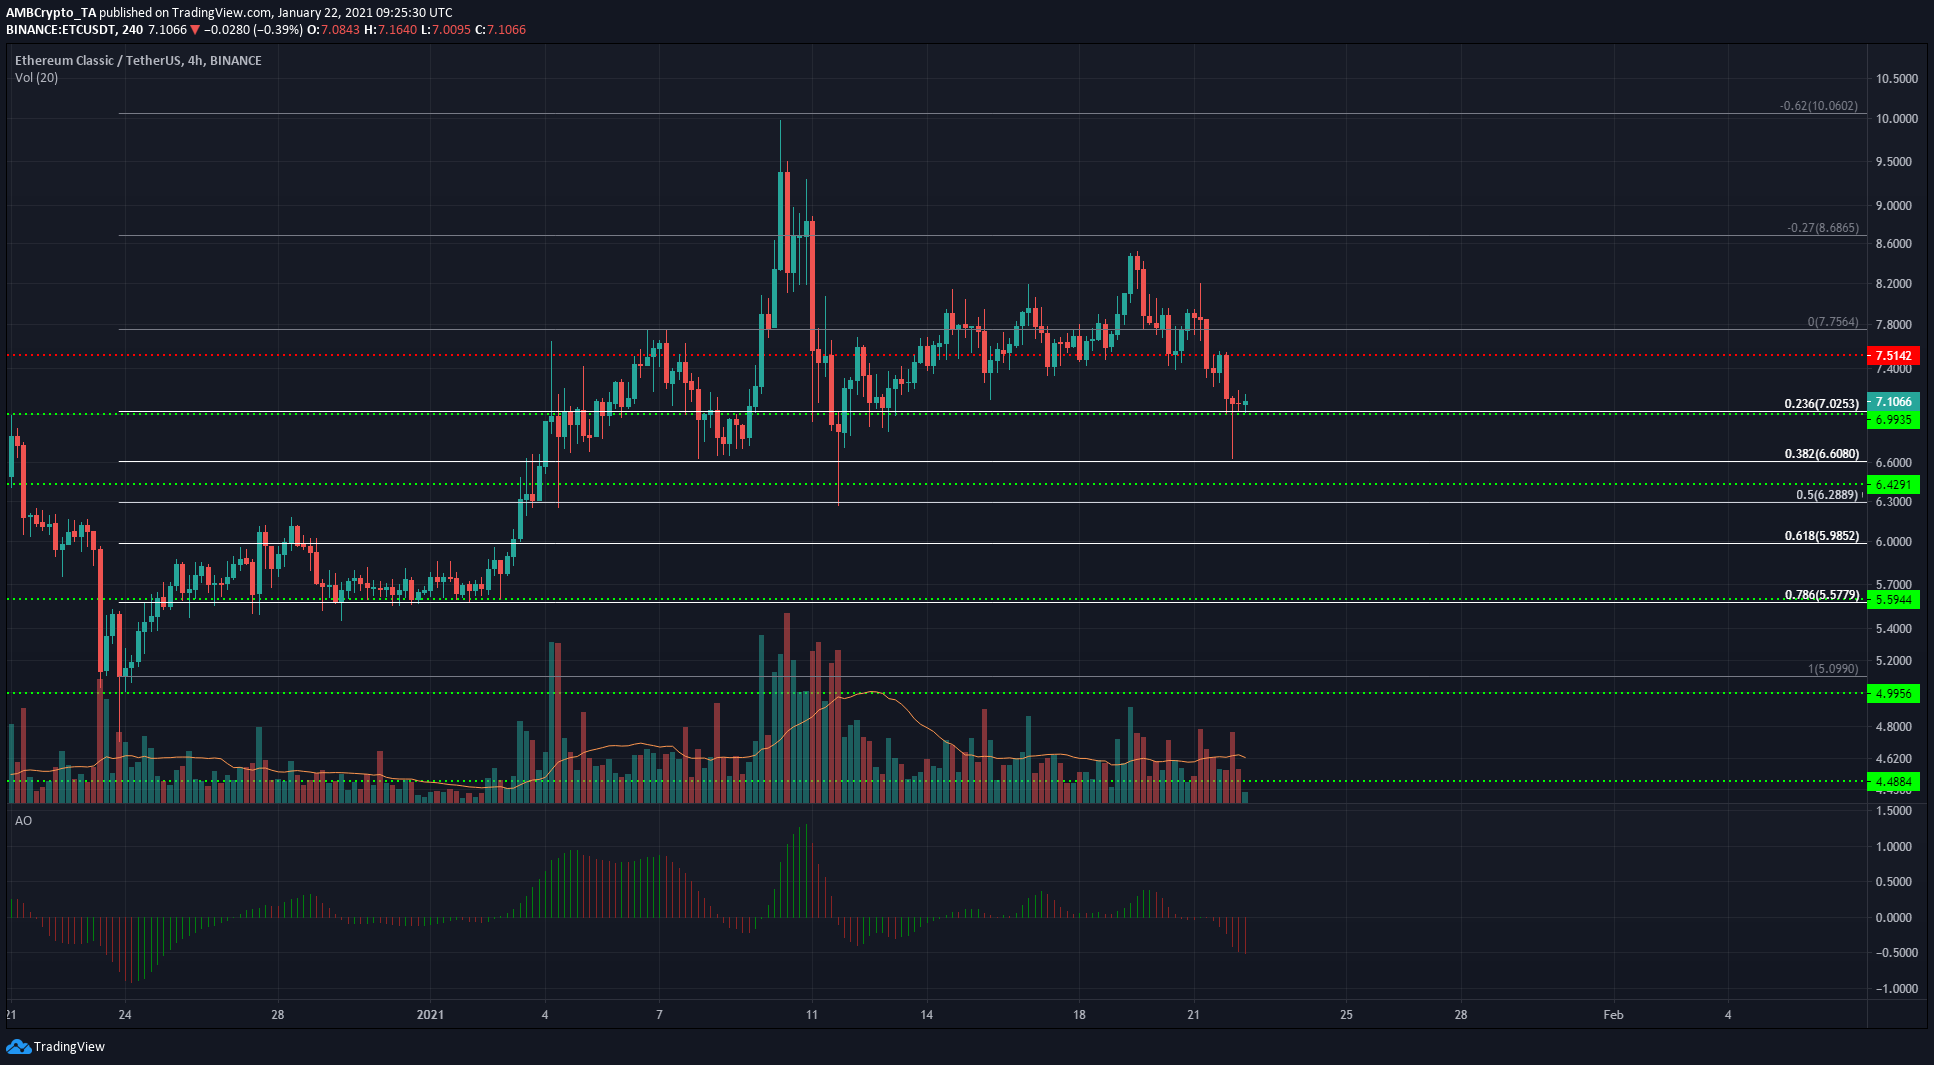
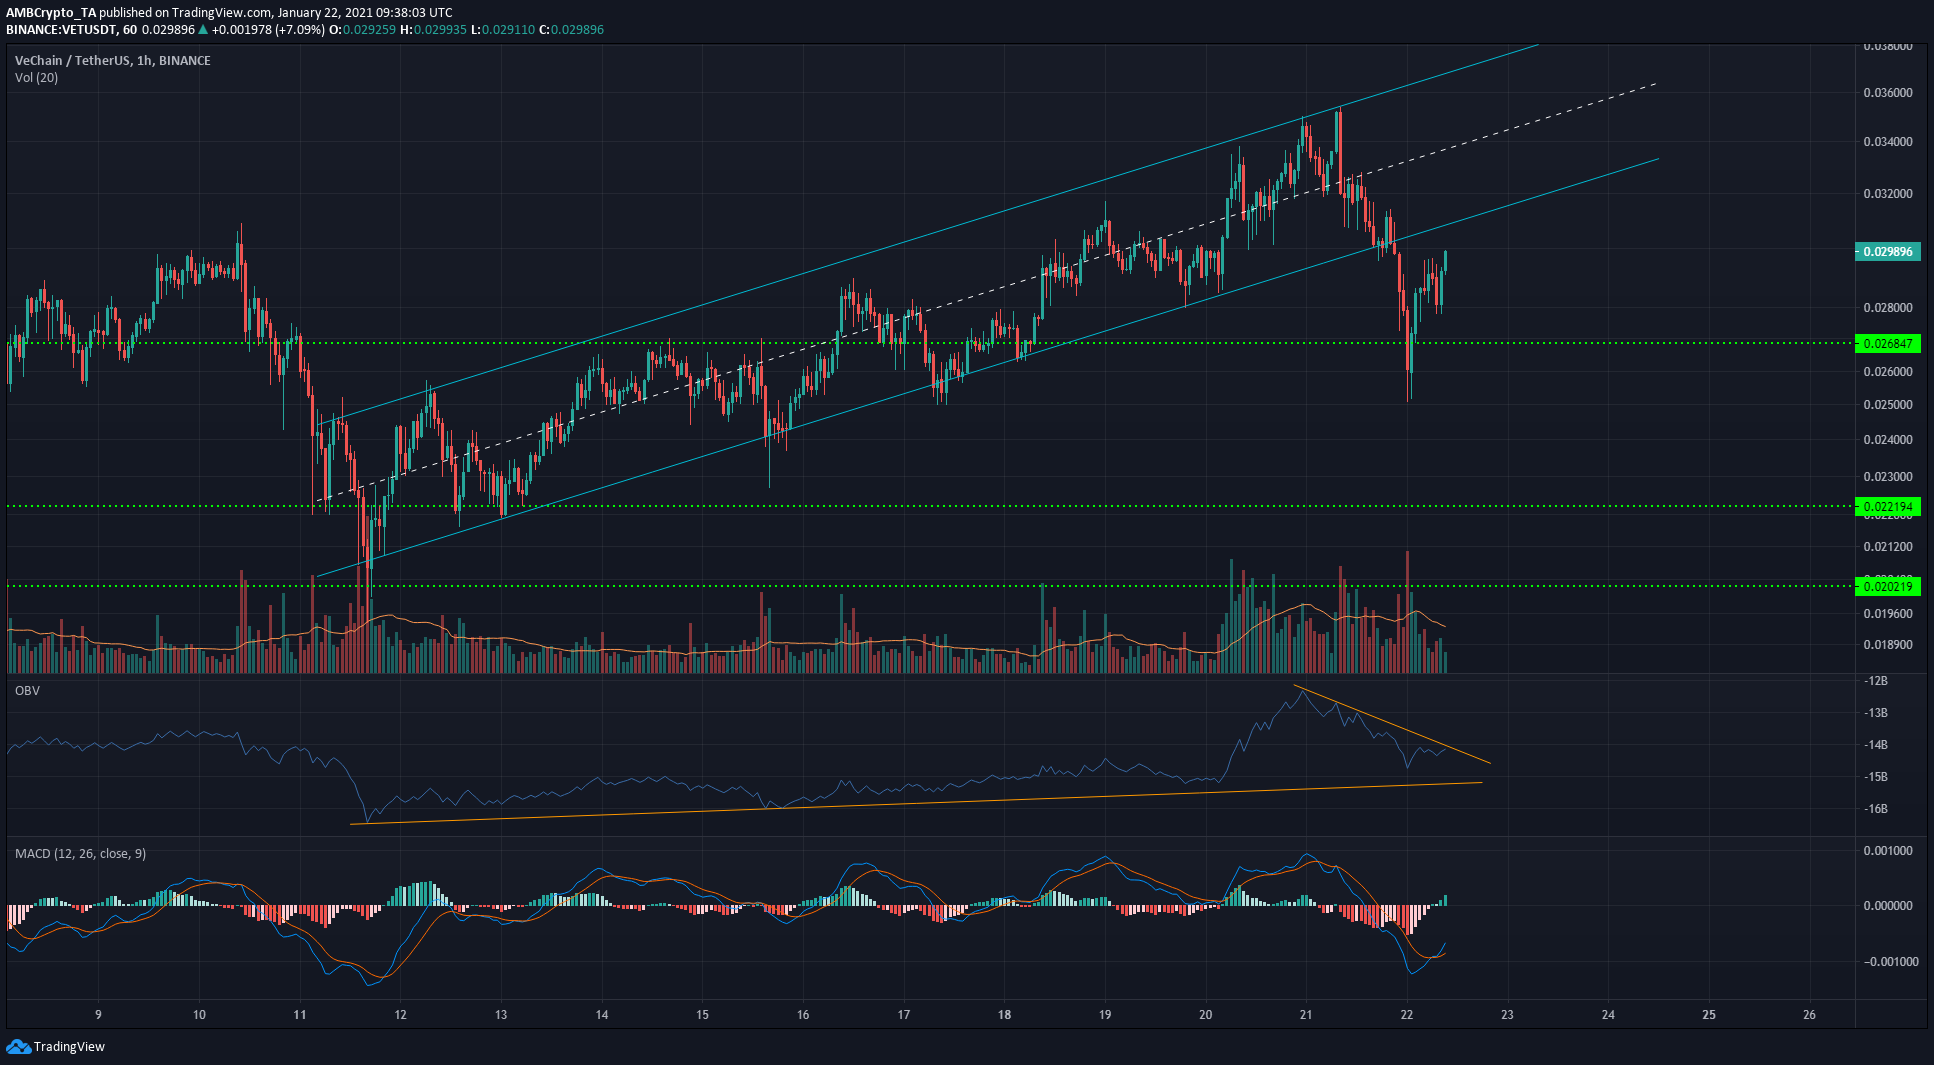
Binance Coin could be poised for a bounce to $41.5, but at the time of writing, it was facing south and the $40.4-region could pose some resistance to the price as well. Ethereum Classic clung to a level of support at $7 while VeChain was likely to rise to $0.031 and retest the boundary of the channel it was previously trading within.
Binance Coin [BNB]

Source: BNB/USDT on TradingView
The RSI for BNB was moving under the neutral 50-mark, indicating that a downtrend was in progress. However, the Stochastic RSI was in the oversold zone and while a bounce wasn’t very apparent, it could happen.
If BNB climbs past the $39.6-level, it would likely head towards the $41.5-level of resistance.
The Gann fan lines (yellow) represented areas of resistance and support, and the past week saw the 1:1 line resist BNB’s attempts to rise further, before the drop a couple of days ago. This could see BNB test the 2:1 line as support over the next week.
Ethereum Classic [ETC]

Source: ETC/USDT on TradingView
The confluence between the 23.6% Fibonacci retracement level (white) and horizontal support at $7 meant ETC had some strength in defense of that region, even as selling pressure mounted. The Awesome Oscillator also noted rising southbound momentum.
Less than 12 hours prior to writing, ETC saw a candlewick down to $6.6, but it was quickly bought up the charts. However, another drop under $7 might not find the same interest from buyers.
A move below $7 would see ETC test the $6.4-$6.6 region of support.
VeChain [VET]

Source: VET/USDT on TradingView
Using the 1-hour chart to better understand the OBV for VET, it can be seen that the past few hours of selling were a noticeable blip in the steady volume of buying that VET has seen over the past ten days.
VET fell outside the ascending channel it was forming – a bearish reversal signal that could see VET revisit the base of the channel. Yet, sellers were unable to force the price under $0.0252, and the MACD formed a bullish crossover under the zero line.
If VET retests the channel’s lower boundary and is rejected, it is likely to lose the $0.0268-level of support in the coming days. If the price climbs back into the channel, it would be a bullish signal.


