Binance Coin, Filecoin, CRV Price Analysis: 18 January

While the market sentiment still struggles to flip the long-term bearish tendencies, Binance coin, Filecoin and CRV flash bearish near-term technicals. Now, the buyers needed to step in and retest the immediate hurdles and prevent a further breakdown.
Binance Coin (BNB)
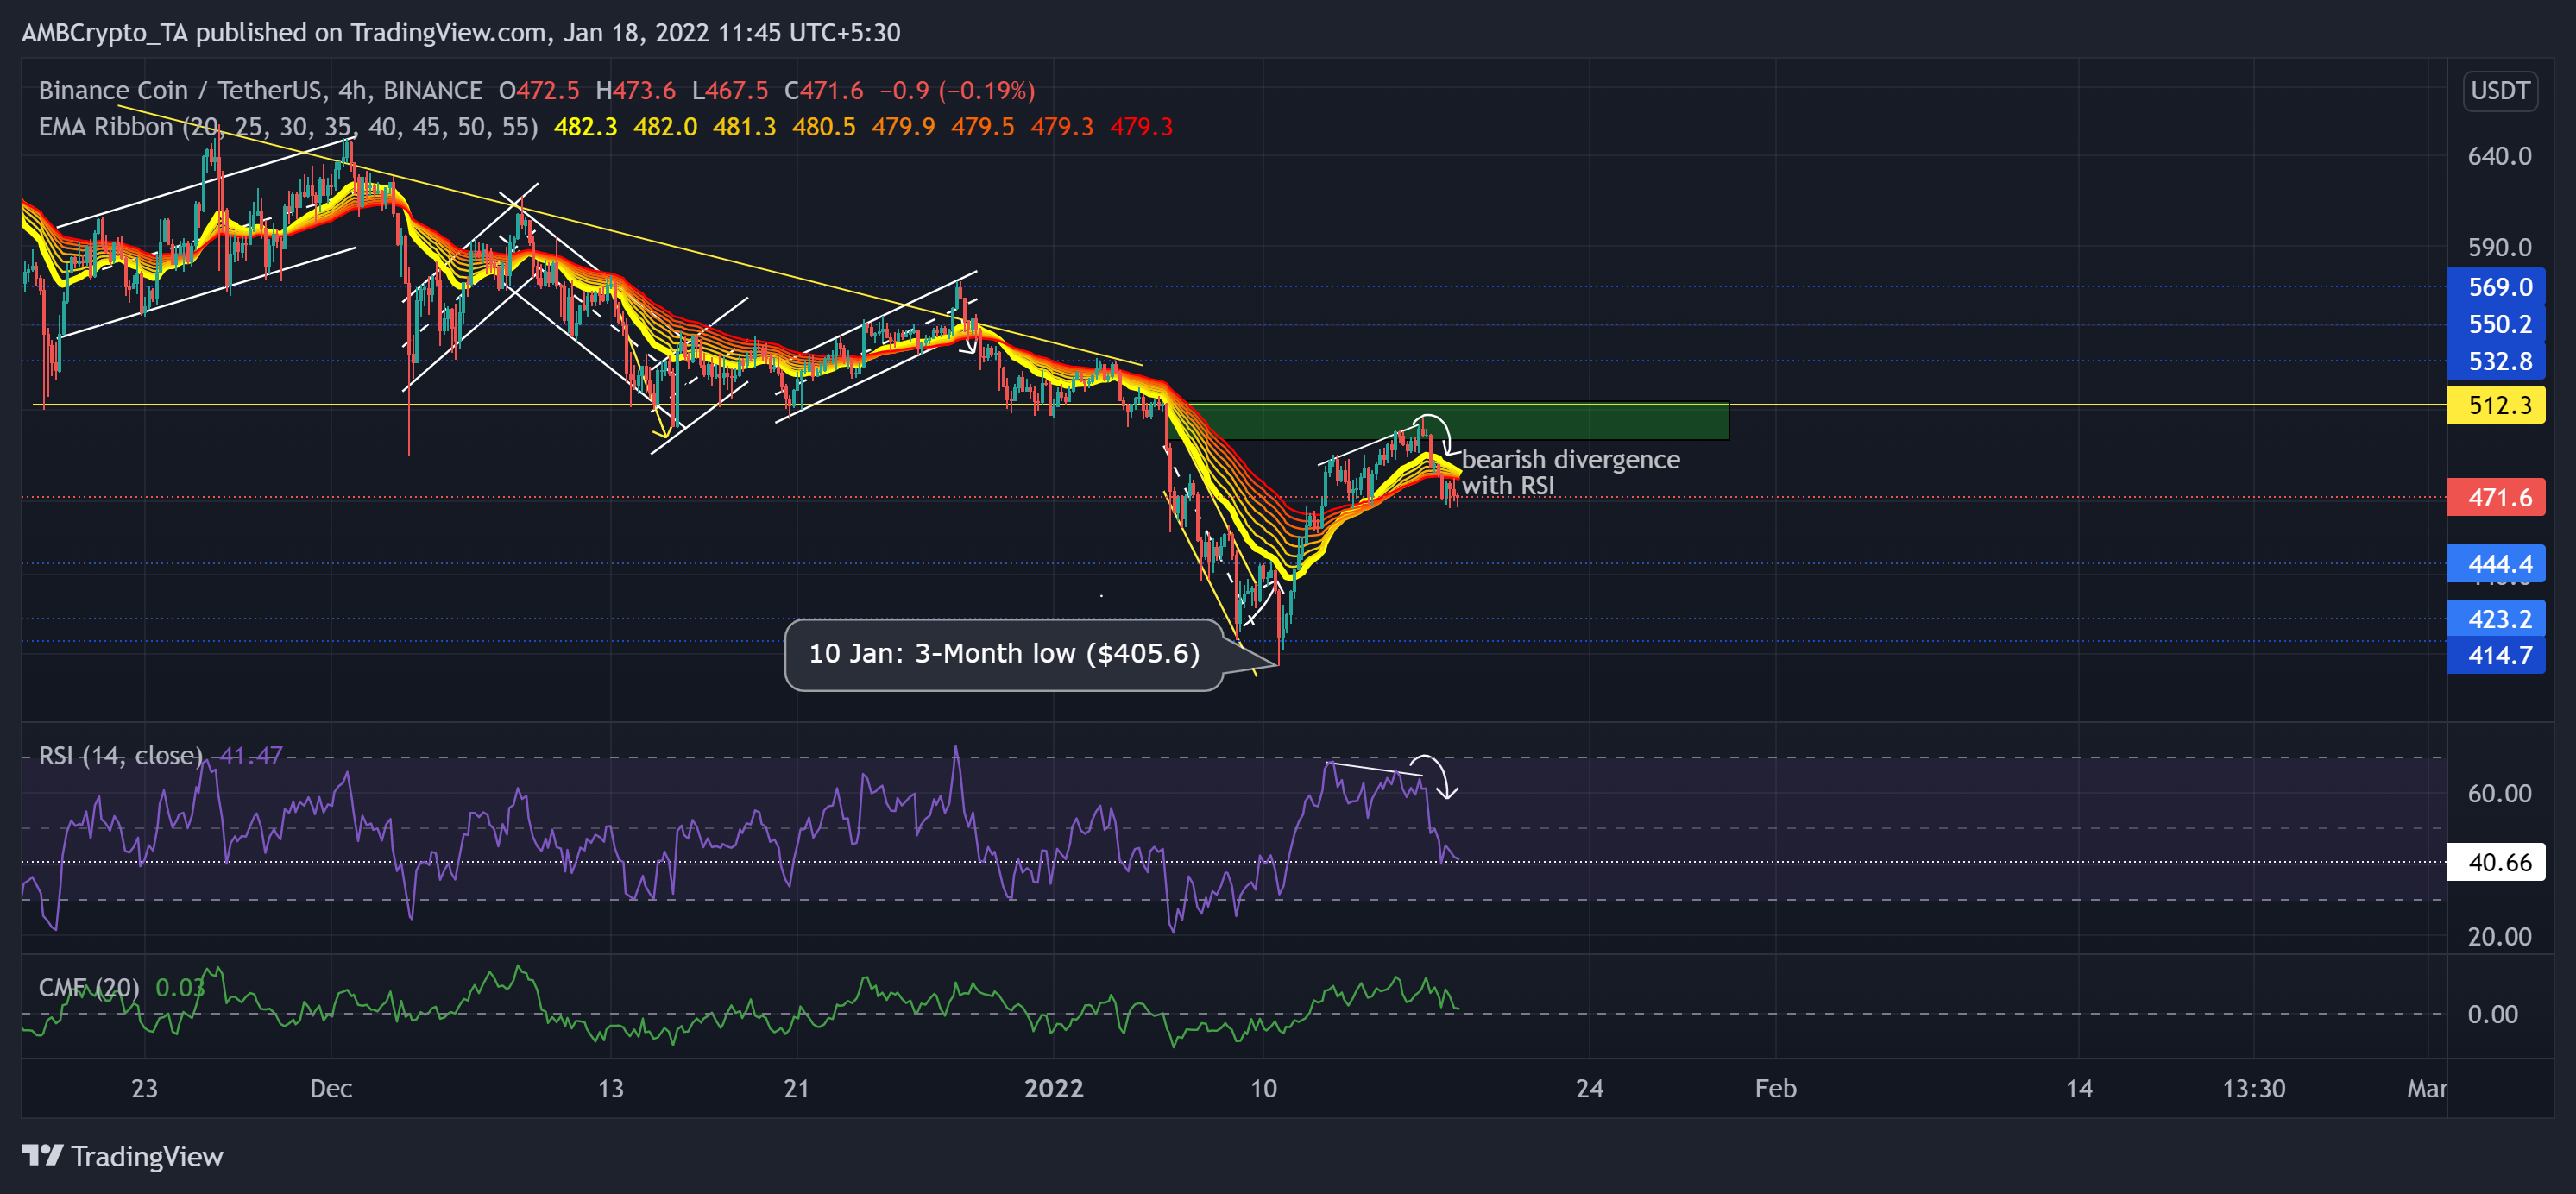
The 5 January sell-off fueled BNB’s existent bearish vigor as the alt broke down in a down-channel (yellow). BNB lost 21.8% of its value (from 5 January) and poked its three-month low on 10 January.
However, the alt rallied above its EMA ribbons and recovered the previous losses. But saw a pullback from the $500 near-term supply zone (rectangle, green). Now, as the last few red candlesticks engulfed the green ones, the EMA ribbons seemed to flip toward the bearish side.
At press time, the alt traded at $471.6. The RSI saw a plunge after a bearish divergence with the price action. It tested the 40-level support twice over the past day and preferred the sellers. Nevertheless, the CMF managed to stay above the zero-line. This reading entailed that the money flows did not see a huge backlash yet.
Filecoin (FIL)

The alt saw a 31.97% retracement (from 5 January) from the crucial $35-mark resistance (previous support) until it poked its 11-month low on 10 January. On its 4-hour chart, FIL saw a down-channel (yellow) breakout over the past week.
Since then, the recovery halted phase halted at $30.6-level as the bulls keep retesting it. Now, the Supertrend flashed a buy signal hinting at a possible recovery from the trendline support (white). The immediate testing resistance now stood at the 20-SMA (red).
At press time, FIL traded at $28.84. The RSI failed to sustain a close above the 58-level and dropped below the half-line. Now, it displayed a bearish bias. Besides, the Squeeze Momentum Indicator indicated a low volatility phase by flashing black dots.
Curve DAO Token (CRV)
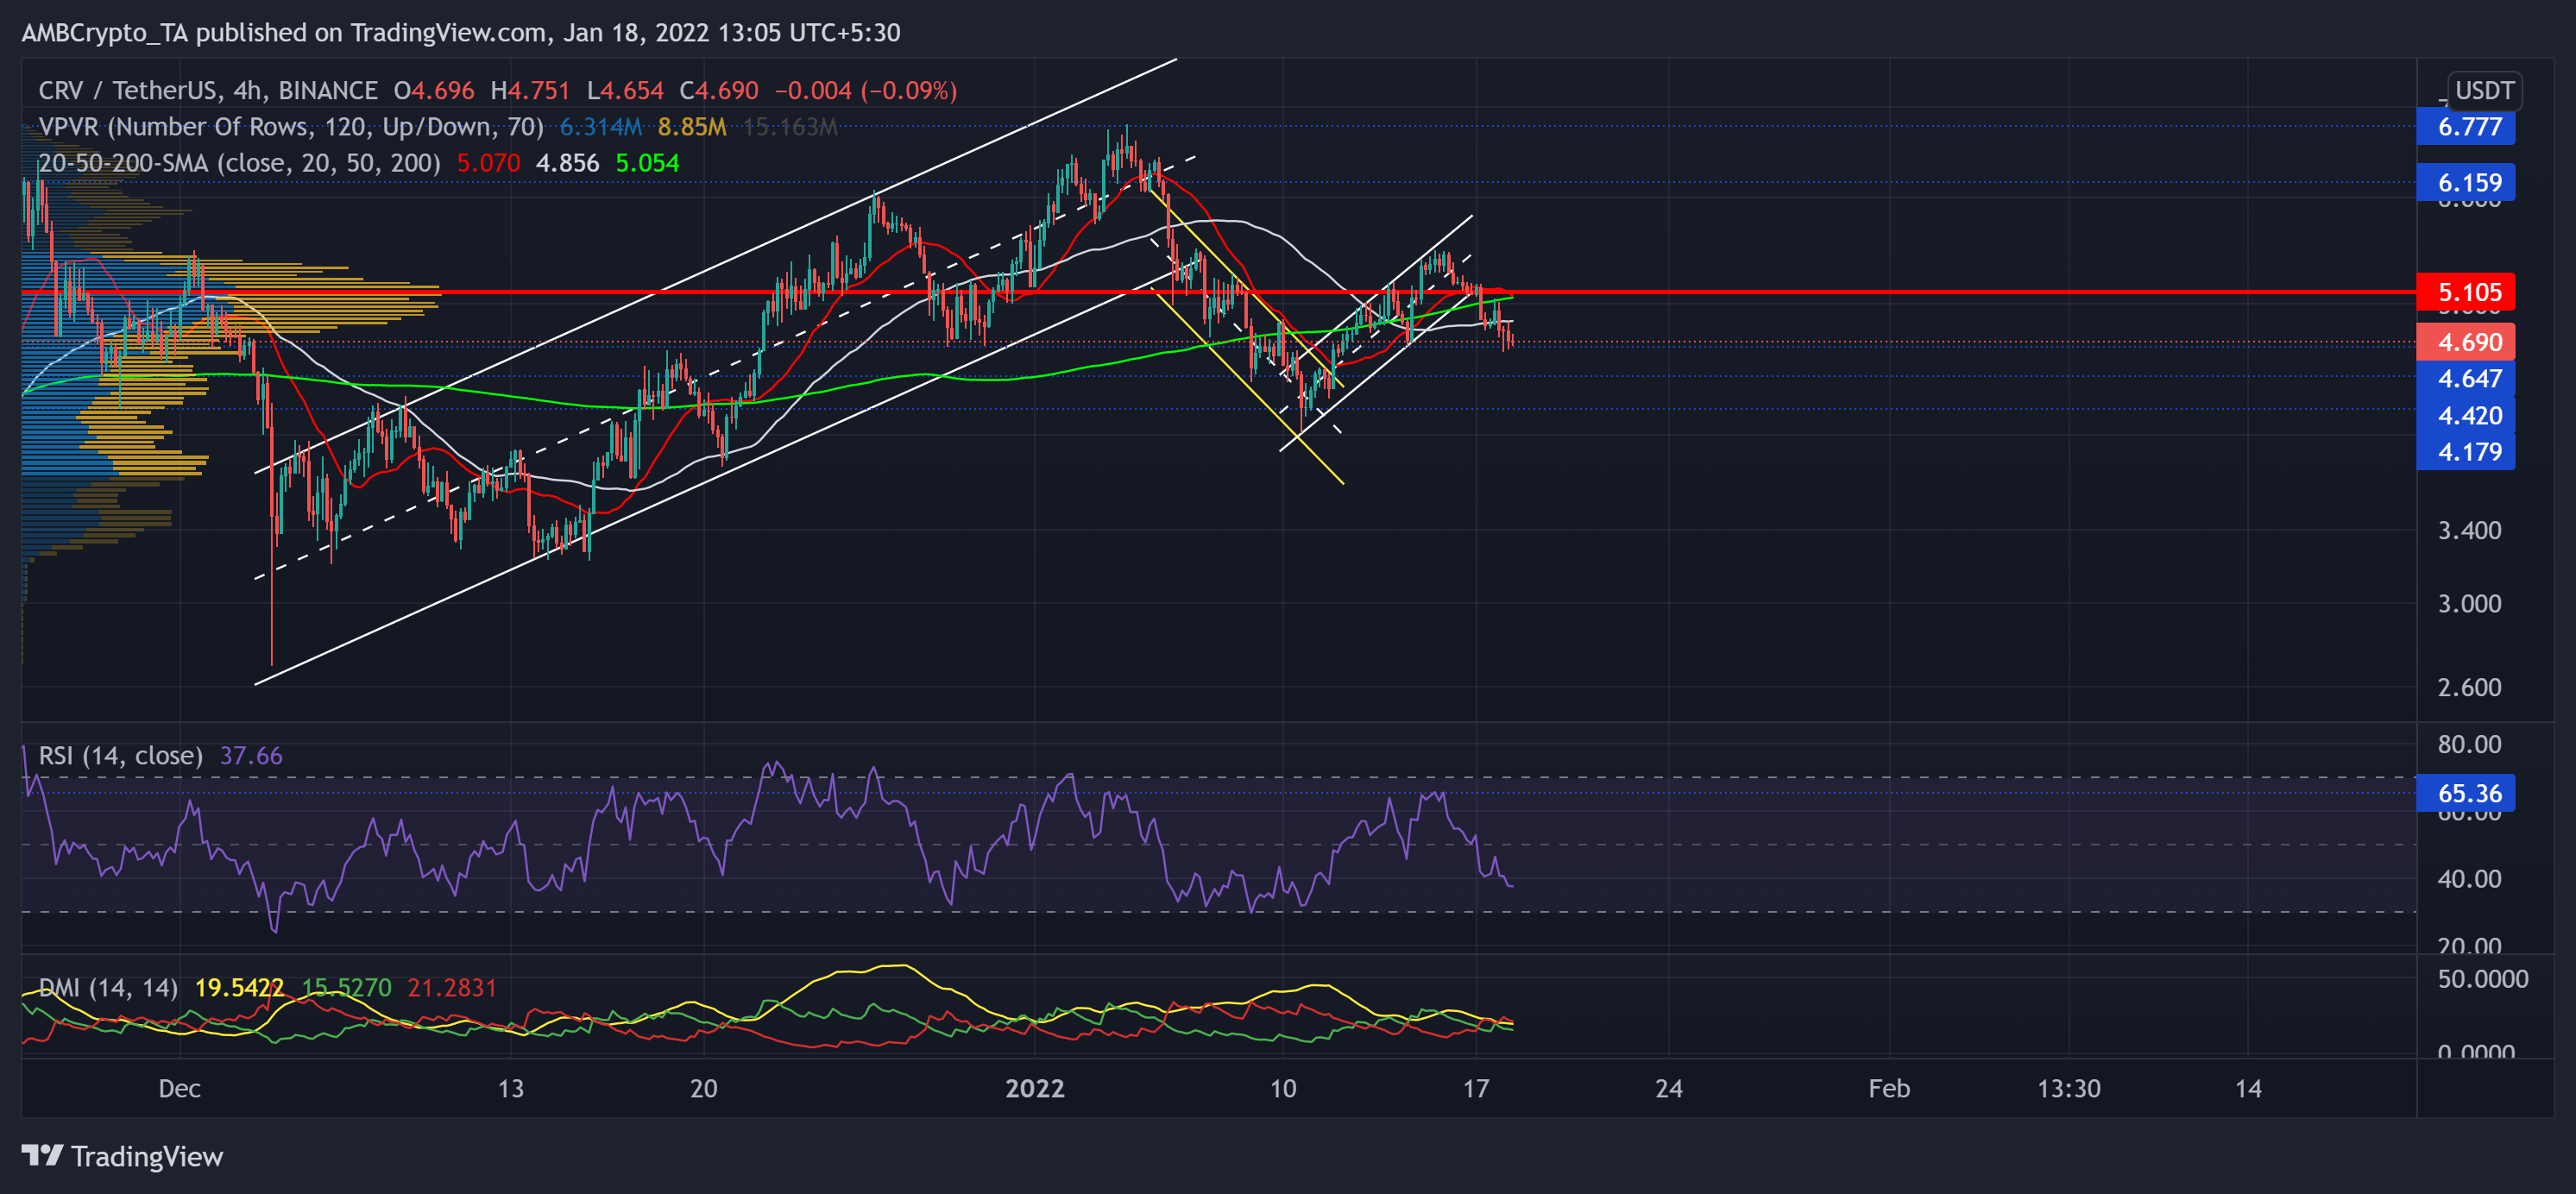
Since 22 October, the alt found an oscillating range between $6.159 and the $3.28-mark. The $5.1-mark offered the highest liquidity for nearly two months. The up-channel (white) breakdown breached the Point of Control (red) after an over 40% decline until 10 January.
Now, the 20 SMA (red) and the 200 SMA (green) were on the verge of a bearish crossover, hinting at decreasing buying pressure. The immediate testing support stood near the $4.64-mark.
At press time, CRV traded below its 20-50-200 SMA at $4.69. The RSI saw a 29 point plunge in the last three days and still showed no revival signs. Also, the DMI confirmed the bearish edge. But the ADX displayed a weak directional trend for the alt.