Binance Coin looks bearish in the short-term, but…

Disclaimer: The information presented does not constitute financial, investment, trading, or other types of advice and is solely the writer’s opinion.
- Binance Coin showed a bearish trend developing on the 4-hour price chart.
- This finding was countered by the spot-CVD metric.
Even though it was one of the largest exchanges by trading volume, Binance [BNB] has faced its fair share of regulatory troubles in recent weeks.
Read Binance Coin’s [BNB] Price Prediction 2023-24
The latest was in Belgium, where the country’s leading financial regulatory authority demanded an immediate halt to Binance’s services to local customers.
If this trend continues, it could have an increasingly negative impact on Binance Coin’s usage, adoption, and ultimately prices. Already, Binance Coin suffered short-term losses and entered a lower timeframe downtrend.
The H4 price action showed further losses were likely
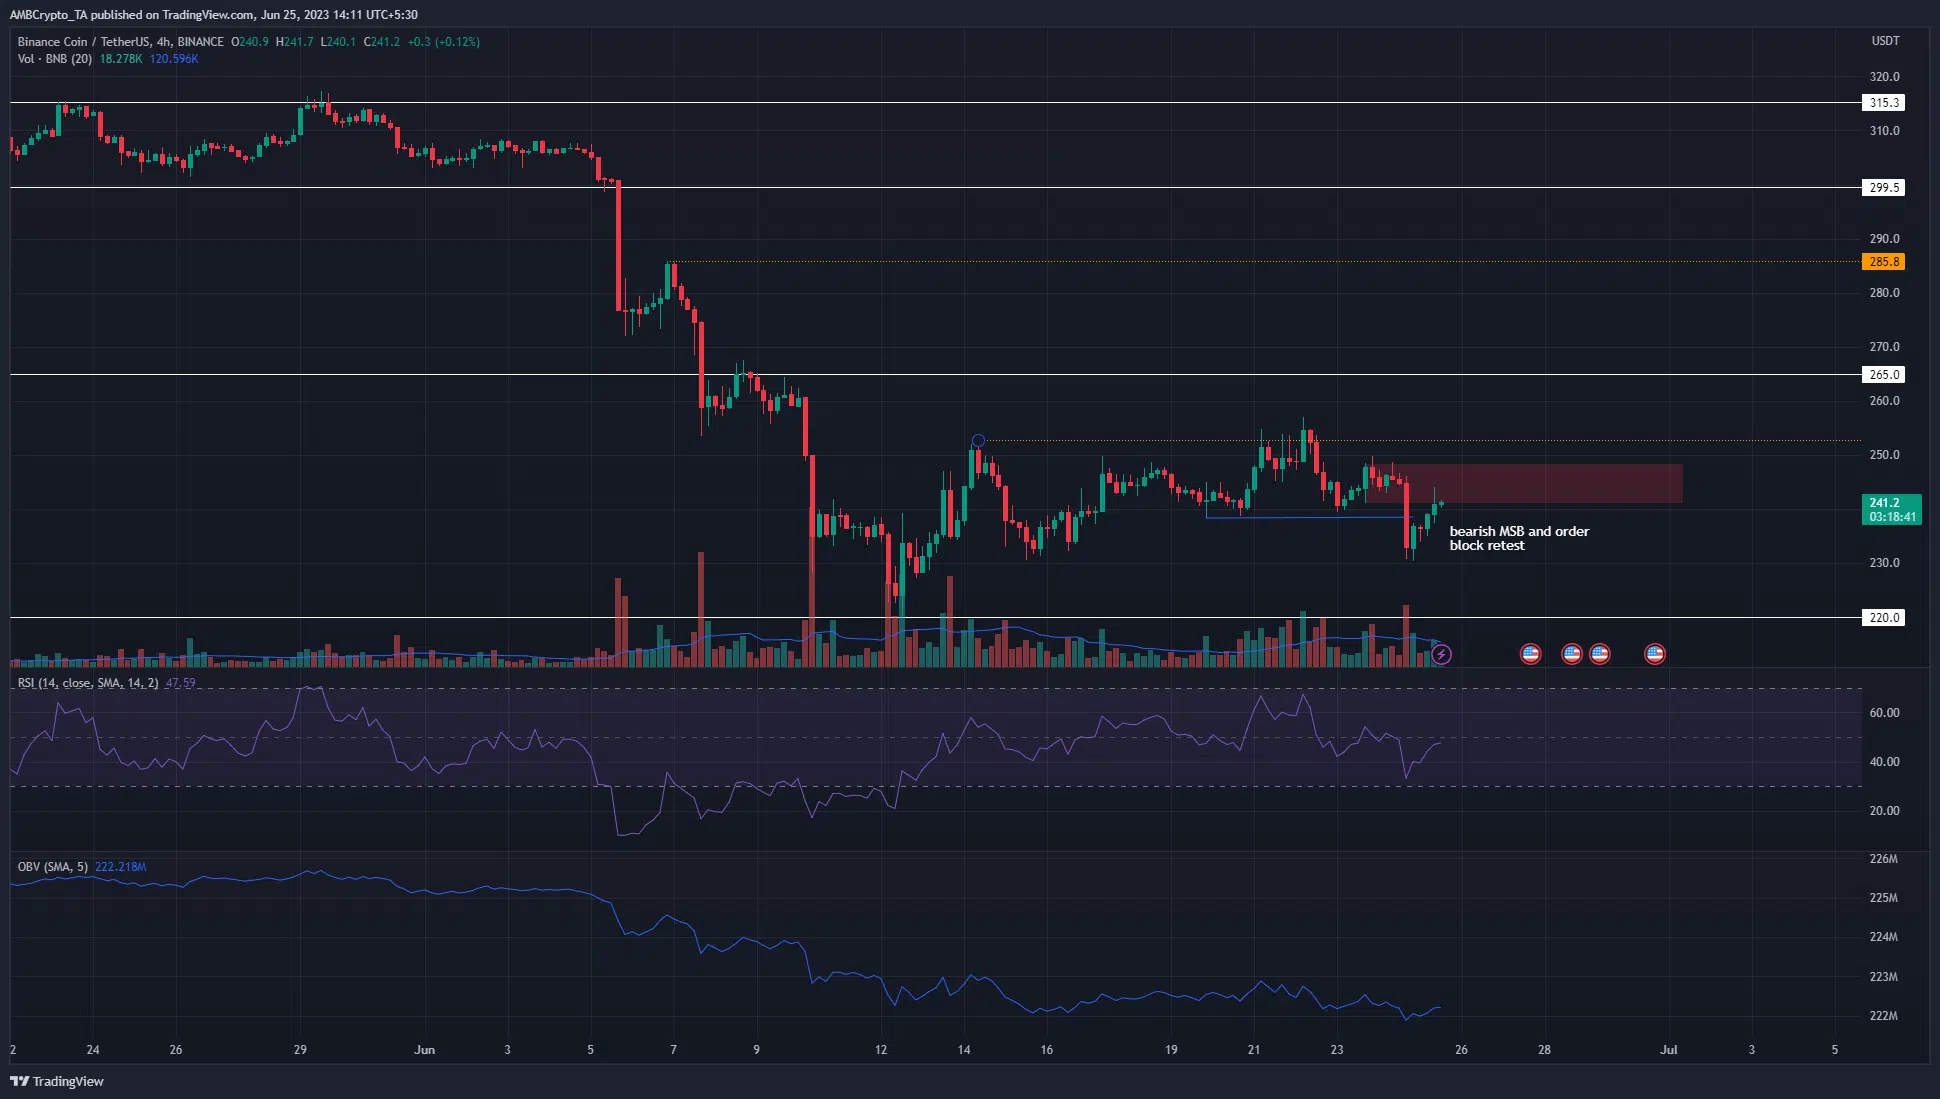
The 4-hour chart showed that Binance Coin bulls were attempting to recover from 12 June to 21 June. On 22 June, BNB surged past a recent high at $252.8. However, instead of rallying higher, BNB began to tank.
Hence, the brief venture above $250 was likely a move to grab liquidity before reversing.
The bulls could not defend the short-term support at $247 and on 24 June, Binance Coin broke the short-term bullish market structure. This happened following the drop below the $238.5 level.
The $240.8-$248.8 region was the bearish order block from which the structure break commenced.
At the time of writing, Binance Coin prices were retesting this resistance. Rejection from this area and another leg down on the price chart were likely. The OBV has trended slowly lower over the past week, and the RSI stayed below neutral 50.
Coinalyze data showed short-term demand behind BNB was rising
Source: Coinalyze
Realistic or not, here’s BNB’s market cap in BTC’s terms
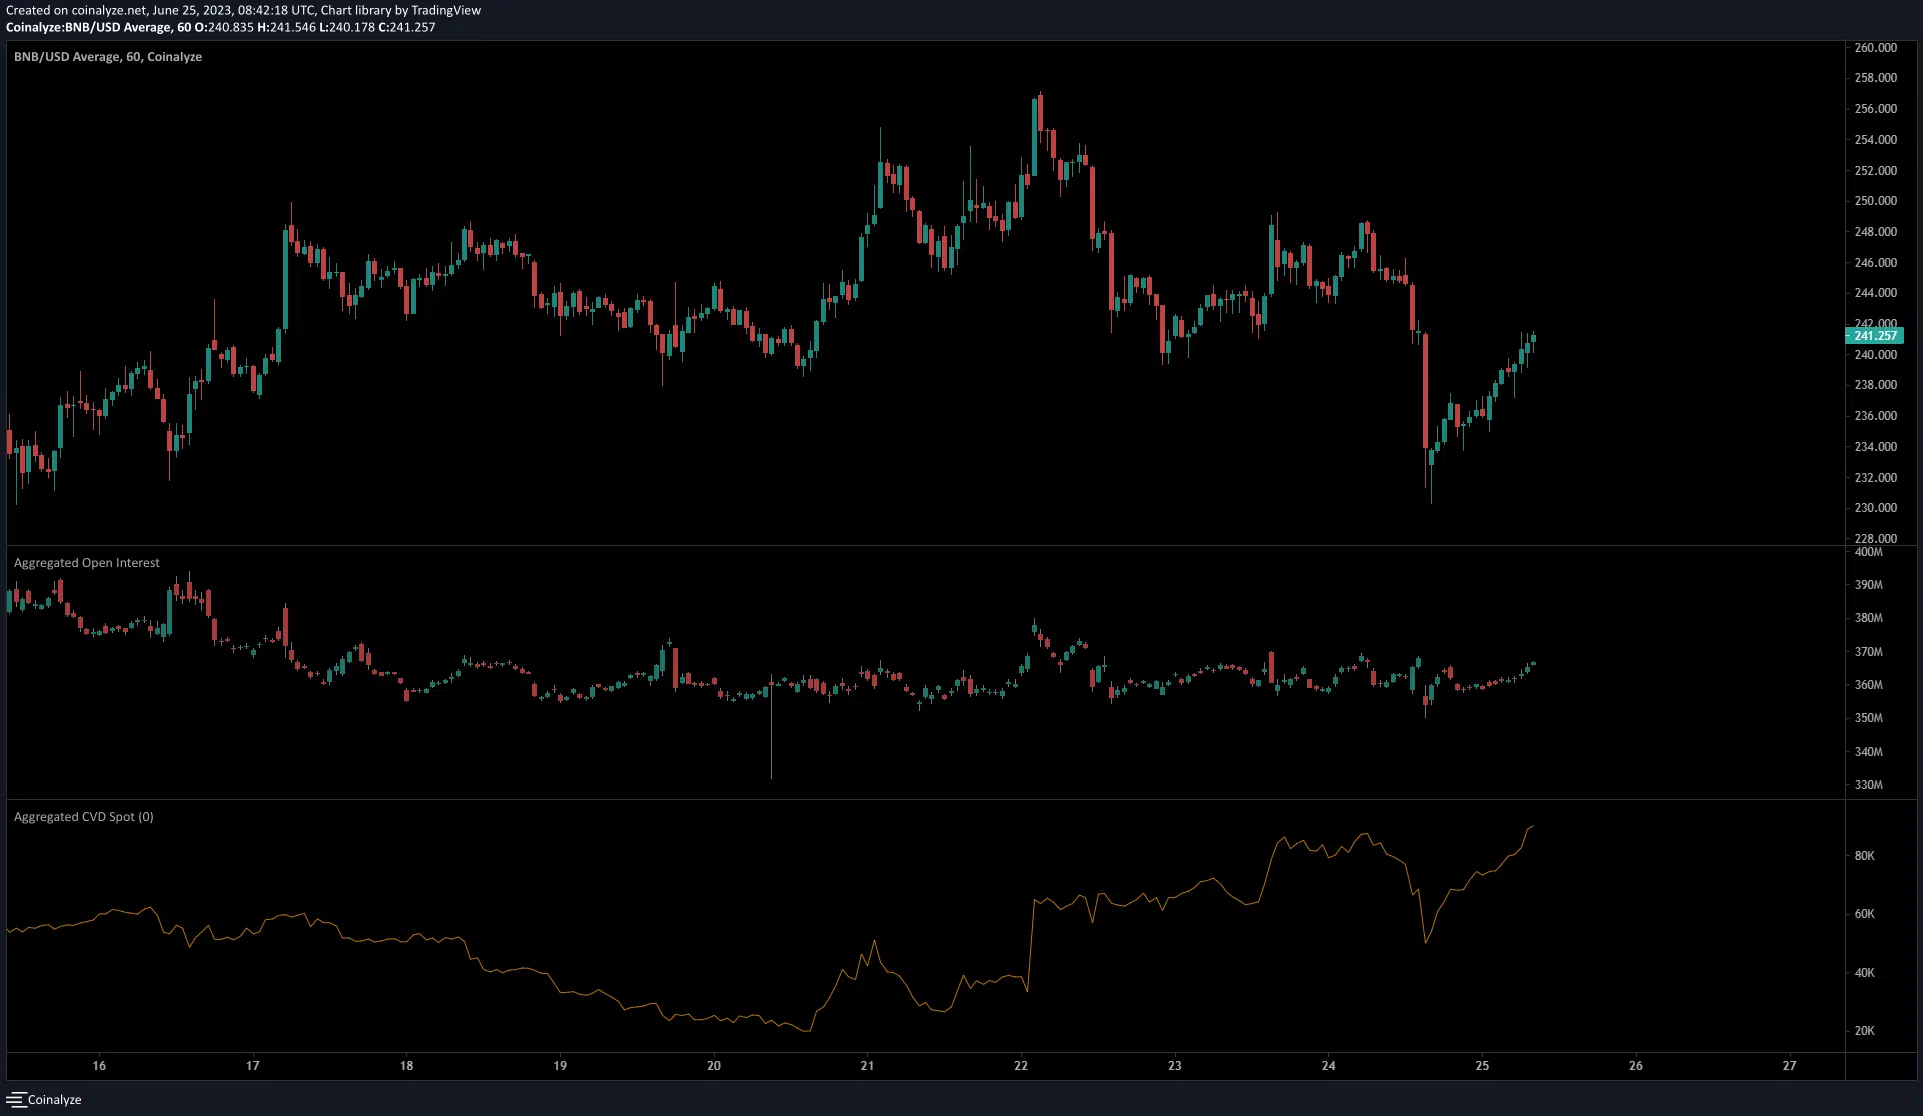
From 22 June till the time of writing, Binance Coin has trended downward from $252. The Open Interest has also trended lower, which showed discouraged longs and bearish sentiment in the market.
Yet the 1-hour spot CVD metric saw a strong uptrend. This meant buying pressure was present behind the exchange token, and that the press time dip was only temporary. To shift the short-term market structure, Binance Coin prices must climb back above $249.8.

