Binance Coin, Polkadot, Ethereum Classic Price Analysis: 23 January

While the past 48 hours have been rather detrimental to the market sentiment, Binance Coin flipped the $414-mark from support to resistance.
Polkadot and Ethereum Classic plunged toward their multi-month low levels and lost crucial support points. All these cryptos still struggled to ramp up their volumes at increasing prices.
Binance Coin (BNB)
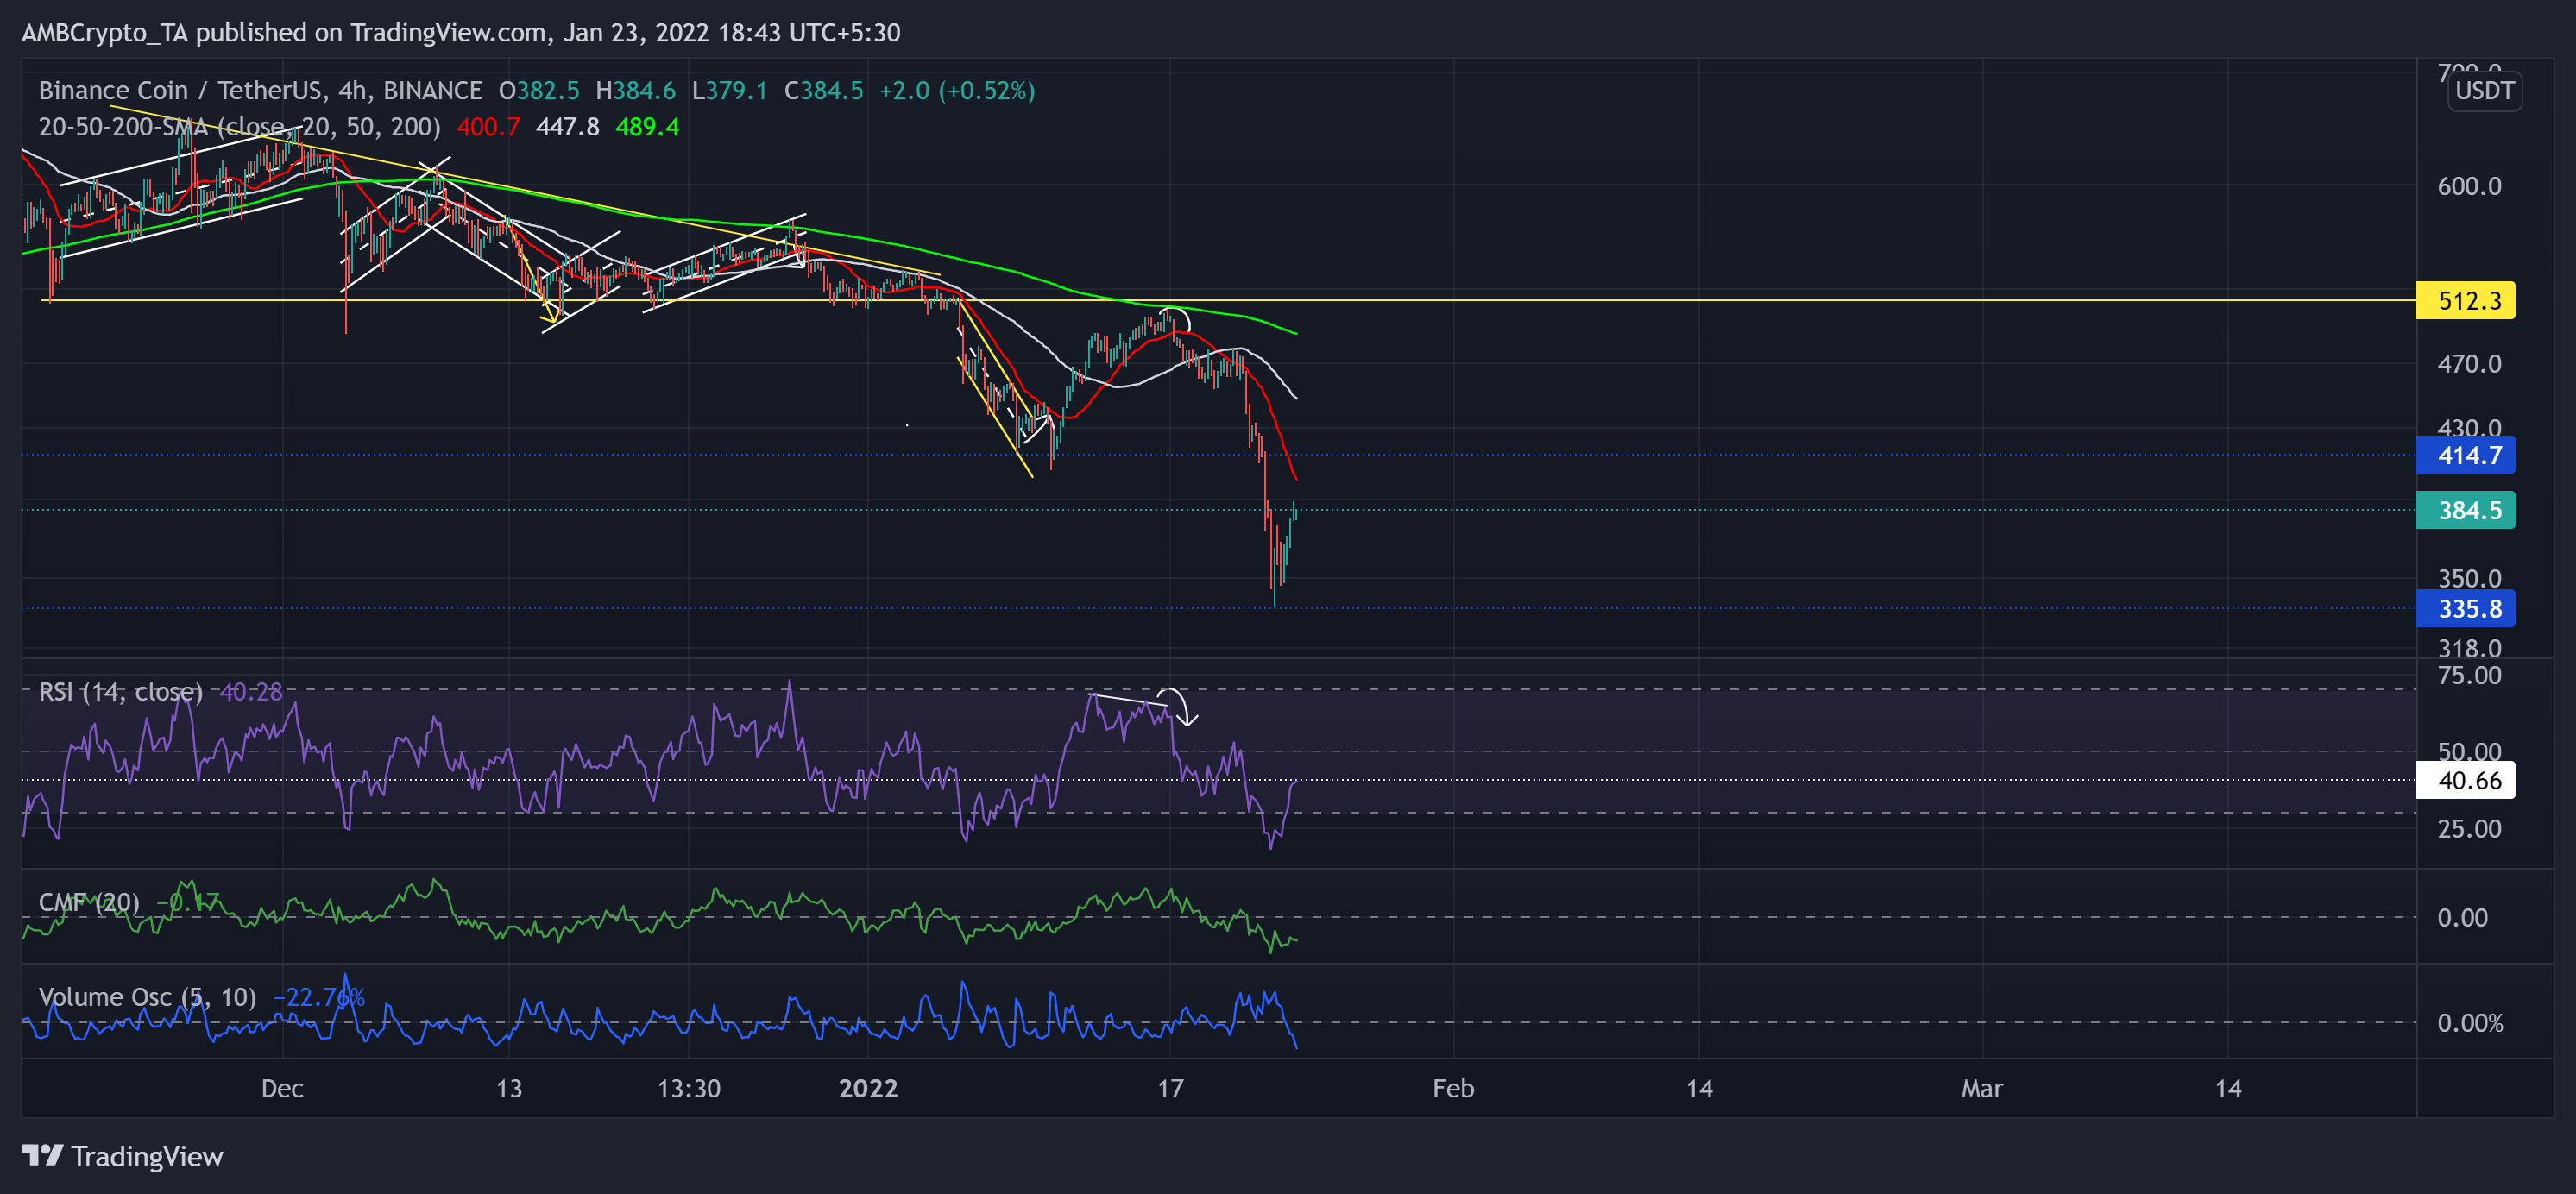
The alt has been on a slump since it broke down from the descending triangle (yellow). After two substantial sell-offs, BNB lost 34.78% of its value (from 5 January) and touched its 16-week low on 22 January.
During this phase, it plunged below its 4-hour 20-50-200 SMA. As a result, the bears managed to flip the three-month support at the $414-mark to resistance. Now, it becomes crucial for the bulls to find a close above the 20 SMA (red).
At press time, the alt was trading at $384.5. After dipping towards the record low of 18.28, the RSI saw a reversal but continued to face resistance at the 40-mark. Further, the CMF fell below the zero line, hinting at decreased money flow volumes. Besides, the Volume Oscillator was on a downtrend during the recent green candlesticks, depicting a weak bull move.
Polkadot (DOT)
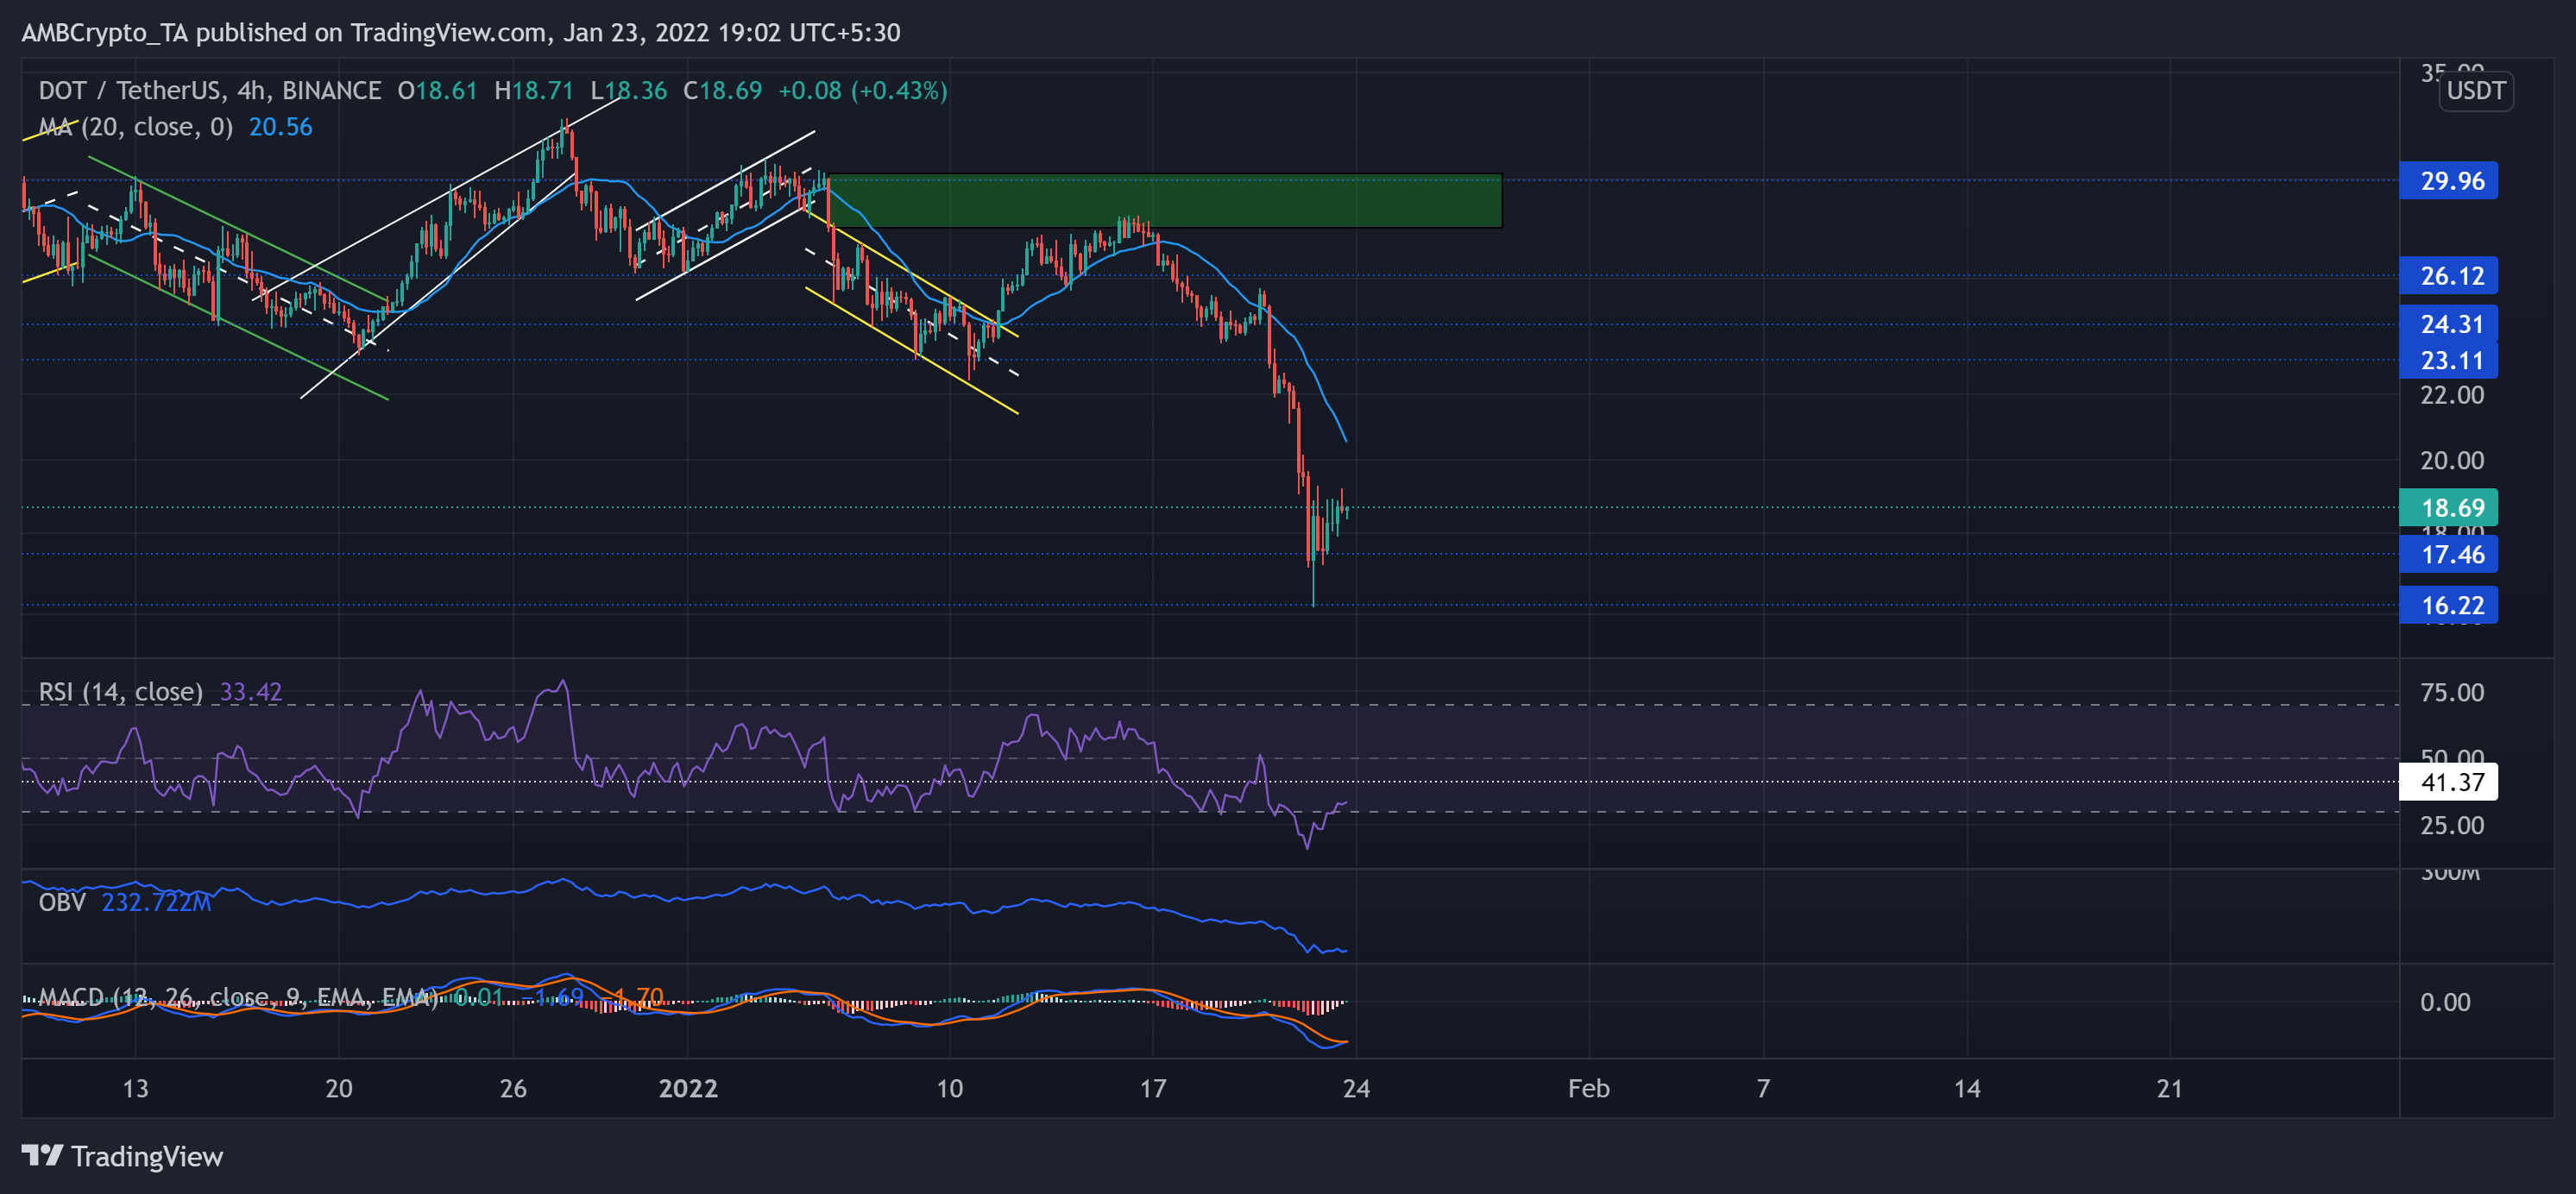
While the sellers did not fail to step in at the $29.96-mark, the 5 January sell-off formed a strong supply zone (rectangle, green) for DOT. Then, after a brief down-channel, the alt saw a likely upturn as the price tested the $23.11-mark five-month support (now resistance).
However, the 21 January fallout triggered a 36.7% decline, while the alt rushed to touch its five month-low on 22 January. Now, the immediate resistance stood at the 20 SMA (cyan).
At press time, DOT traded at $18.69. The RSI stood at the 33-mark. After testing the oversold region in the last two days, it revived but still needs to sustain itself above the 41-mark. Further, the OBV was on a persistent decline and confirmed the bearish vigor. Also, the MACD confirmed the previous analysis, but its histogram and lines pointed at decreasing selling pressure.
Ethereum Classic (ETC)
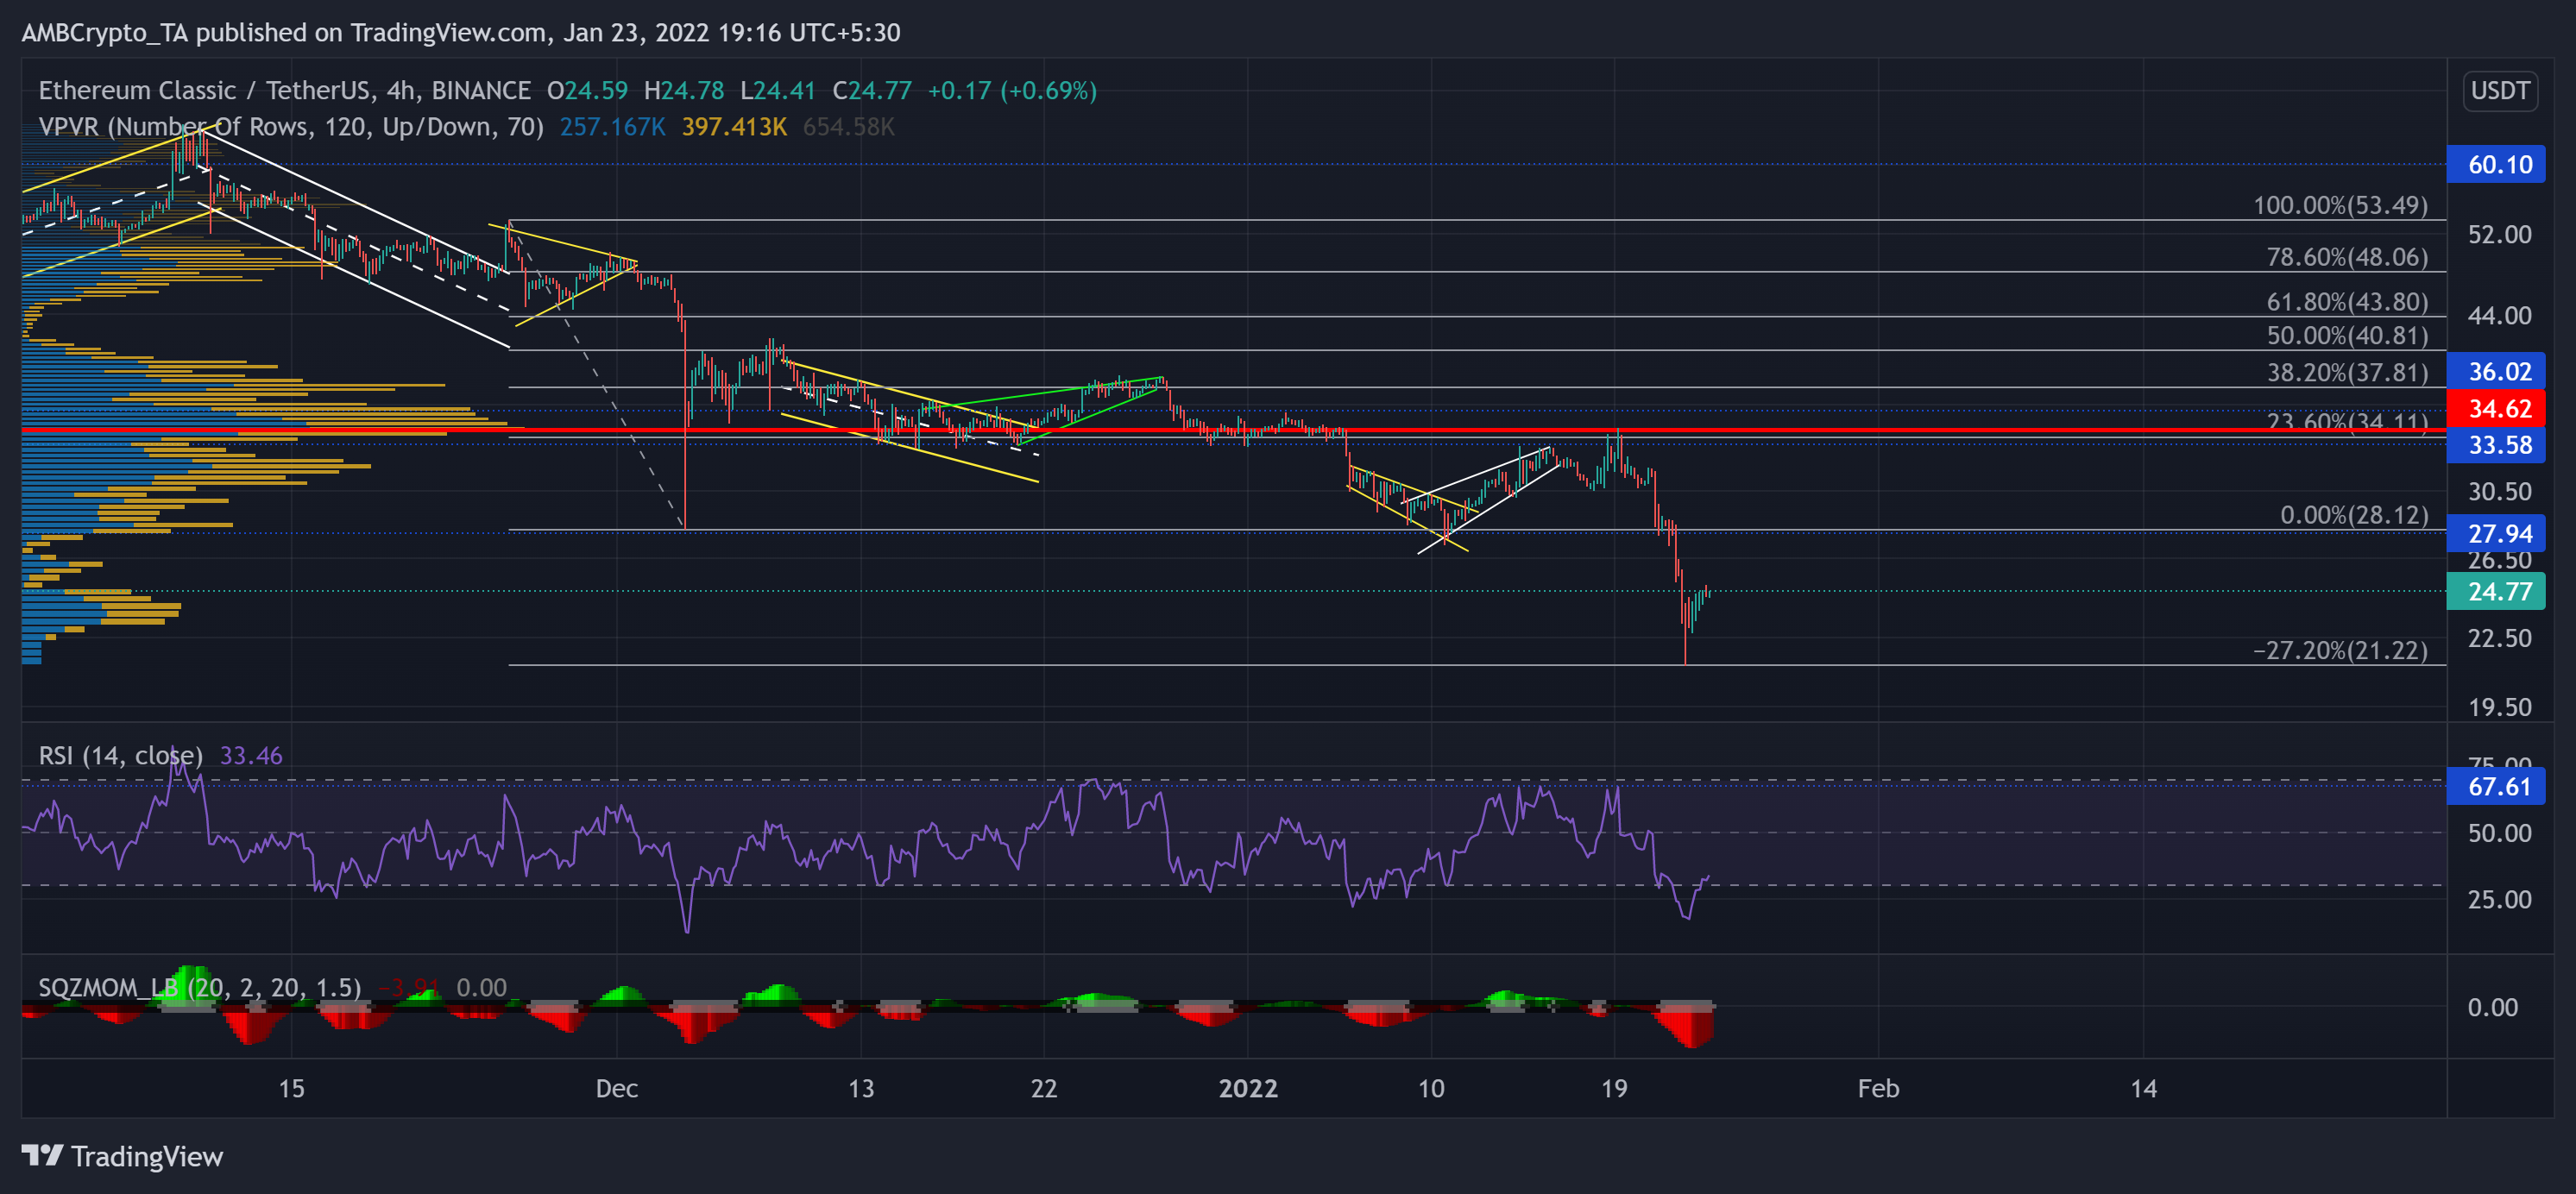
After briefly oscillating between the $36 and $33-range, ETC fell below its Point of Control (red) near the 23.6% Fibonacci resistance on 5 January. Since then, all the bullish revival attempts halted at the aforestated mark.
ETC lost 39.98% of its value (from 19 January high) and poked its nine-month low on 22 January. From here on, it is a rigorous task for the bulls to find a sustained close above the $28.12-mark.
At press time, ETC traded at $24.77. The RSI barely rose above the oversold territory. This reading depicted a sturdy selling influence. On the other hand, the Squeeze Momentum Indicator flashed grey dots, hinting at a high volatility phase.


