
With the bearish market beating down on every coin, total market capitalization fell by 11.5%. On the back of Bitcoin’s movement, most altcoins including Binance Coin, Polkadot, Uniswap made a quick recovery earlier on 22 June, before sliding back to trade in red, at press time. Active bearish momentum could discourage northbound price movement for a while.
Binance Coin [BNB]
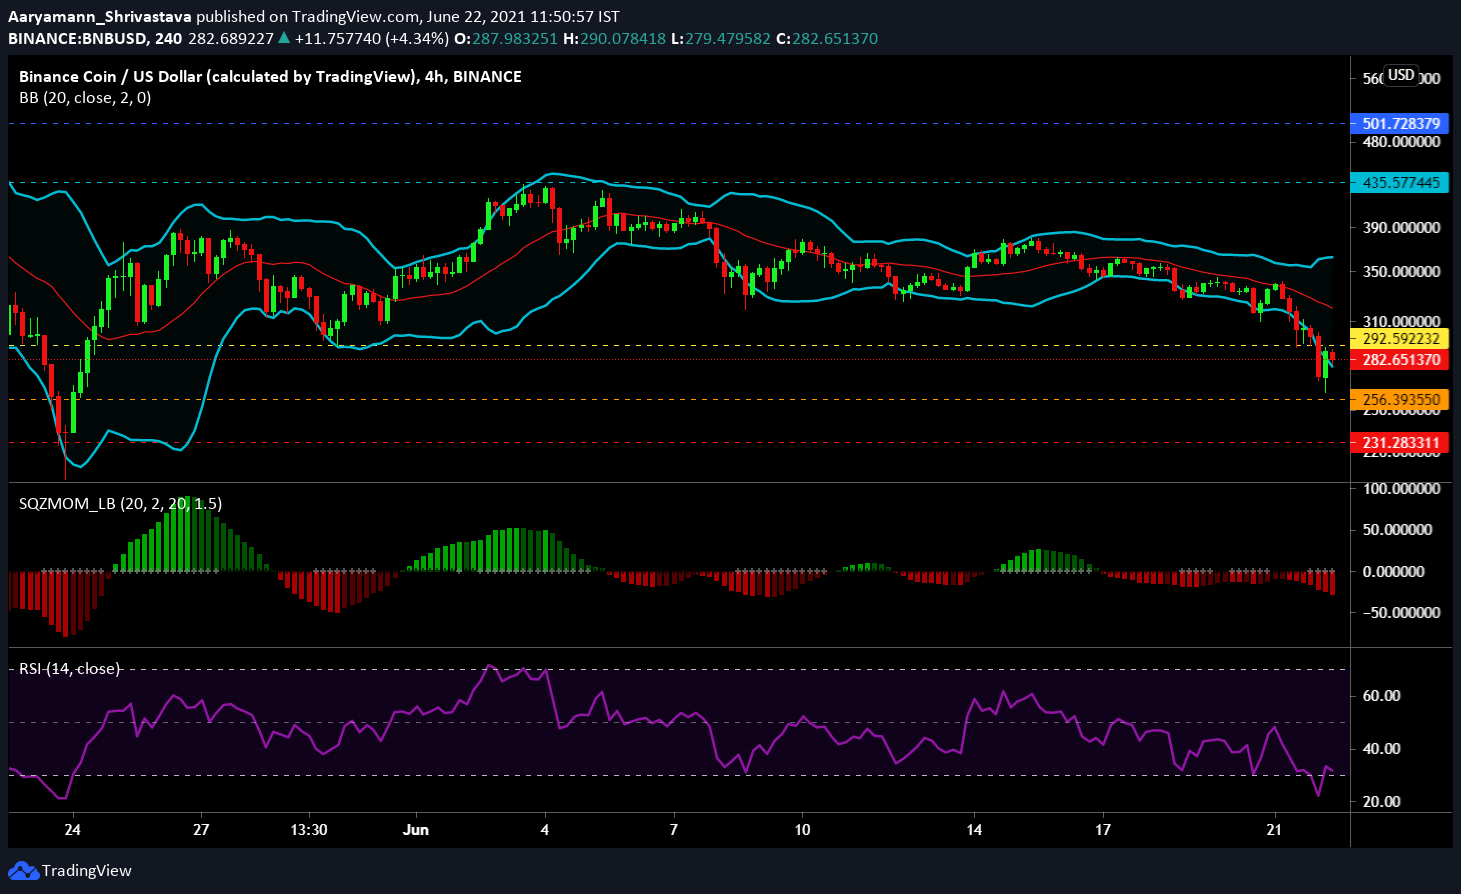
Source: BNB/USD – TradingView
Bearish pressure finally pushed Binance Coin below the $292-support level that the coin had been holding for more than 3 weeks. While BNB did note a 6% correction in early morning trades, at press time, the coin remained at $282. The Squeeze Momentum Indicator pictured rising bearish pressure as the indicator displayed a “squeeze release” (white dots).
The Relative Strength Index (RSI) fell into the oversold zone on 22 June to 21.4, the lowest it has fallen in the last 1 month. The indicator corrected, however, to 30.0 before falling again, at the time of writing. The Bollinger Bands registered divergence as the candlesticks weighed down on the lower band. With the basis acting as resistance, expect high volatility going forward.
New support was established at $256 but the market needs stronger cues from the market to stay above it.
Polkadot [DOT]
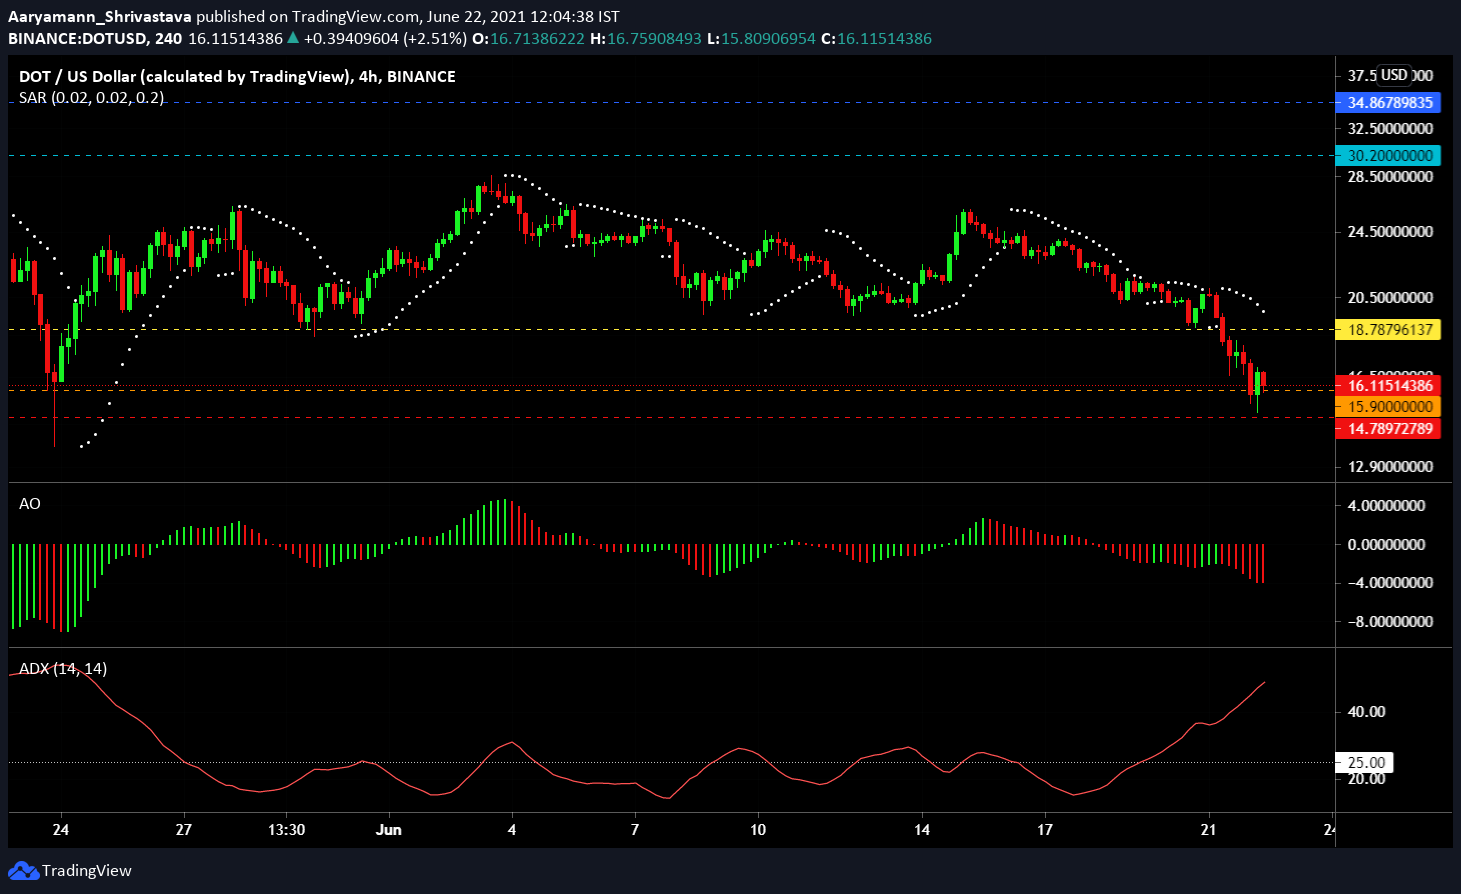
Source: DOT/USD – TradingView
Polkadot dropped to its 4-month low as the coin dipped slightly below the support level at $15.9. Since the coin already broke its previous support, going forward the active support does not seem to be strong either. Thus, the critical support has been established at $14.7. The Parabolic SAR pictured an active downtrend as the white dotted line remained above the candlesticks.
The Awesome Oscillator dictated dominant bearish momentum as the red bars continued to span across the indicator. The Average Directional Index (ADX) continued to rise with a reading of 48.86 at press time. The indicator’s highly directional movement pointed to an intensifying active trend. To minimize losses, the red line indicator needs to fall back below the neutral 25.0-mark.
If the market continues to display bearish cues, DOT could break the active and critical support levels.
Uniswap [UNI]
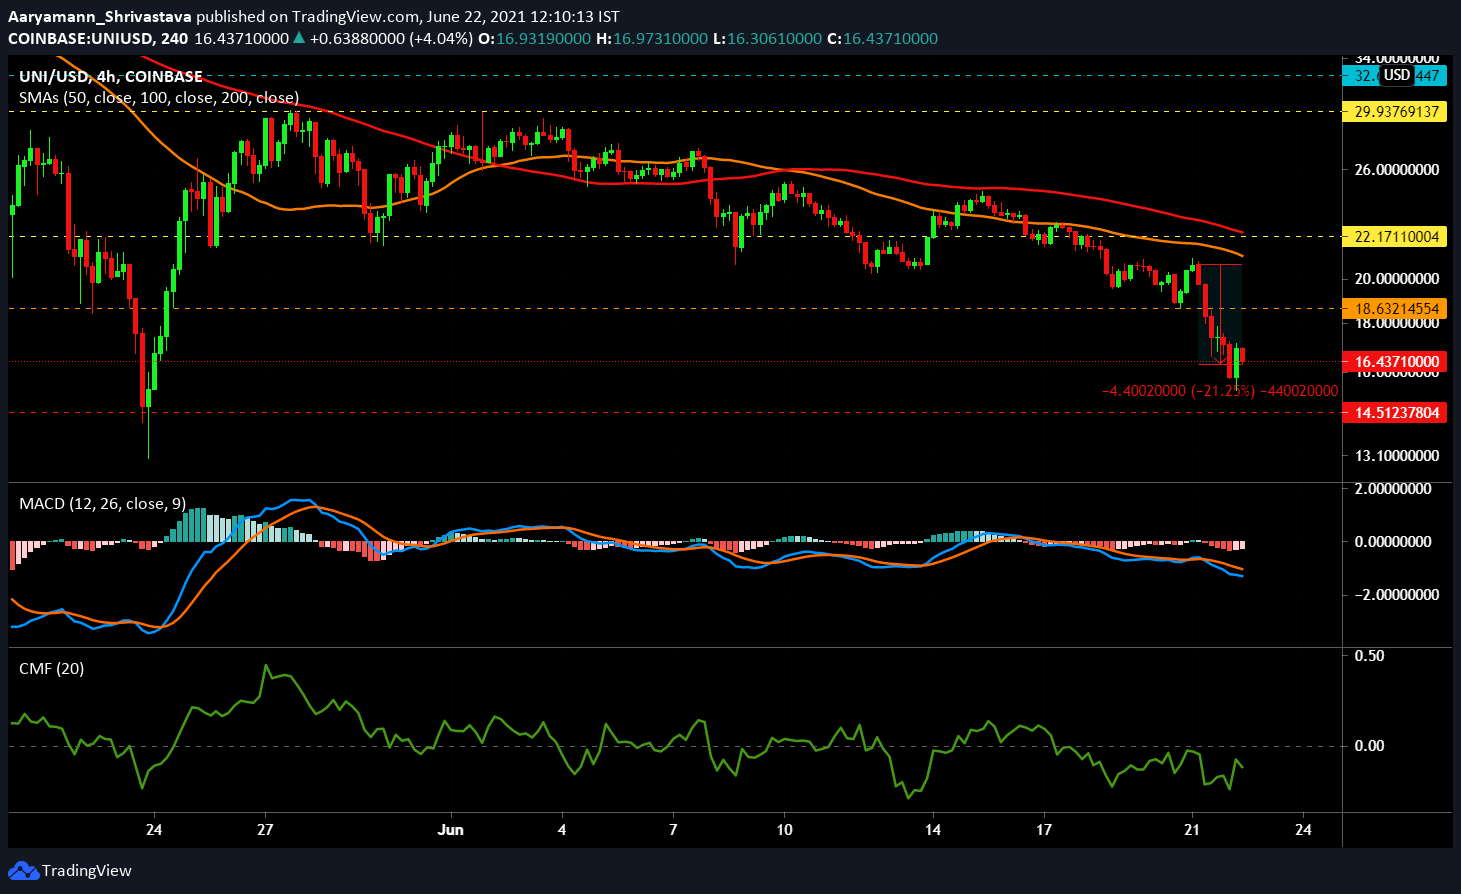
Source: UNI/USD – TradingView
In the last 24 hours, Uniswap fell by 21.25% from $20.7 to trade at $16.43, at press time. UNI already flipped its $22-level from support to resistance twice and in the last 36 hours, the coin overturned $18 into a resistance level. This led to $14.5 becoming a critical support level for the coin. A bearish crossover could be observed on the MACD indicator.
Both the Simple Moving Averages lines – 50 SMA (orange) and 100 SMA (red) – remained strongly bearish, moving far above the candlesticks. Finally, while the Chaikin Money Flow did point to capital inflows earlier in the day, it registered a downtick at press time and remained in bearish territory.
$14.5 is an important support level and a fall below the same could prove detrimental for UNI.