


Disclaimer: The findings of the following analysis are the sole opinions of the writer and should not be taken as investment advice
With the market stabilizing following the sudden bout of volatility, Binance Coin [BNB] too is working towards attaining a stable ground on the price charts. Although the alt has been moving within a wide range lately, a visible downtrend was visible too.
At the time of writing, BNB was valued at $221.74 with a market capitalization of $35.03 billion.
Binance Coin [BNB] 4-hour chart
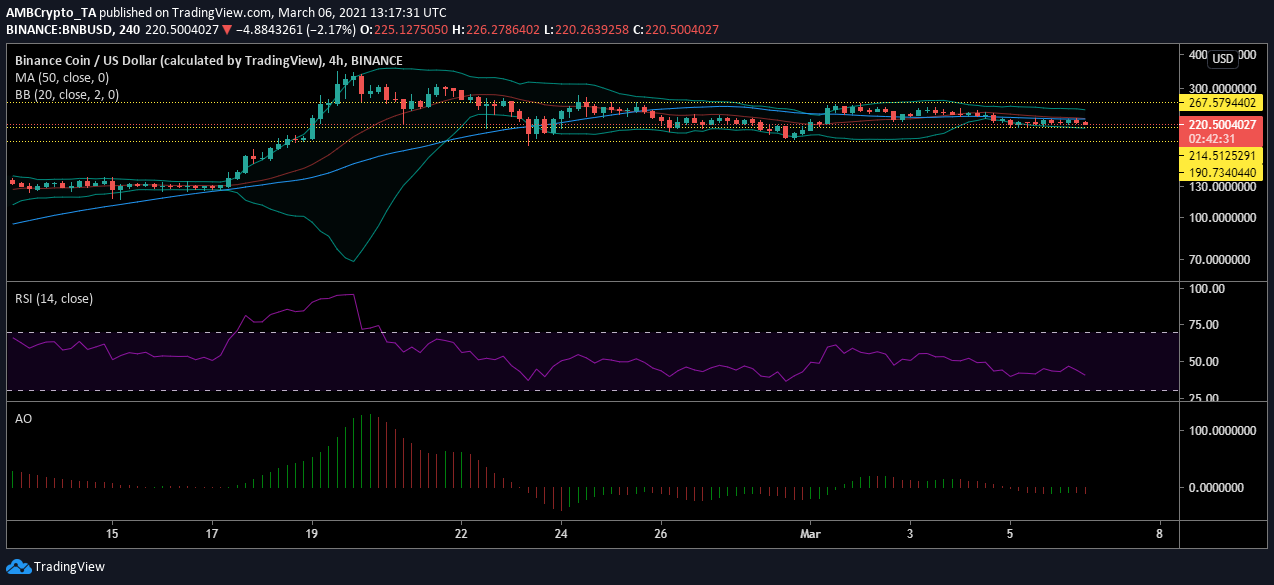
Binance Coin’s 4-hour chart [BNB] showed that the altcoin’s price has been moving between $214 and $267 since the beginning of the month. A surge pushed the value of the digital asset above the $214-price level, after which it tested the resistance once, before retracing.
The digital asset may be moving towards testing the support at $214 once again, but may not drop under this level.
Reasoning
The Awesome Oscillator suggested that the market momentum had shifted towards the negative side. Therefore, a price swing will not be sustainable at this time. Meanwhile, the Bollinger Bands seemed to be indicating a less volatile market than before. The Signal line and the 50 moving average have, however, moved above the price bars, underlining the downward trending price. At press time, they were acting as resistance to the value of BNB.
The Relative Strength Index moved away from equilibrium as sellers entered the market. The selling pressure was pushing the digital asset towards the oversold category, however, a lack of momentum may help it remain close to equilibrium.
Conclusion
Binance Coin’s press time market trend highlighted consolidation with a bearish outlook. The market may continue to test the support at $214 but might retrace since the momentum in the market was low. Meanwhile, the lack of volatility may also prevent a sudden change in the price trend.