Binance Coin Price Analysis: 21 April

Binance Coin has been one of the top performers of 2021 and its recent all-time high of $638 was registered on 12th April. After a minor correction, the past 24 hours have again pictured a bullish spectrum for BNB with a 20%+ resurgence in the charts. With a market cap of $90 billion, Binance Coin is currently the 3rd most valuable digital asset; however, the tides could drastically take a turn going forward.
Binance Coin 1-day chart

BNB/USDT on Trading View
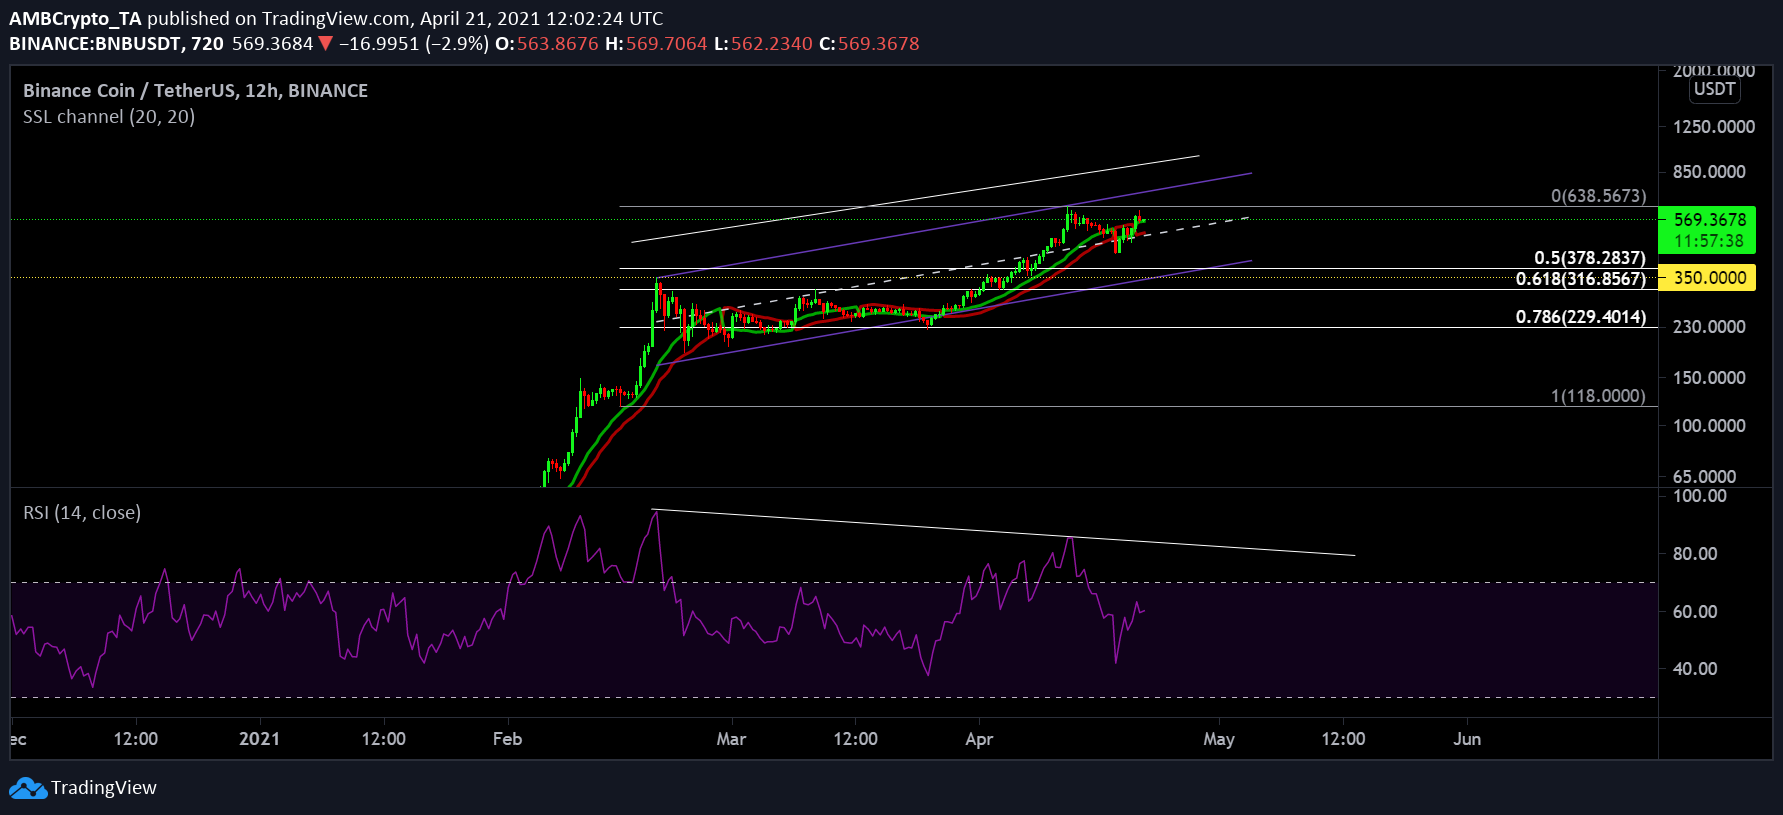
On a technical landscape, BNB has been mediating within an ascending channel over the past couple of months. An initial ATH of $354 was established in February and the asset consolidated at a high range the following month. Right now, the chances of a bearish outbreak are high.
SSL indicator has turned bullish at the moment, which is a positive outlook for BNB at press time, but it may flip within the next few days as well.
Market Rationals

BNB/USDT on Trading View
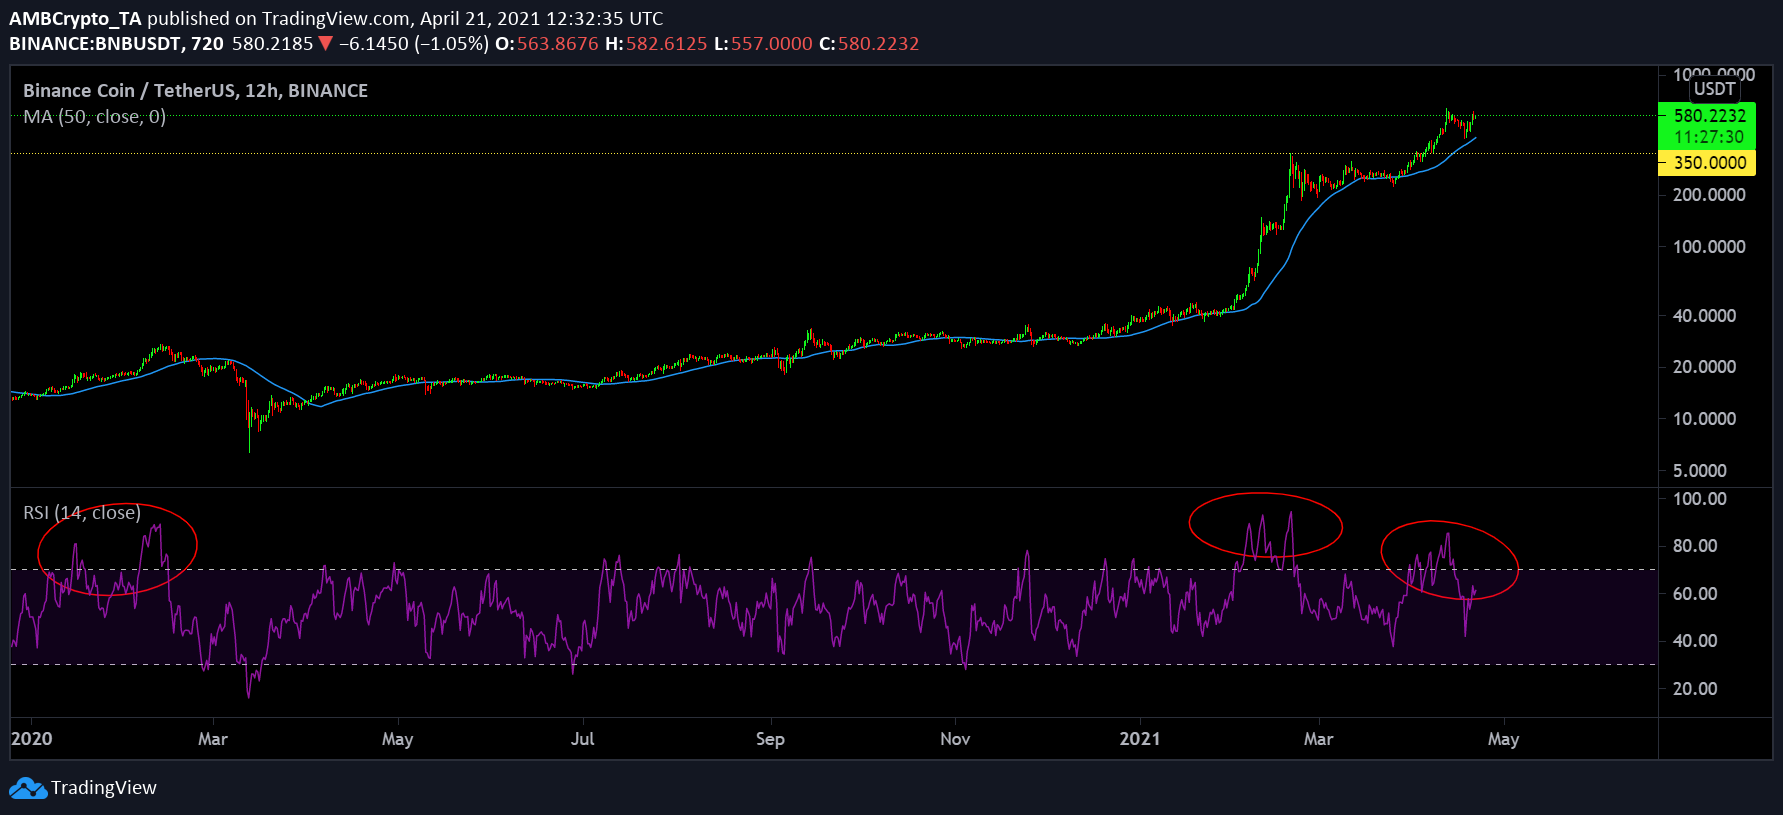
One of the prime signs that the market may have reached an overbought zone in the medium to long term is evident on the RSI chart. For the entire duration of 2020, BNB reached an overbought zone on the daily chart only for a small period of time however, it has re-tested that region twice already in 2021.
Looking at market structure, the asset is overbought by both medium and long-term holders and room for growth should be supposedly low. With respect to fundamentals, it may still differ. There is a significant market sentiment currently associated with a bullish altcoin season, which may inevitably push the price higher.
Conclusion
With the price moving upward, a bullish breakout after a period of correction would be a better turnaround over the long term otherwise a massive crash may loom over Binance Coin following a price rally.


