Binance Coin price hits ATH of $720: What’s next for BNB?
An uptick in BNB sell-offs may push its price back below $700 and cause it to trade at $690.

- BNB rose to an all-time high on 6th June.
- It may trade above $750 if buying pressure is sustained.
Binance Coin [BNB] climbed to an all-time high of $720 during trading session on 6th June before witnessing a minor correction.
Data from CoinMarketCap showed that at press time, the altcoin had exchanged hands at $706, having declined by 2% from its all-time high.
Demand for BNB surges
Prior to 3rd June, BNB had trended within a horizontal channel. This channel is formed when an asset’s price consolidates within a range for an extended period. The upper line of this channel forms resistance, while the lower line forms support.
As for BNB, the bears created resistance at $632, while the bulls defended the coin’s price at $518, which formed long-term support.
Due to the surge in buying activity in the last month, BNB rallied above the upper line of this horizontal channel on 4th June to close at $686.
The bulls have since maintained the uptrend as buying momentum has outweighed selling activity in the BNB market in the past few days.
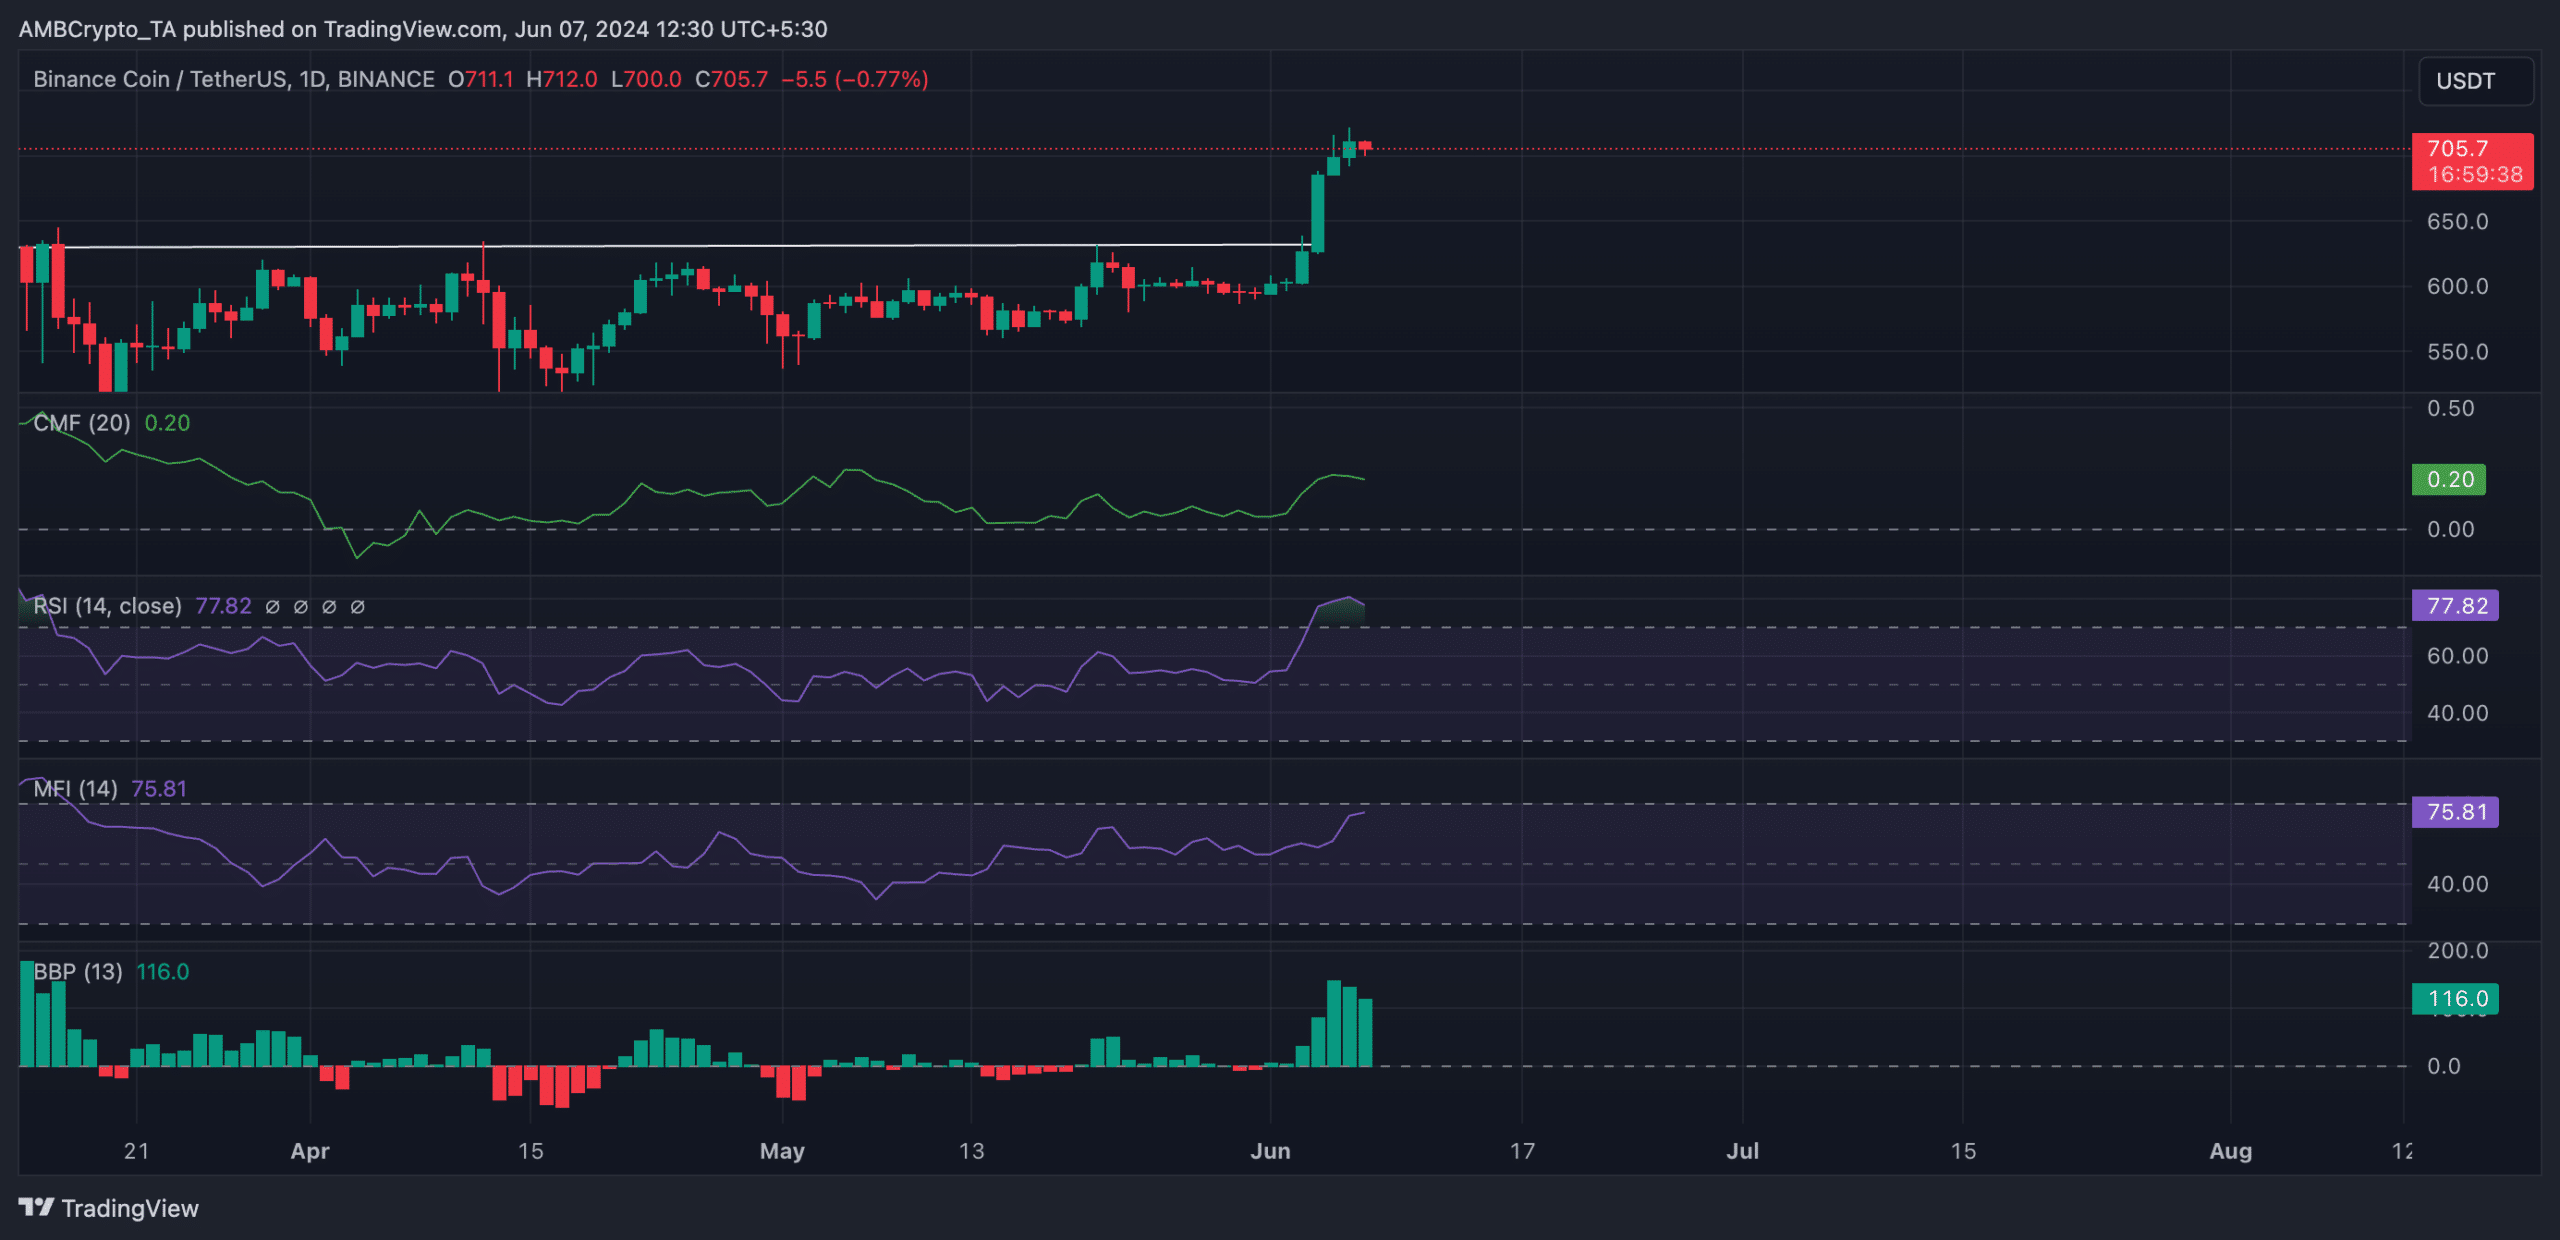
This was gleaned from readings from the coin’s momentum indicators. For example, BNB’s Relative Strength Index (RSI) and Money Flow Index (MFI) were 77.82 and 75.91 at the time of writing.
At these values, these indicators suggested that buying activity outpaced profit-taking activity among BNB traders.
Confirming the surge in the coin’s demand, its Chaikin Money Flow (CMF) rested above the zero line at 0.20.
This indicator measures the momentum of money flow into and out of an asset’s market. A positive CMF value is a sign of market strength. This means that liquidity is being supplied as coin accumulation trumps distribution.
Further, signaling that the bulls dominate the bears, BNB’s Elder-Ray Index was 115.7. Since the coin broke above resistance on 4th June, the indicator has returned only positive values.
This indicator measures the relationship between the strength of buyers and sellers in the market. When its value is positive, bull power is dominant in the market.
Realistic or not, here’s BNB’s market cap in BTC terms
BNB might rally to exchange hands at $754 if buying pressure is sustained.
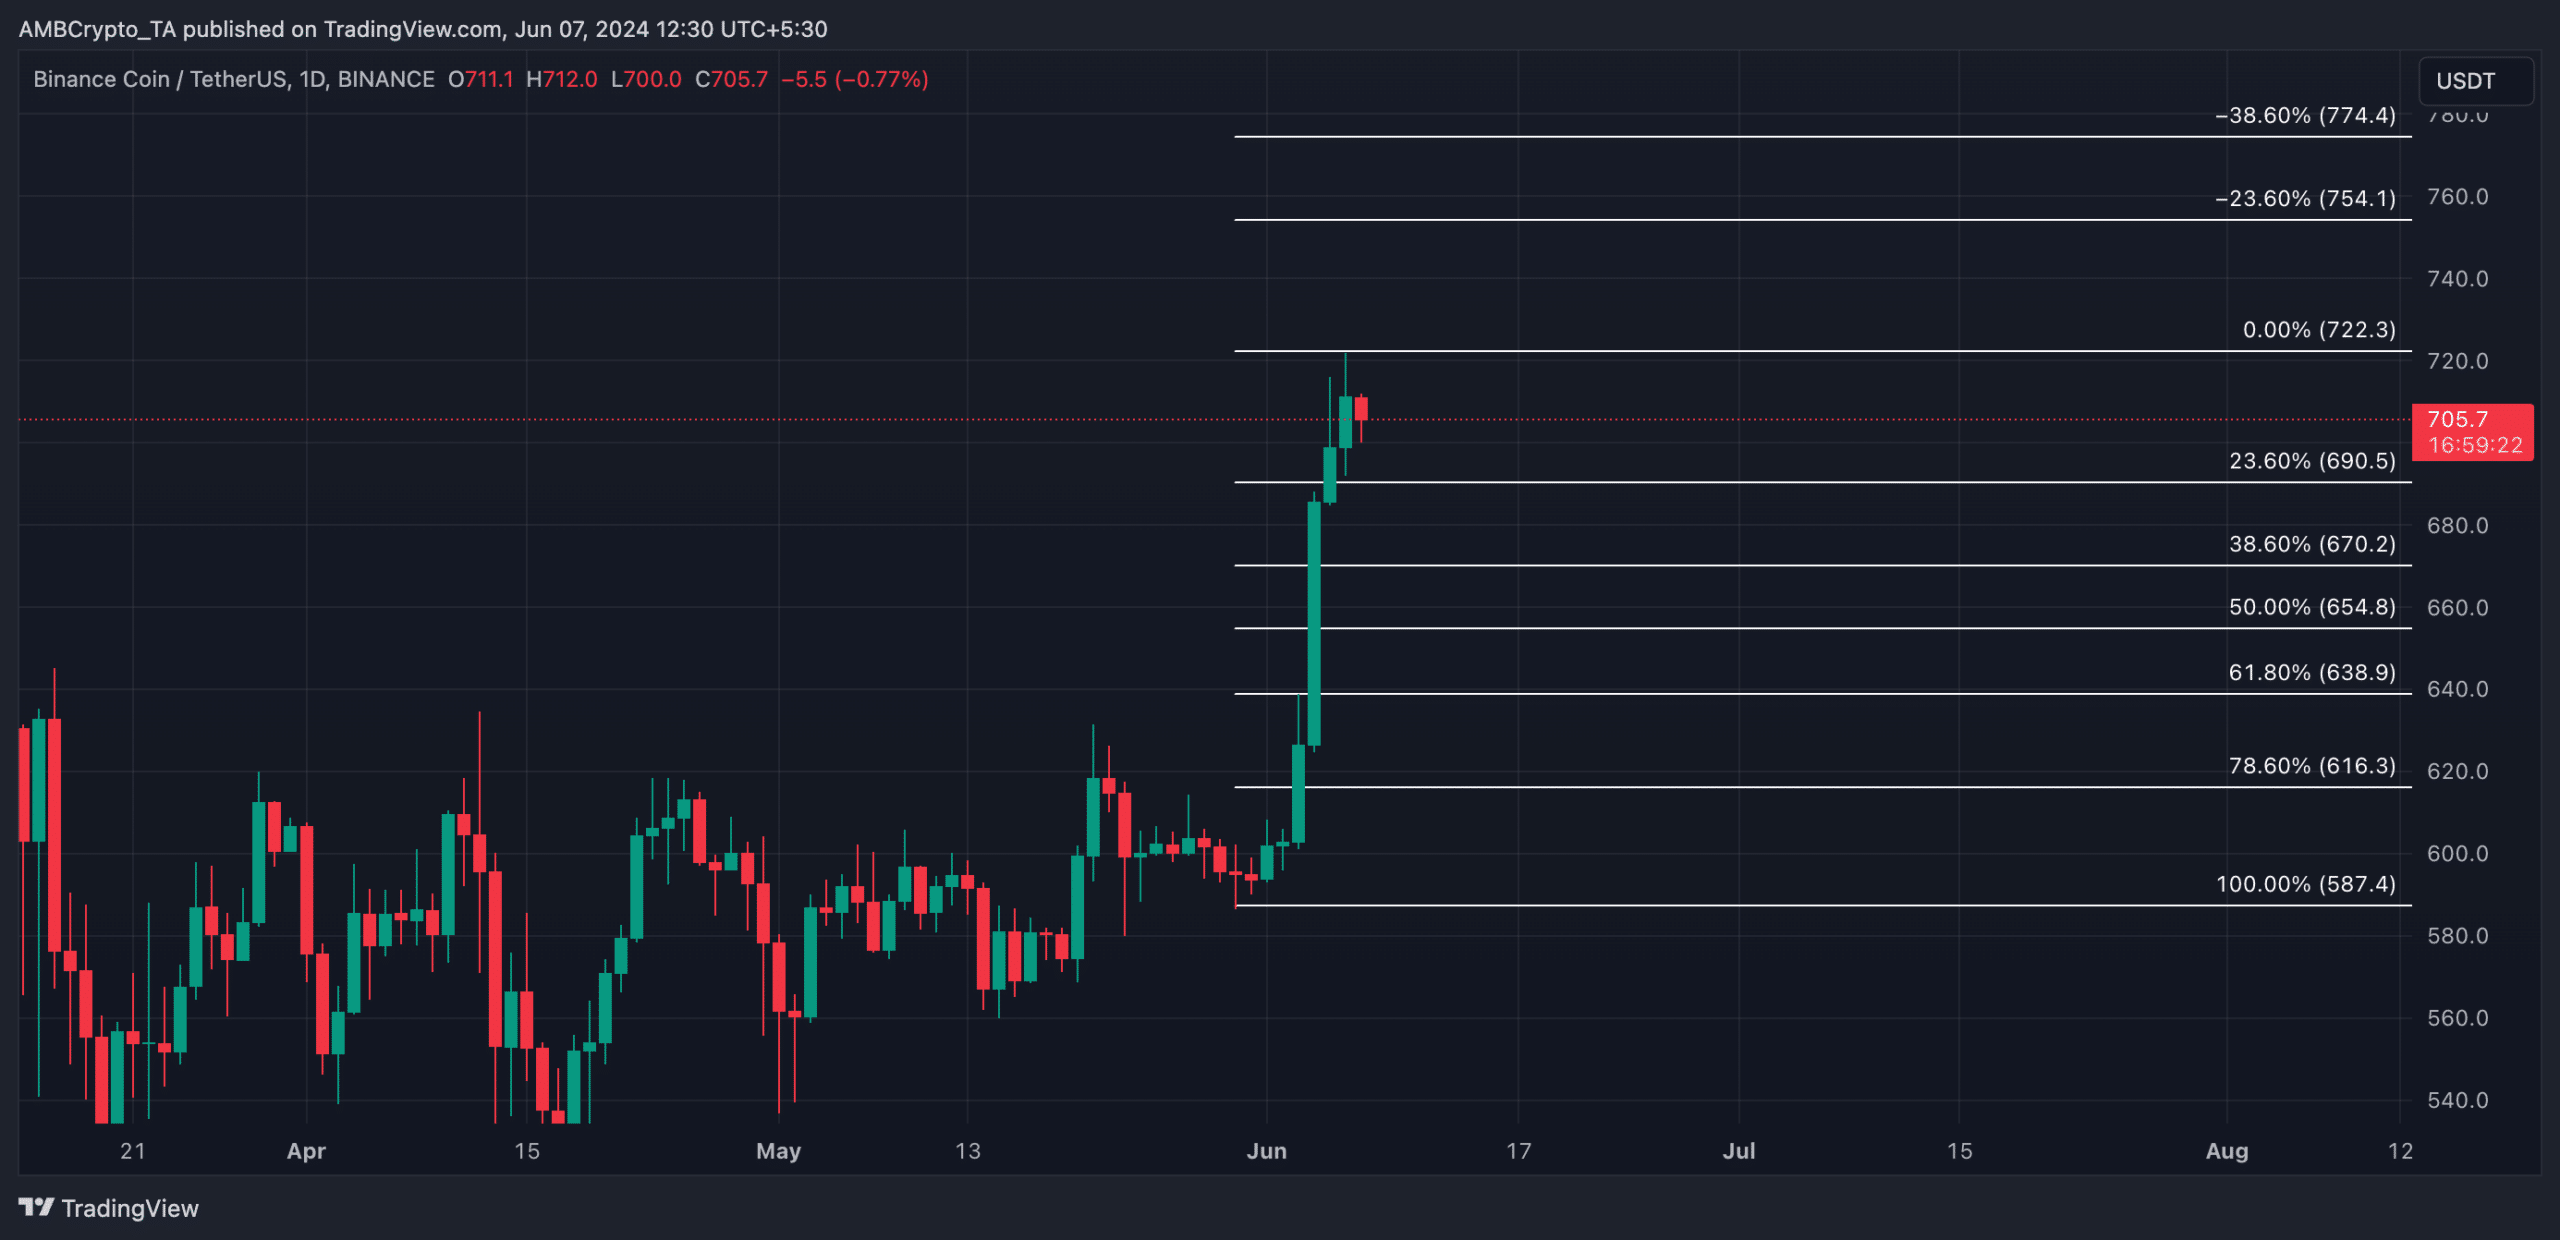
However, if this is invalidated and profit-taking activity surges, BNB’s price might fall under $700 to $690.


