After a substantial slump yesterday, Shiba Inu and Solana noted their one-month low on 26 November. However, the bulls attempted to counter the sell-off.
While the near-term trend remains bearish for most cryptos, the market flashed some revival signs. As a consequence, Binance coin, Shiba Inu, and Solana saw gains on their daily charts.
Binance Coin (BNB)

Source: TradingView, BNB/USDT
The alt consistently marked higher lows and depicted healthy bullish tendencies since 24 September. After an atrocious 78.41% rally in just 39 days (from 24 September), BNB price action touched its six-month high on 7 November.
However, the price action witnessed a 22.8% pullback until it touched its two-week low on 18 November. BNB bulls were quick to reverse the slump and continue their late September uptrend. As a result, the price inclined in an up-channel since the past week. Consequently, the alt noted a 3.3% increase in 24 hours, pushing the price above its 4-hour 20-50-200 SMA.
At press time, BNB traded at $603.8. The RSI was northbound and preferred the bullish vigor. Further, DMI chose the bears but depicted increasing bullish strength. Nevertheless, the ADX (red) displayed a weak directional trend.
Shiba Inu (SHIB)
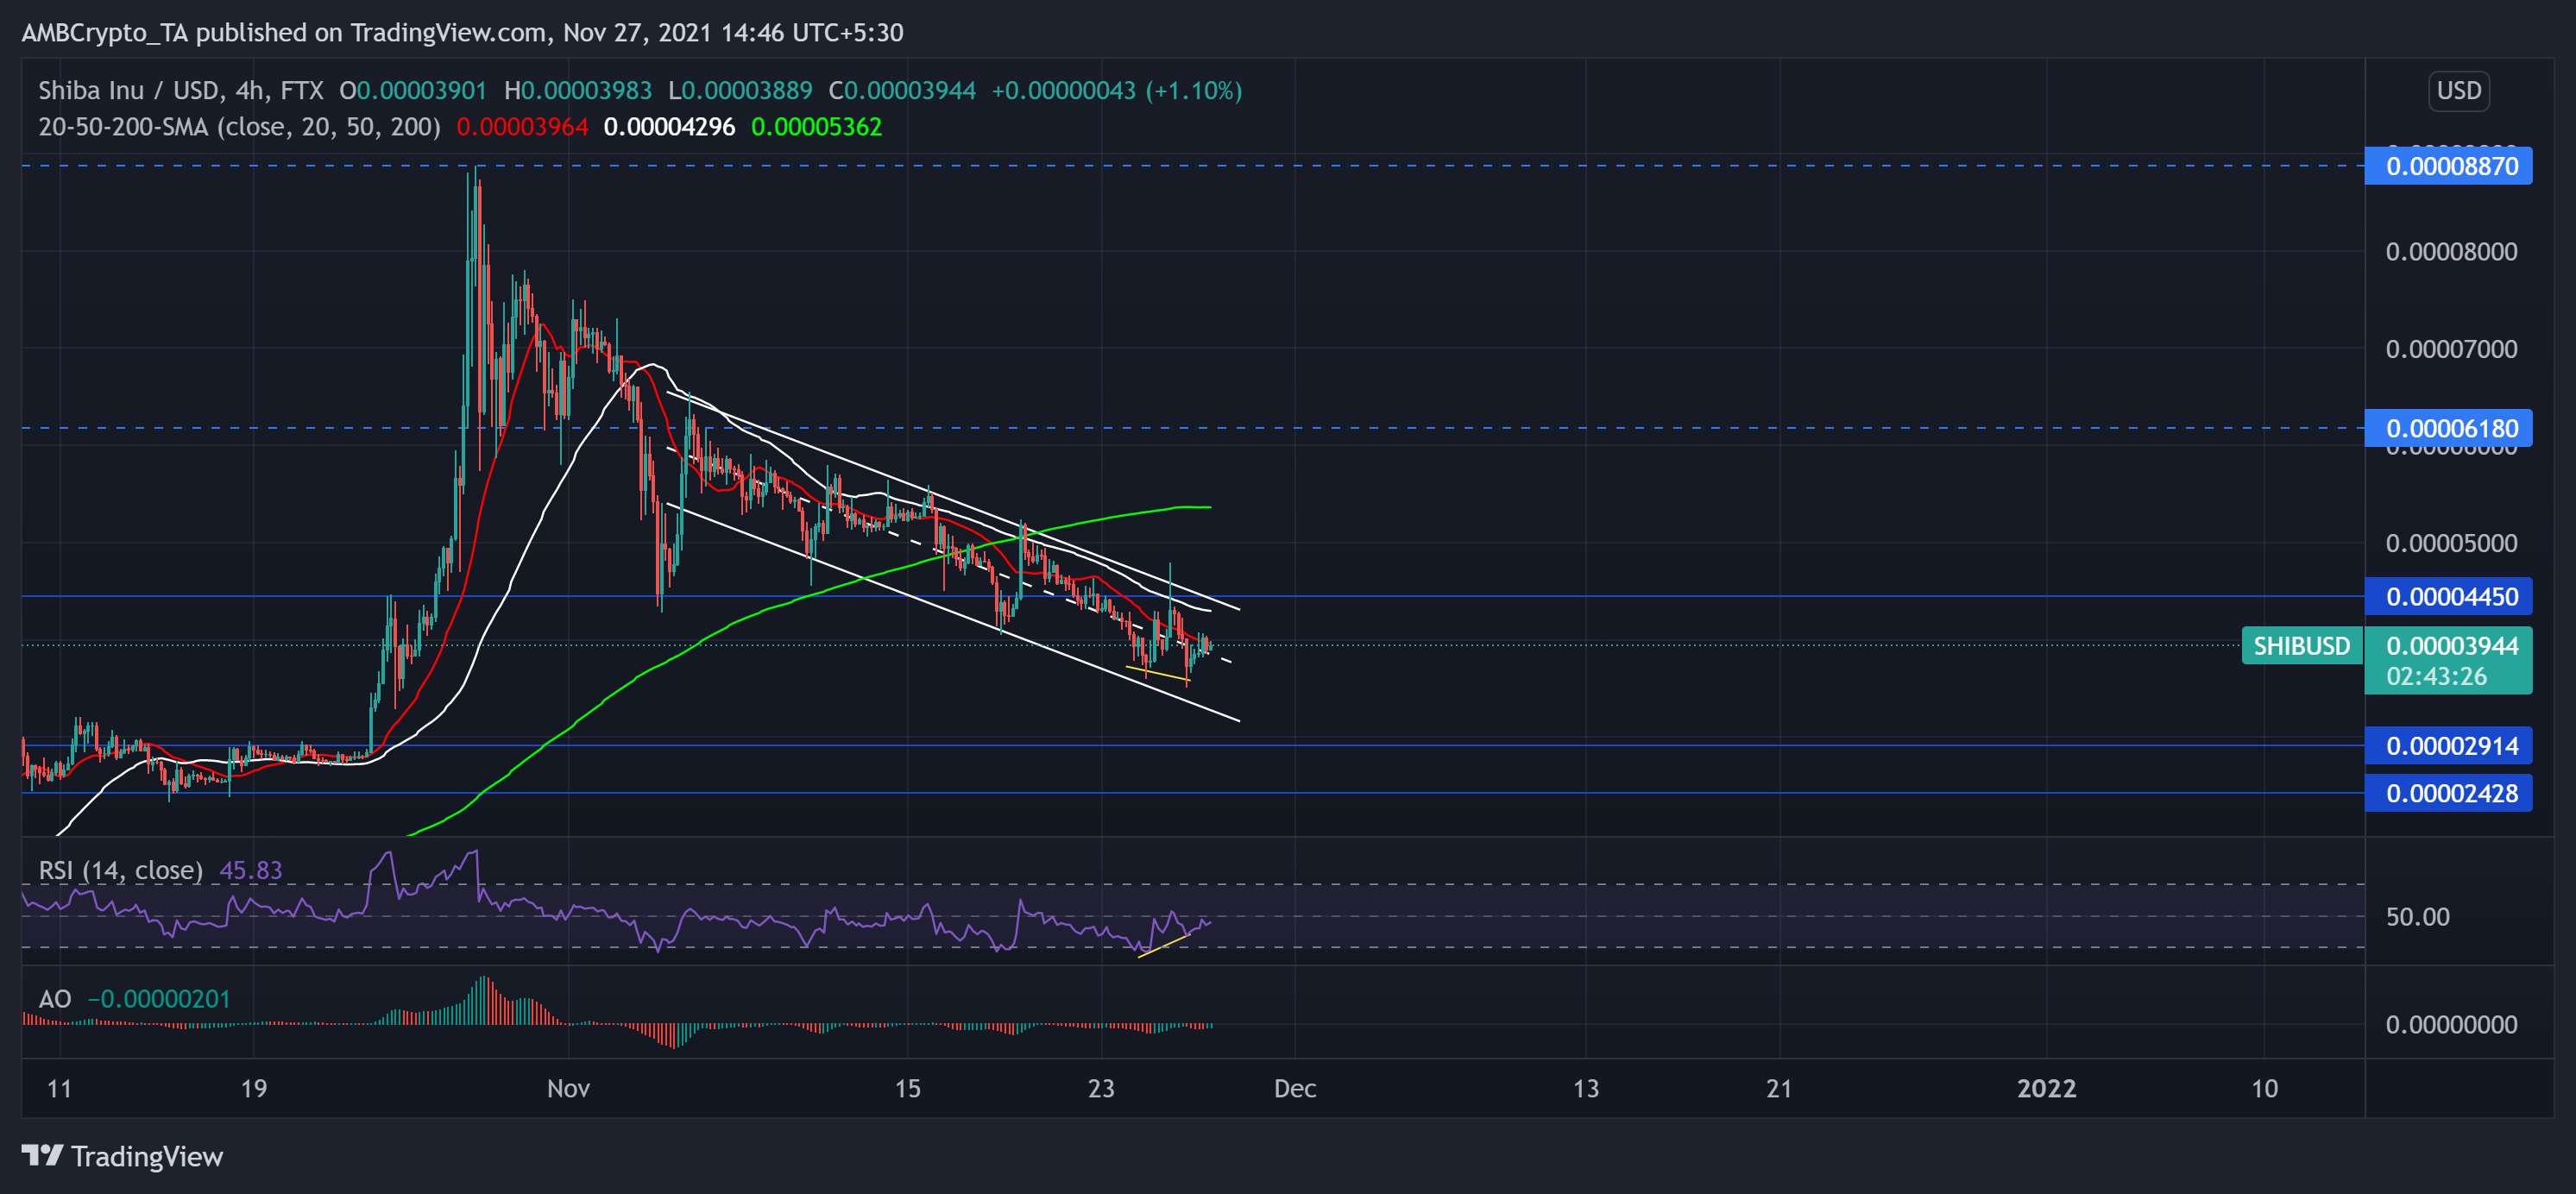
Source: TradingView, SHIB/USD
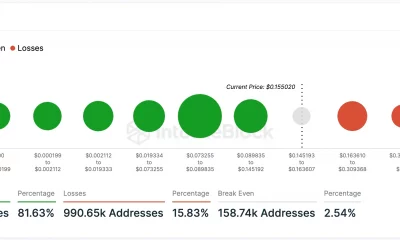
Although SHIB managed to preserve over a million holders, the bulls have visibly failed to uphold the token’s perception as its price steadily dropped throughout November. The price action marked a down channel since 6 November. The meme coin has lost more than half of its value since it struck its ATH on 28 October.
Possibly with increased profit-taking, bulls failed to hold their ground as the coin saw a 51.8% and 19% monthly and weekly decline, respectively. Consequently, it touched its one-month low on 26 November.
At press time, SHIB traded at $0.00003944. The RSI seemed to head north after preferring the bears. Also, SHIB saw a 4% gain on its daily charts. This incline occurred after a bullish divergence (yellow) between the RSI and the price action over the past day. Further, the AO chose the bears but also hinted at their decreasing strength.
Solana (SOL)
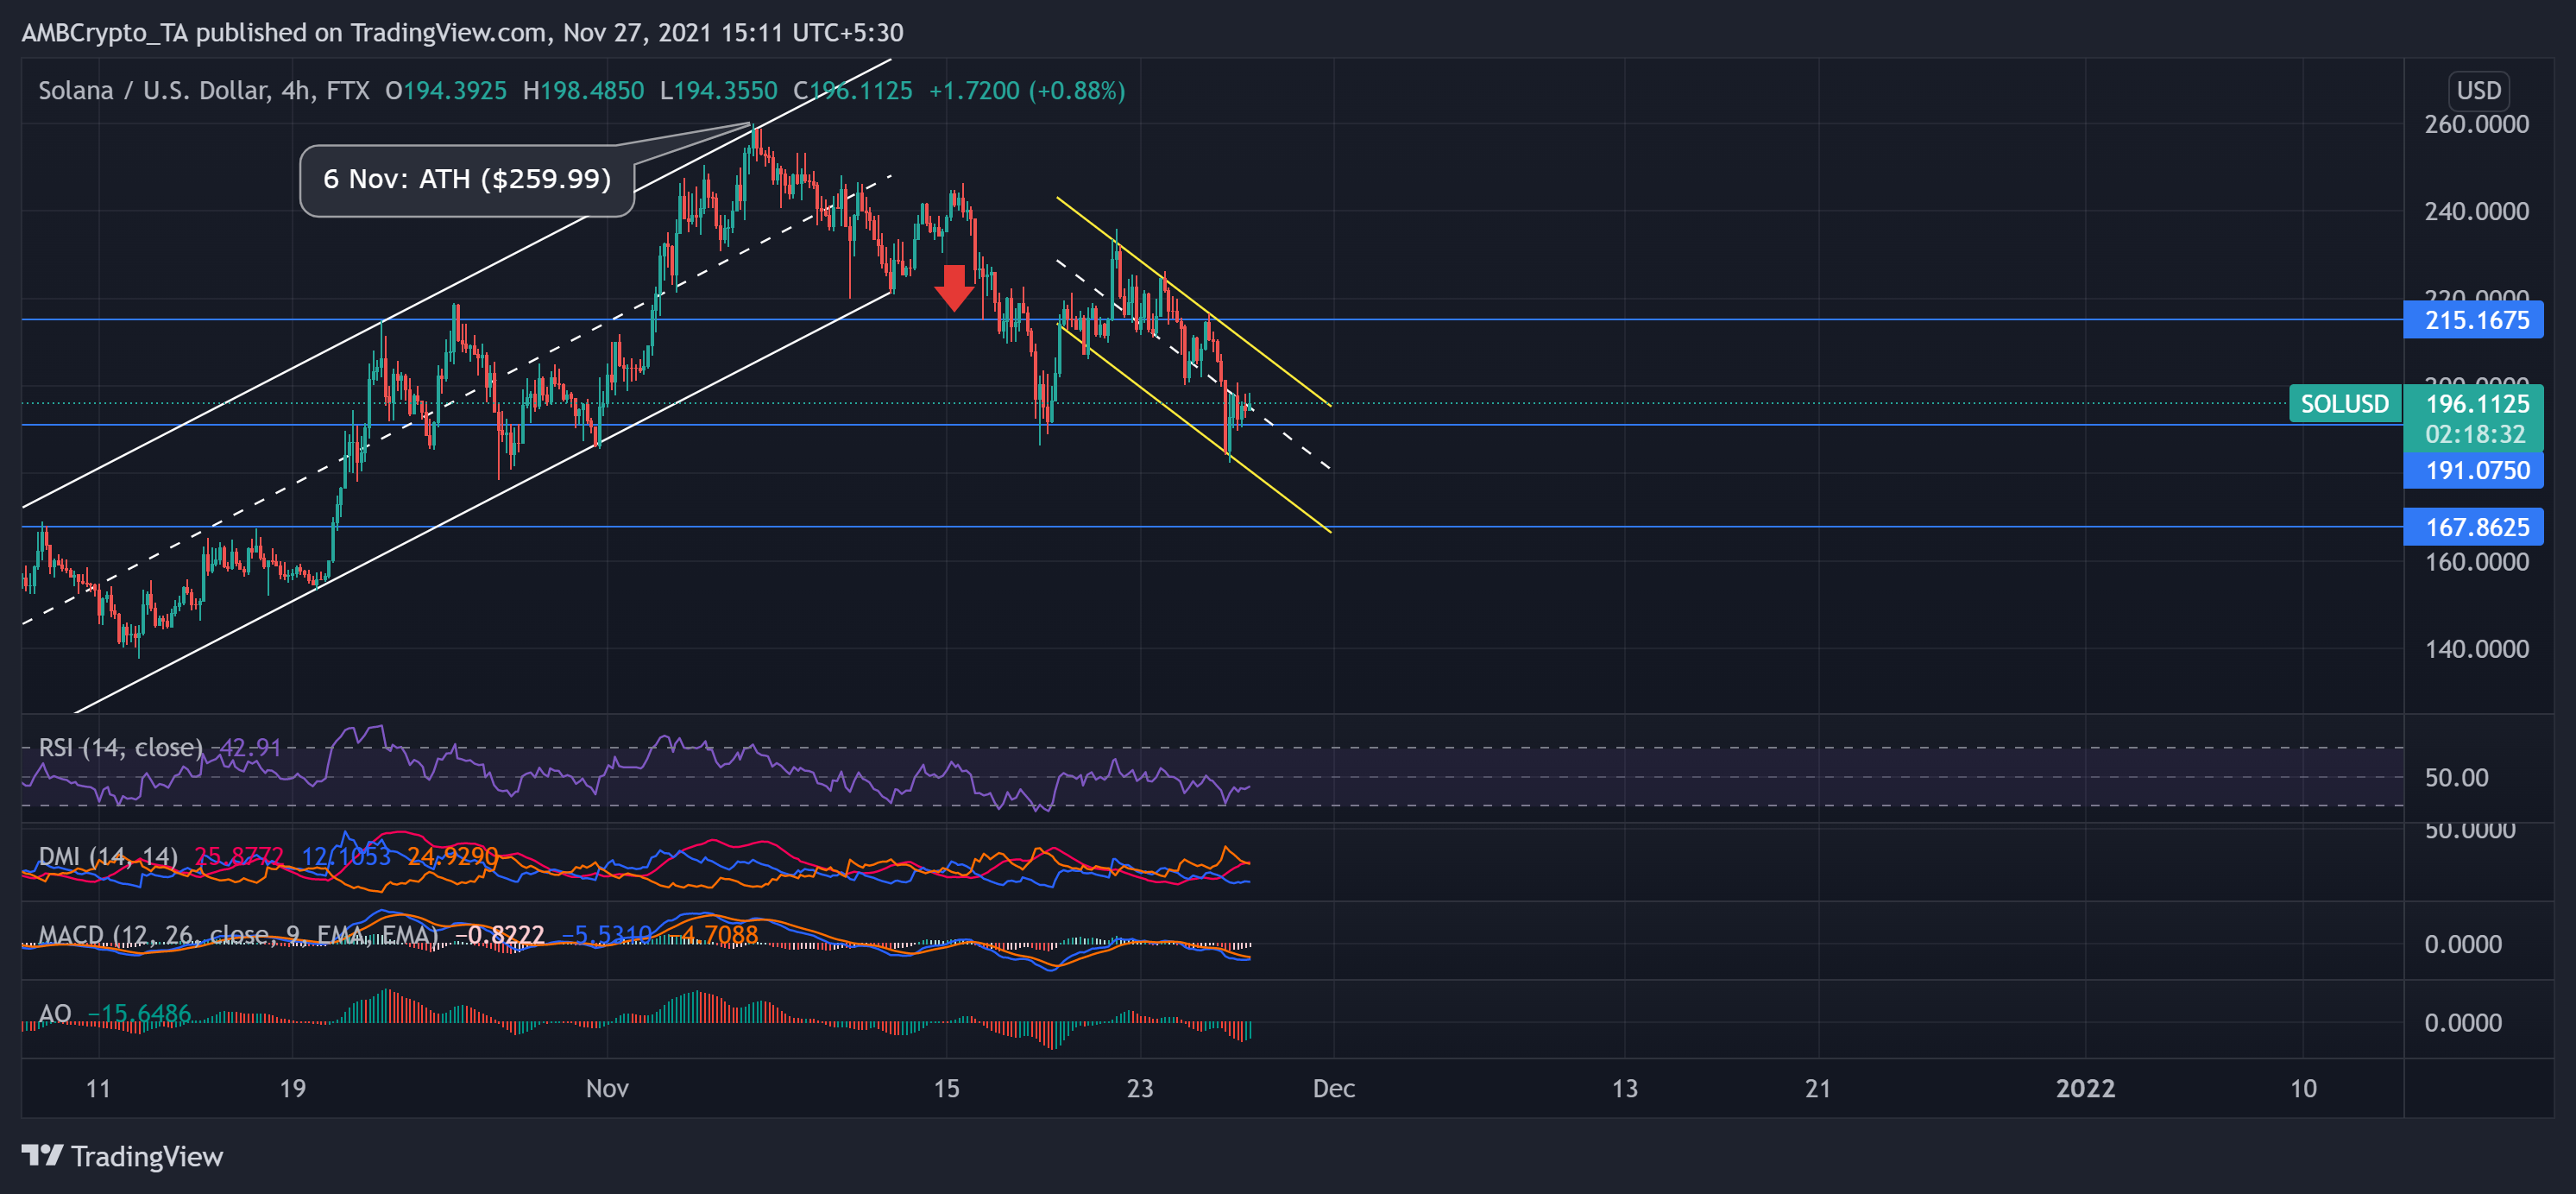
Source: TradingView, SOL/USD
SOL rallied by over 85% from 12 October to 6 November. With this upturn, it struck its ATH on 6 November. Since then, the correction phase kicked in as the bulls steadily lost their power.
During the downfall, SOL lost over one-fourth of its value until it touched its one-month low on 26 November. After breaching the patterned uptrend, the bears ensured to continue the downtrend. Although the bulls triggered a 21% rally from 19 to 22 November, they could not back it up with high trading volumes.
Thus, the price continued to fall in a down-channel (yellow). At press time, SOL traded at $196.1125. The RSI was weak at the 42-mark. Also, the DMI flashed a bearish bias. However, MACD and AO hinted at decreasing strength in the near term.