Binance Coin slump could be temporary if this support zone remains strong
The selling pressure across the market on Wednesday saw Binance Coin pull back to $320 from $350 but its higher timeframe bias remained bullish, and a breakout past the $350 resistance was still possible.

Disclaimer: The information presented does not constitute financial, investment, trading, or other types of advice and is solely the writer’s opinion.
- The daily price structure remained bullish.
- The rejection was at a critical long-term resistance and bulls were likely to make another attempt.
Binance Coin saw good gains over the past ten days on the price charts as it climbed from $309 to $350. But the selling pressure across the market on Wednesday saw BNB pull back as well.
Realistic or not, here’s BNB’s market cap in BTC terms
If Bitcoin can defend the $28.6k support, there could be some near-term respite for the bulls. Whether BTC can reclaim $30k remained unclear, but its inability to defend this level over the past week meant the sellers had the advantage. Hence, BNB buyers must exercise caution.
BNB faced rejection at the Value Area High but the structure remained bullish
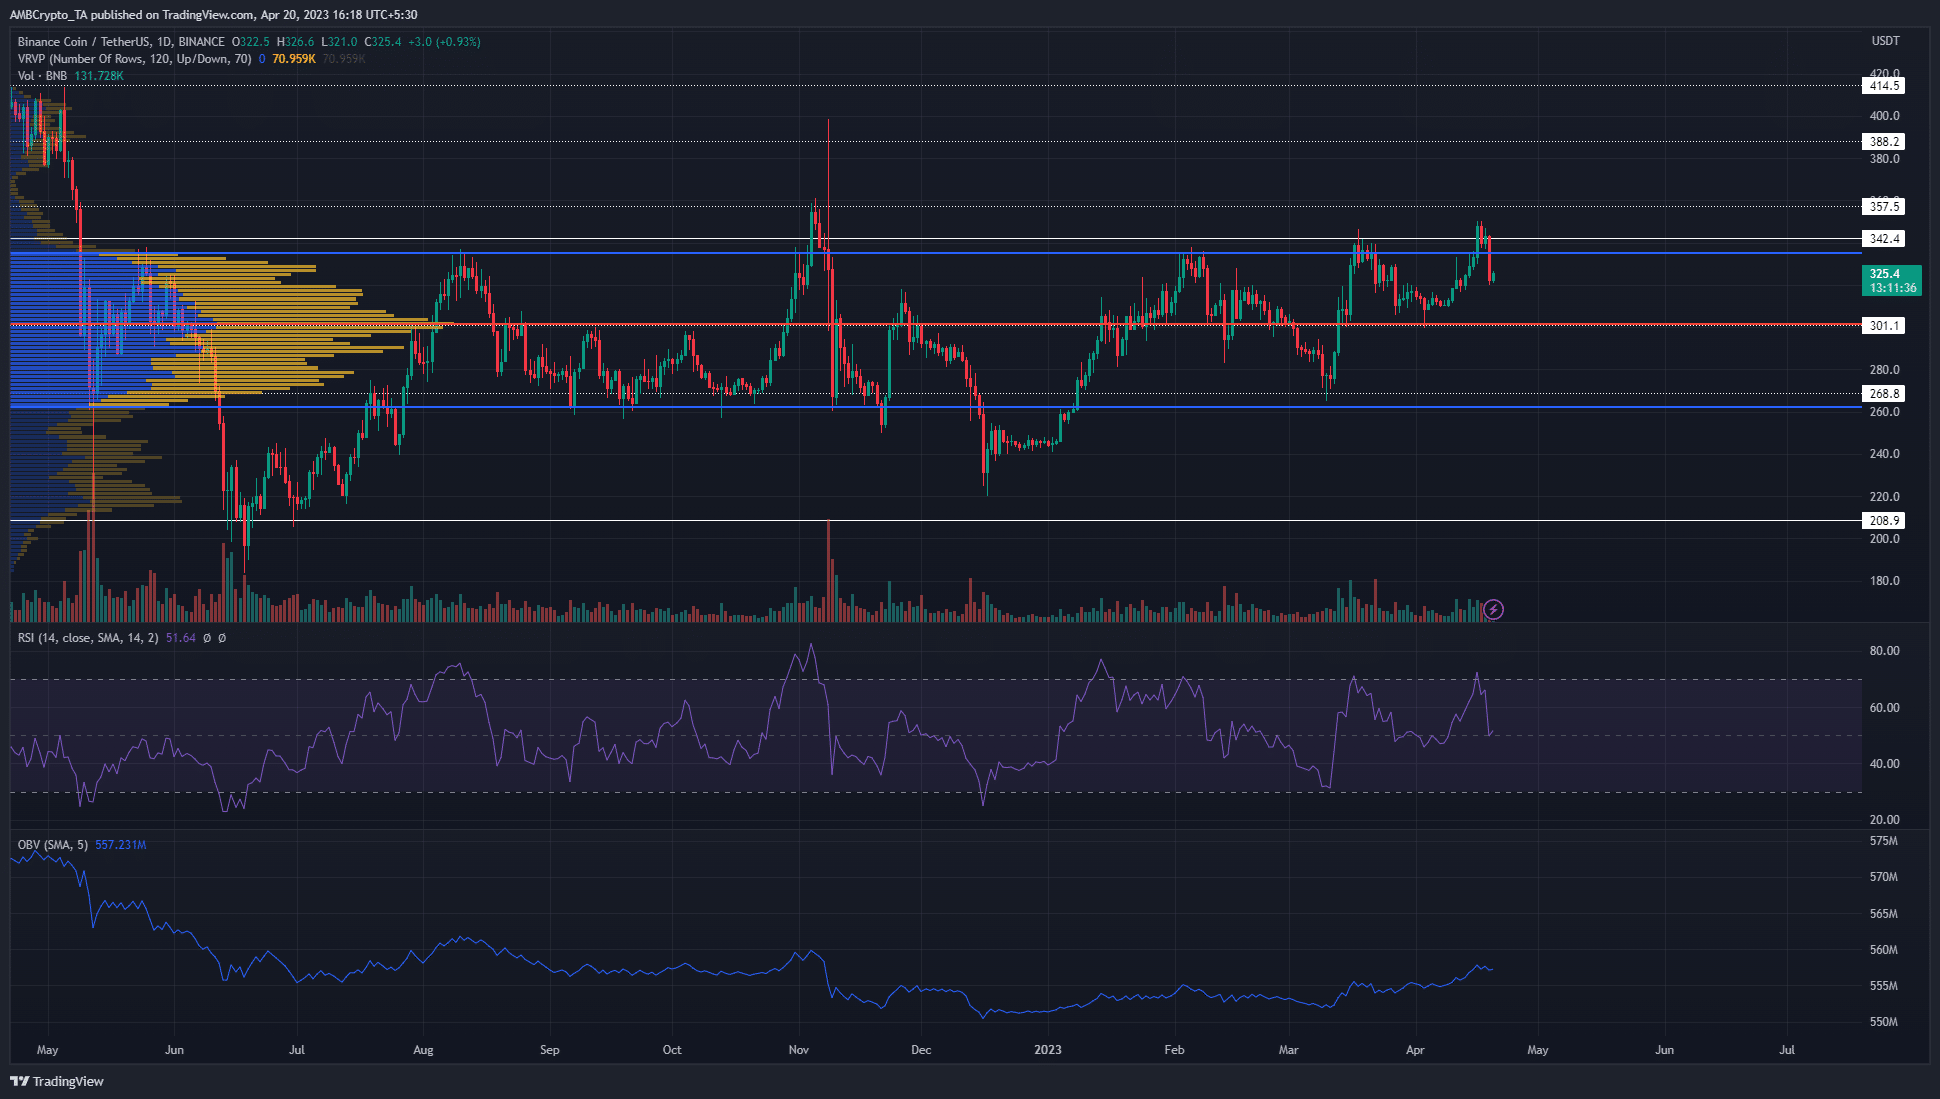
The Visible Range Volume Profile tool showed that the Value Area High and Value Area Low was at $335 and $262.2 respectively. The visible range extended to May 2022, marking these levels as significant long-term levels to watch out for.
The Point of Control lay at $302, coinciding with the psychological round-number support at $300.
In January, BNB was able to break out past the $268 level of resistance and retest it as support in March. The surge to $340 in late March flipped the structure to bullish, and the $300 support has been defended.
At the time of writing, the OBV was in an uptrend to show steady buying pressure. The RSI was yet to fall beneath the neutral 50 and continued to show an uptrend in progress.
Is your portfolio green? Check the Binance Coin Profit Calculator
However, the momentum was neural since the RSI stood at 51.6. Binance Coin has a lower timeframe demand zone in the $310-$315 area and could see a near-term bounce from there.
But whether the uptrend can continue or whether the bears will force new lows remained to be seen.
Active addresses have risen slightly showing increased usage
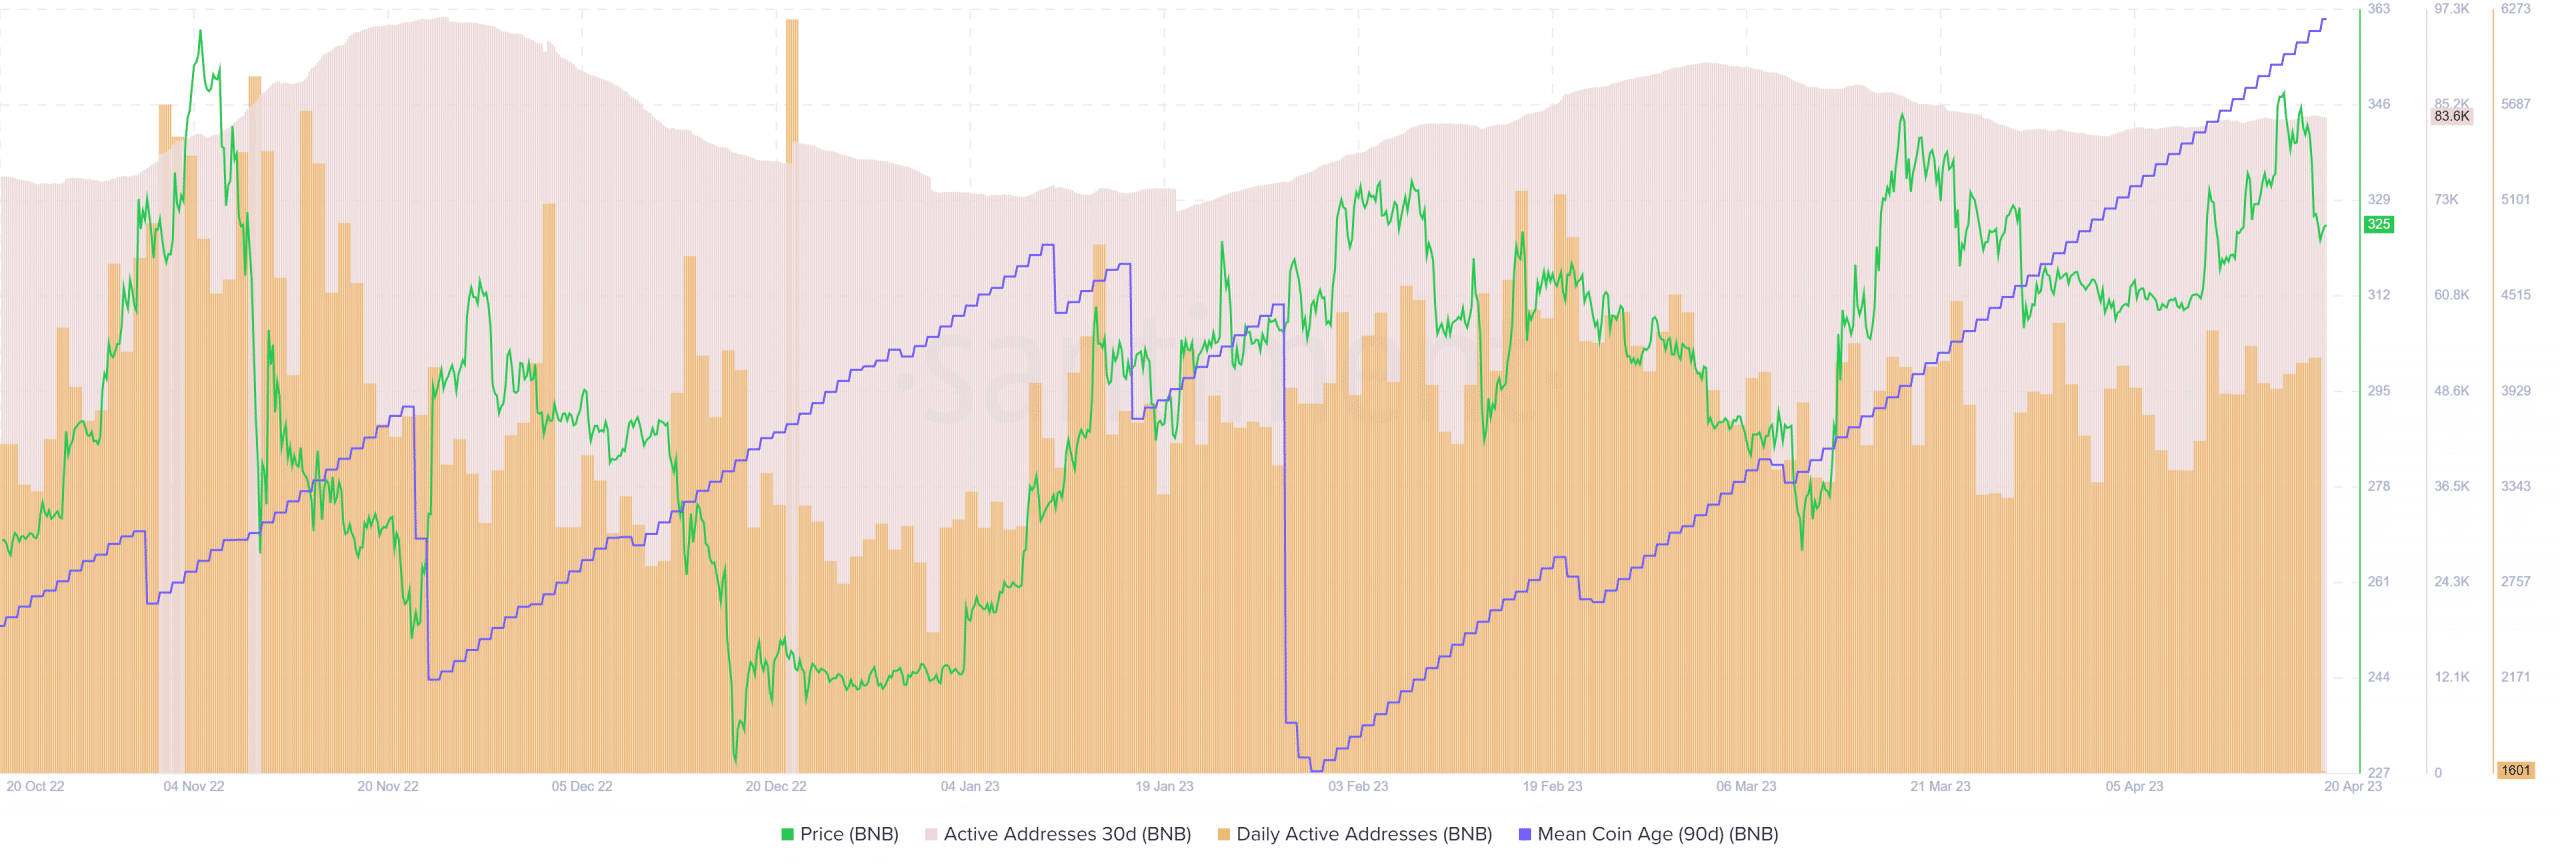
The 90-day mean coin age has been rising since early February to show network-wide accumulation. It did not see any major dips even though the price slumped to $260 in March. The active addresses have climbed slightly as well.
While the 30-day active addresses were relatively flat, the daily active addresses trended upward in April. This showed increased usage and could point toward demand as well.