Binance coin, Terra, Tron Price Analysis: 03 January

Ethereum’s two-day recovery made way for Tron’s jump from its immediate demand zone. Further, Terra formed a reversal pattern on its 4-hour chart after displaying a slight bullish edge. Meanwhile, Binance Coin was rangebound and flashed low volatility signs.
But all the above cryptos struggled to gather more volumes to commit to a convincing trend.
Binance Coin (BNB)
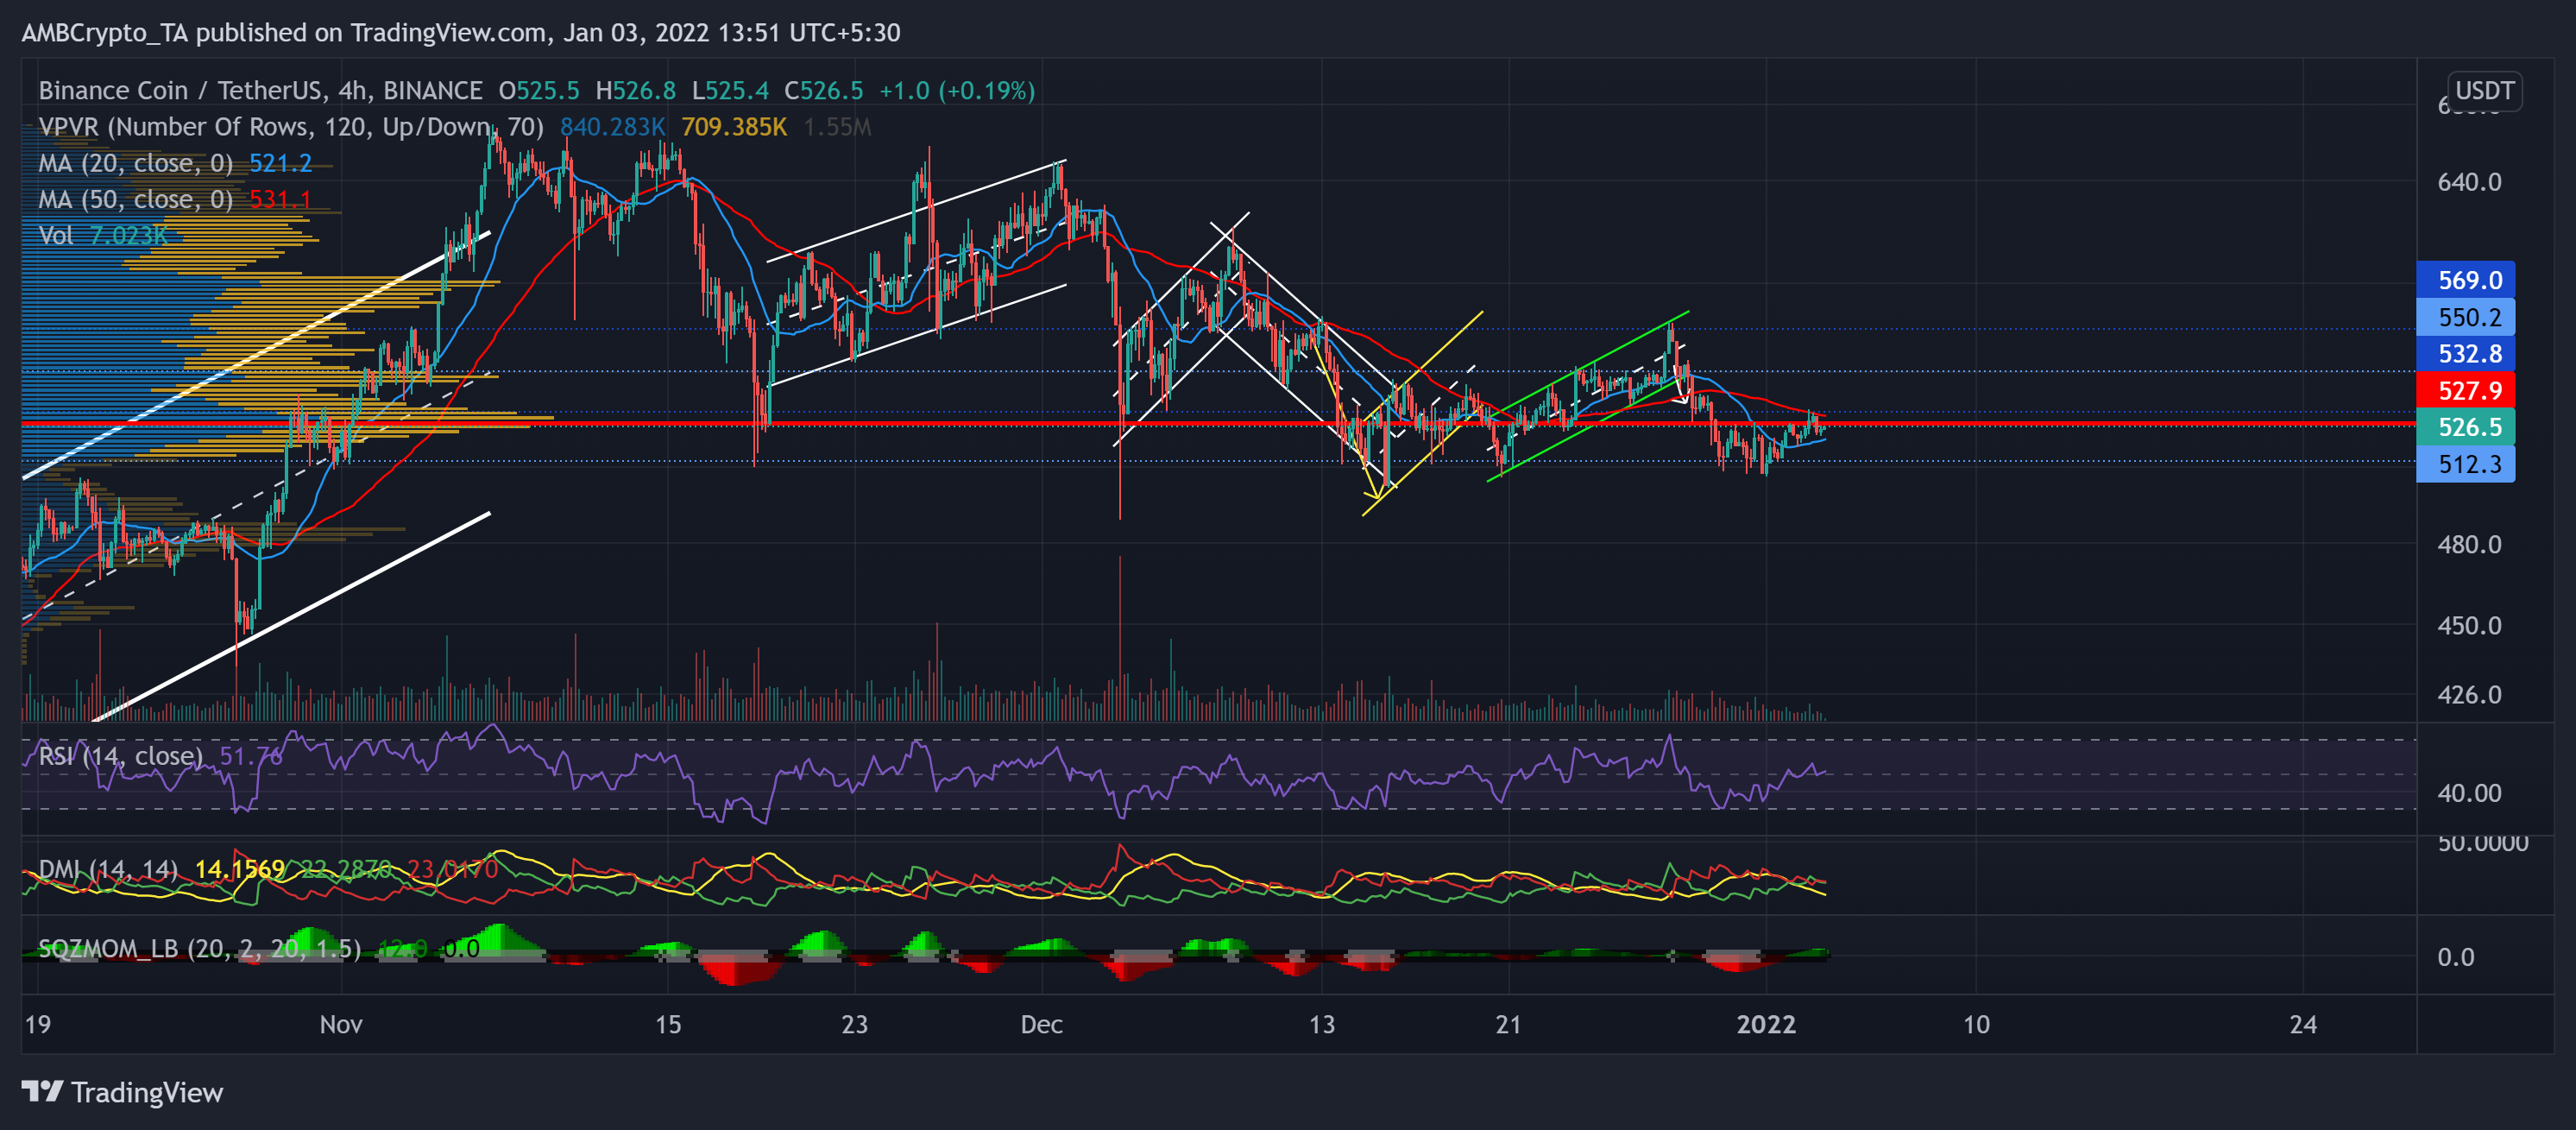
BNB persistently marked lower peaks after poking its six-month high on 7 November. The bulls, however, ensured the crucial 512-mark for over nine weeks now. Since 11 December, the alt has found an oscillating range between $569 and the aforementioned mark.
The visible range indicated this area as highly liquid for over 11 weeks now. Also, its Point of control at $527.9 acted as immediate resistance as the bulls tested this level four times over the past five days. Accordingly, the Squeeze Momentum Indicator flashed black dots, indicating a low volatility phase.
At press time, BNB traded above its 20 SMA (cyan) at $526.5. The RSI saw a 17 point surge over the past two days, displaying a decent recovery. Although the DMI slightly preferred the bears, the ADX flashed a weak directional trend.
Terra (LUNA)
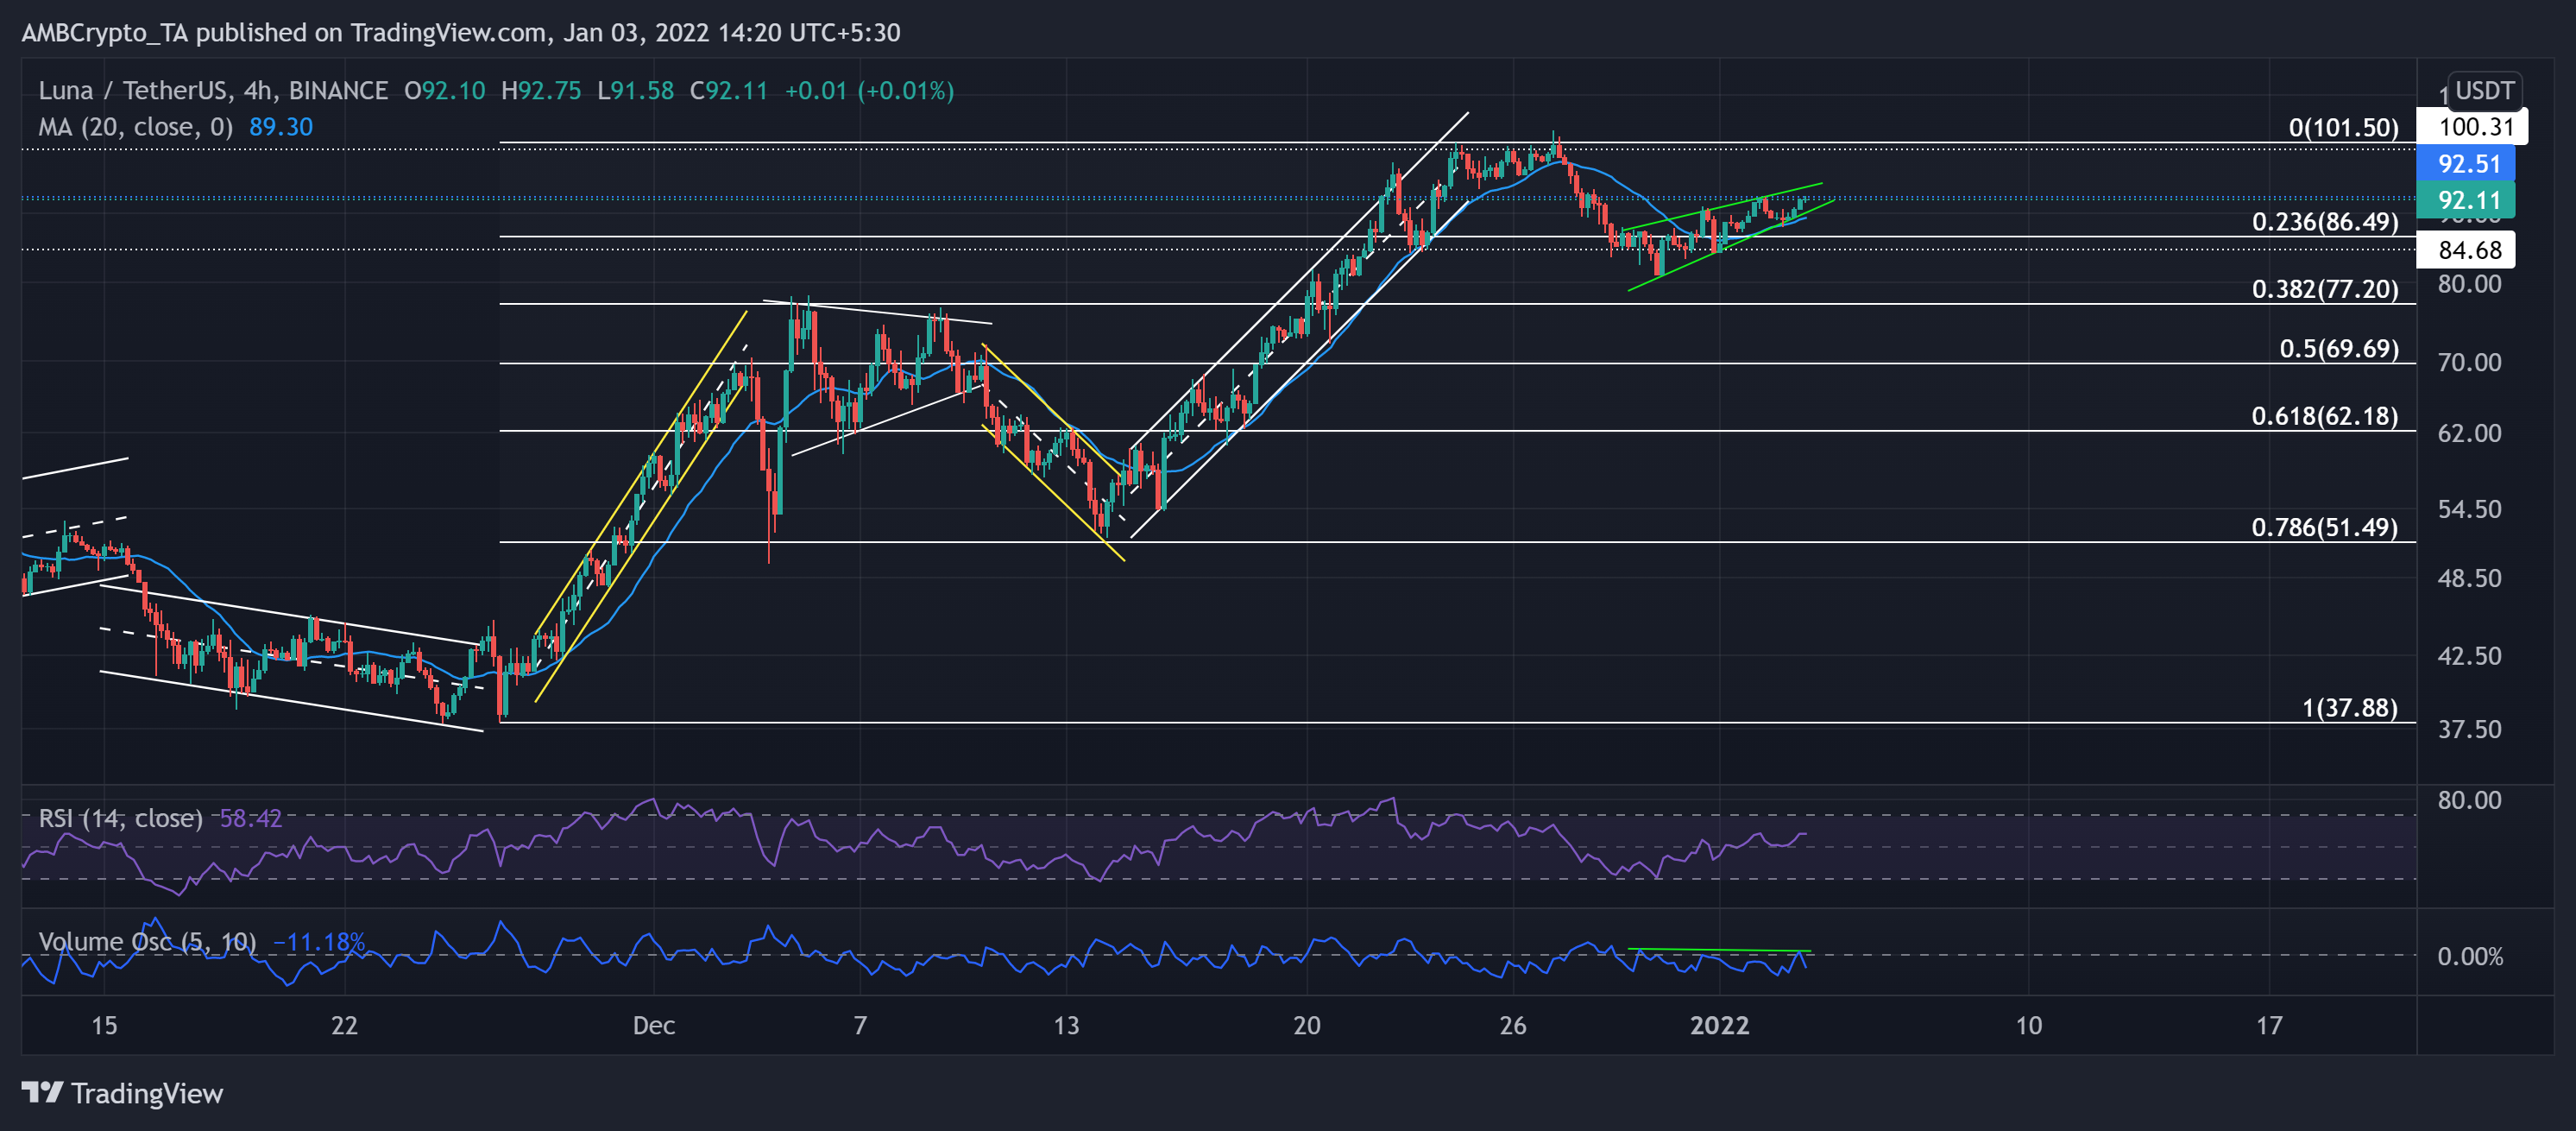
LUNA saw a staggering 99.96% up-channel rally (from 14 December low) until it touched its ATH. After retesting the $100-mark four times, it poked its lifetime milestone on 27 December. Then, after a 22.07% retracement, the alt reclaimed the 23.6% lost Fibonacci support.
Meanwhile, LUNA formed a rising wedge (green) on its 4-hour chart. Also, the bulls flipped the 20-SMA (cyan) resistance to immediate support. LUNA bulls now endeavored to test the upper trendline of the wedge. On the flipside, Any break-down would find testing support at the 23.6% Fibonacci level.
At press time, LUNA traded 10.9% below its ATH at $92.11. The RSI wavered around the 58-mark after constantly marking higher troughs and peaks. However, the Volume Oscillator marked lower highs during the recent rise, indicating a weak bullish move.
Tron (TRX)

The down-channel (white) breakout transposed into a falling wedge (yellow) while the alt yet again found 23.6% Fibonacci resistance as a strong barrier.
With 14 green candles out of the total of nearly 22 candlesticks (from 20 to 24 December), Tron witnessed a V-shaped recovery (green). But this rally found strong resistance at the $0.082-mark as the bulls retested this level twice but succumbed to a broader sell-off. Meanwhile, the Bitcoin fear and greed index plunged towards the ‘fear’ zone.
The alt saw a 6.66% recovery in the past two days as the price bounced from its demand zone. However, the Volume Oscillator marked lower peaks, hinting at a weak bullish move.
At the time of writing, TRX traded at $0.077. The RSI managed to break above the 44-mark but showed neutral signs. The ADX displayed a weak directional trend for TRX.


