Binance Coin’s next big price hike and why it depends on this ‘triangle’
BNB’s rally from its support line might be short-lived as the coin’s funding rate remains negative
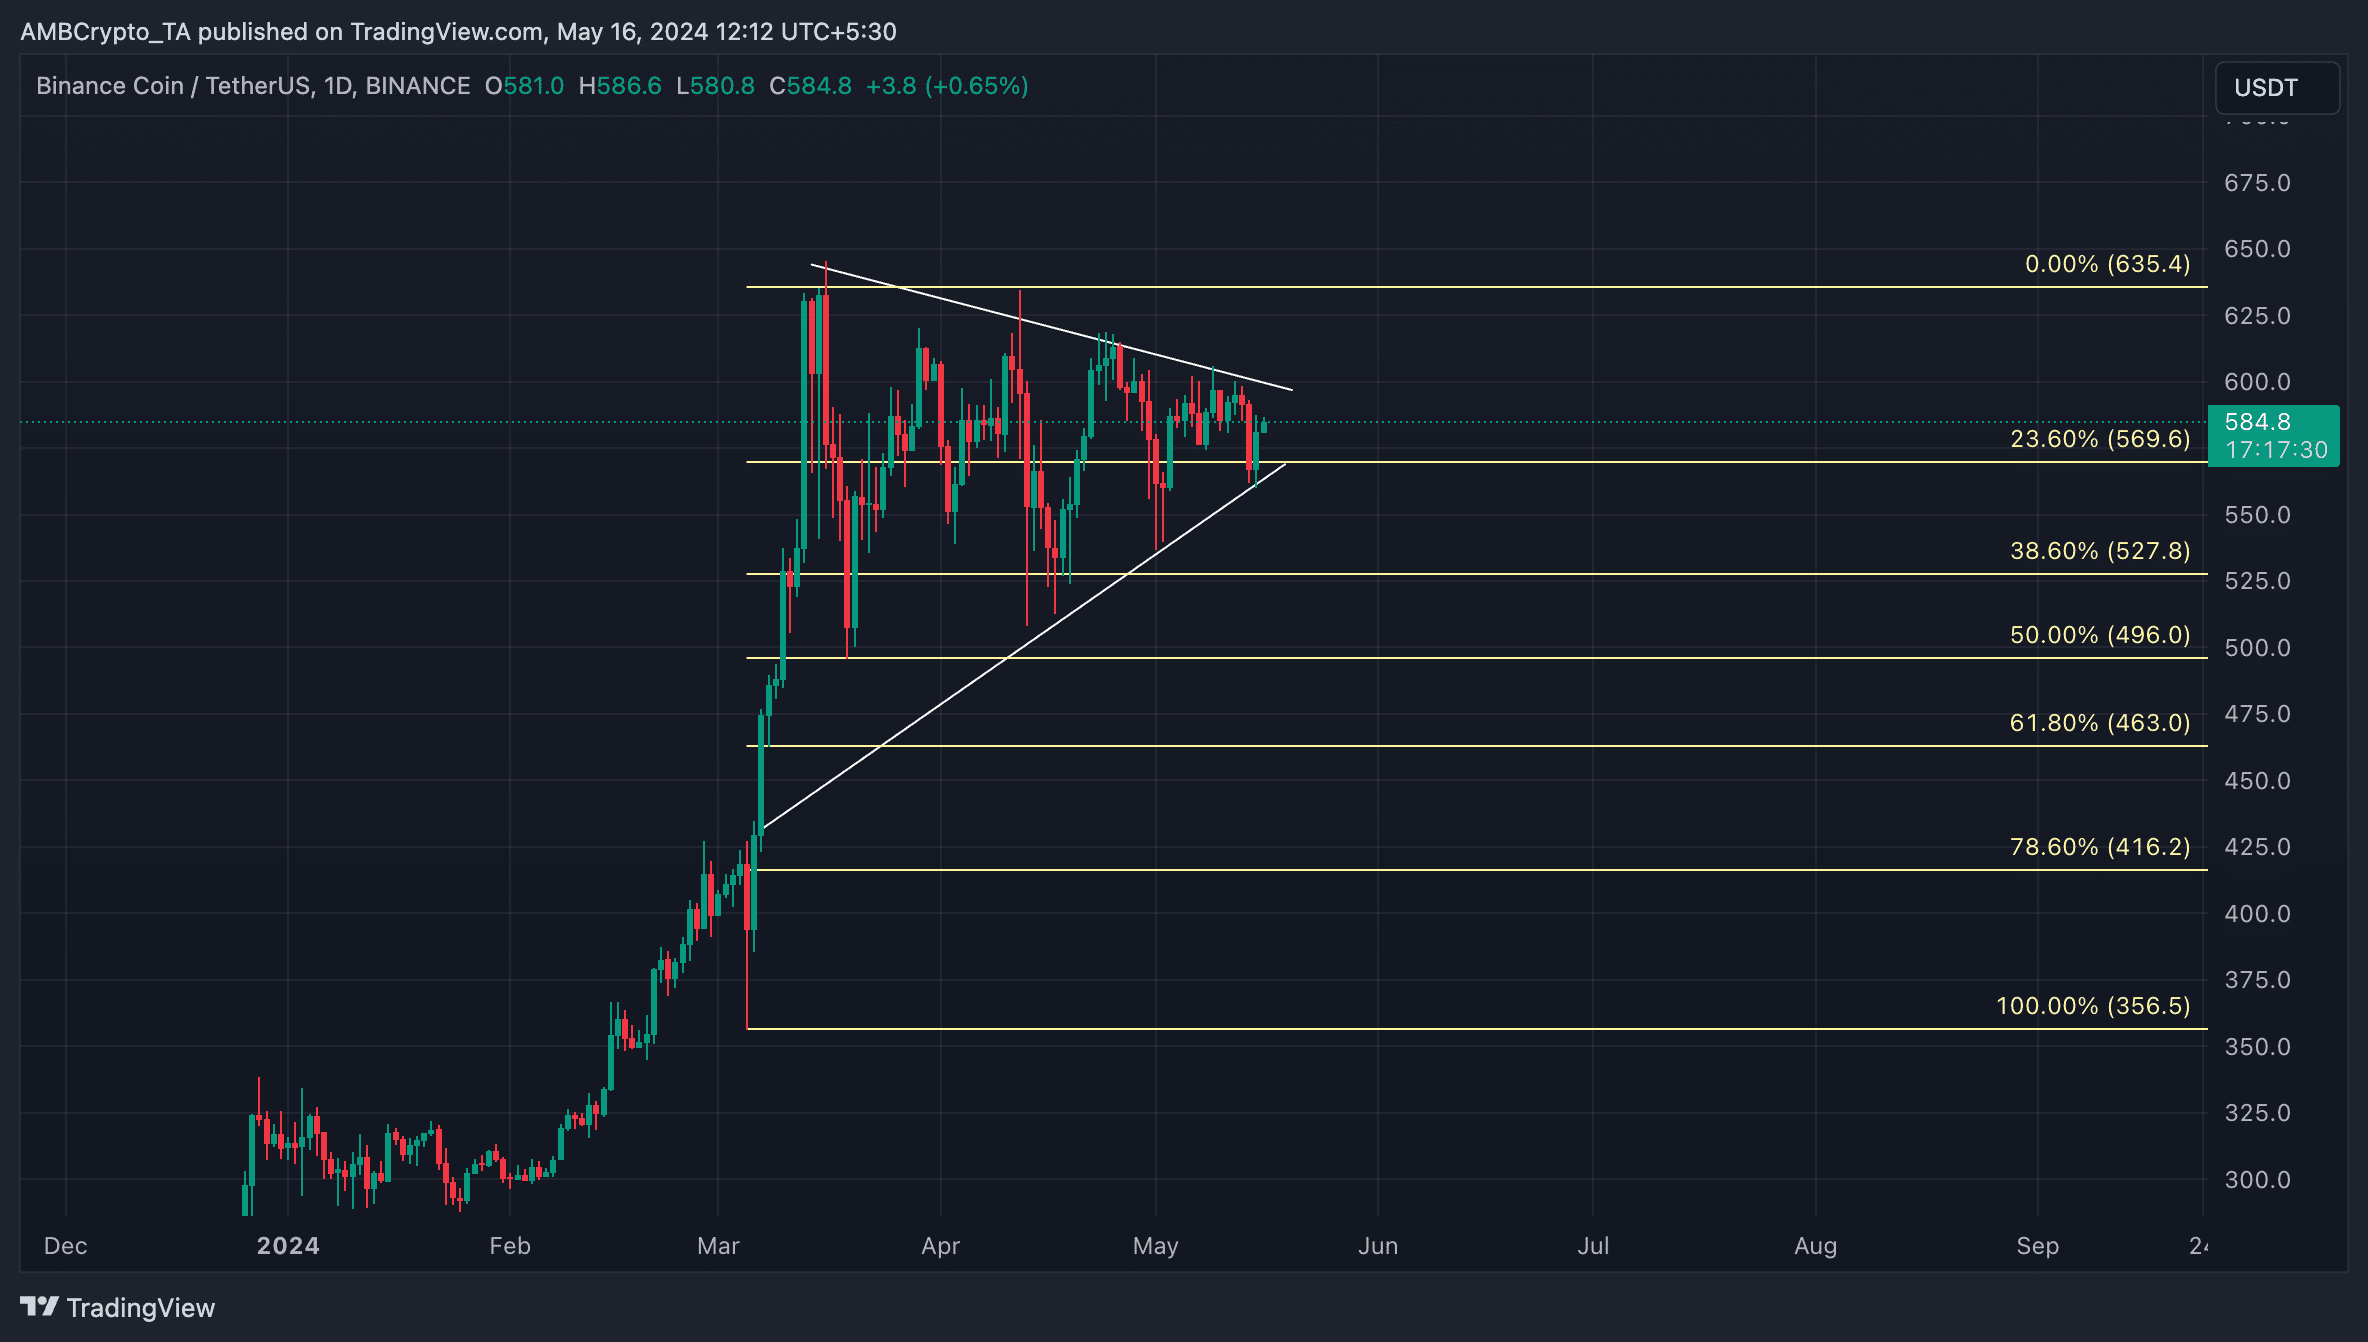
- BNB was trading above the support line of its symmetrical triangle pattern
- BNB remains at risk of a decline as its funding rate was negative
The recent market rally has caused Binance Coin [BNB] to rebound sharply off the support line of its symmetrical triangle pattern.
This pattern is formed when an asset’s price hits various lower highs and higher lows. It indicates that the asset’s price keeps getting squeezed between buyers and sellers, with buyers pushing prices up to meet the resistance and sellers pushing them down to find support.
When this happens, the asset concerned is said to be consolidating within a range.
Will it rally towards its resistance?
At press time, BNB was valued at $583.84 following a 3% uptick from its support level of $566. To assess whether the altcoin can rally towards the upper trend line of the triangle and above it, a good place to start is to consider the market’s sentiment.
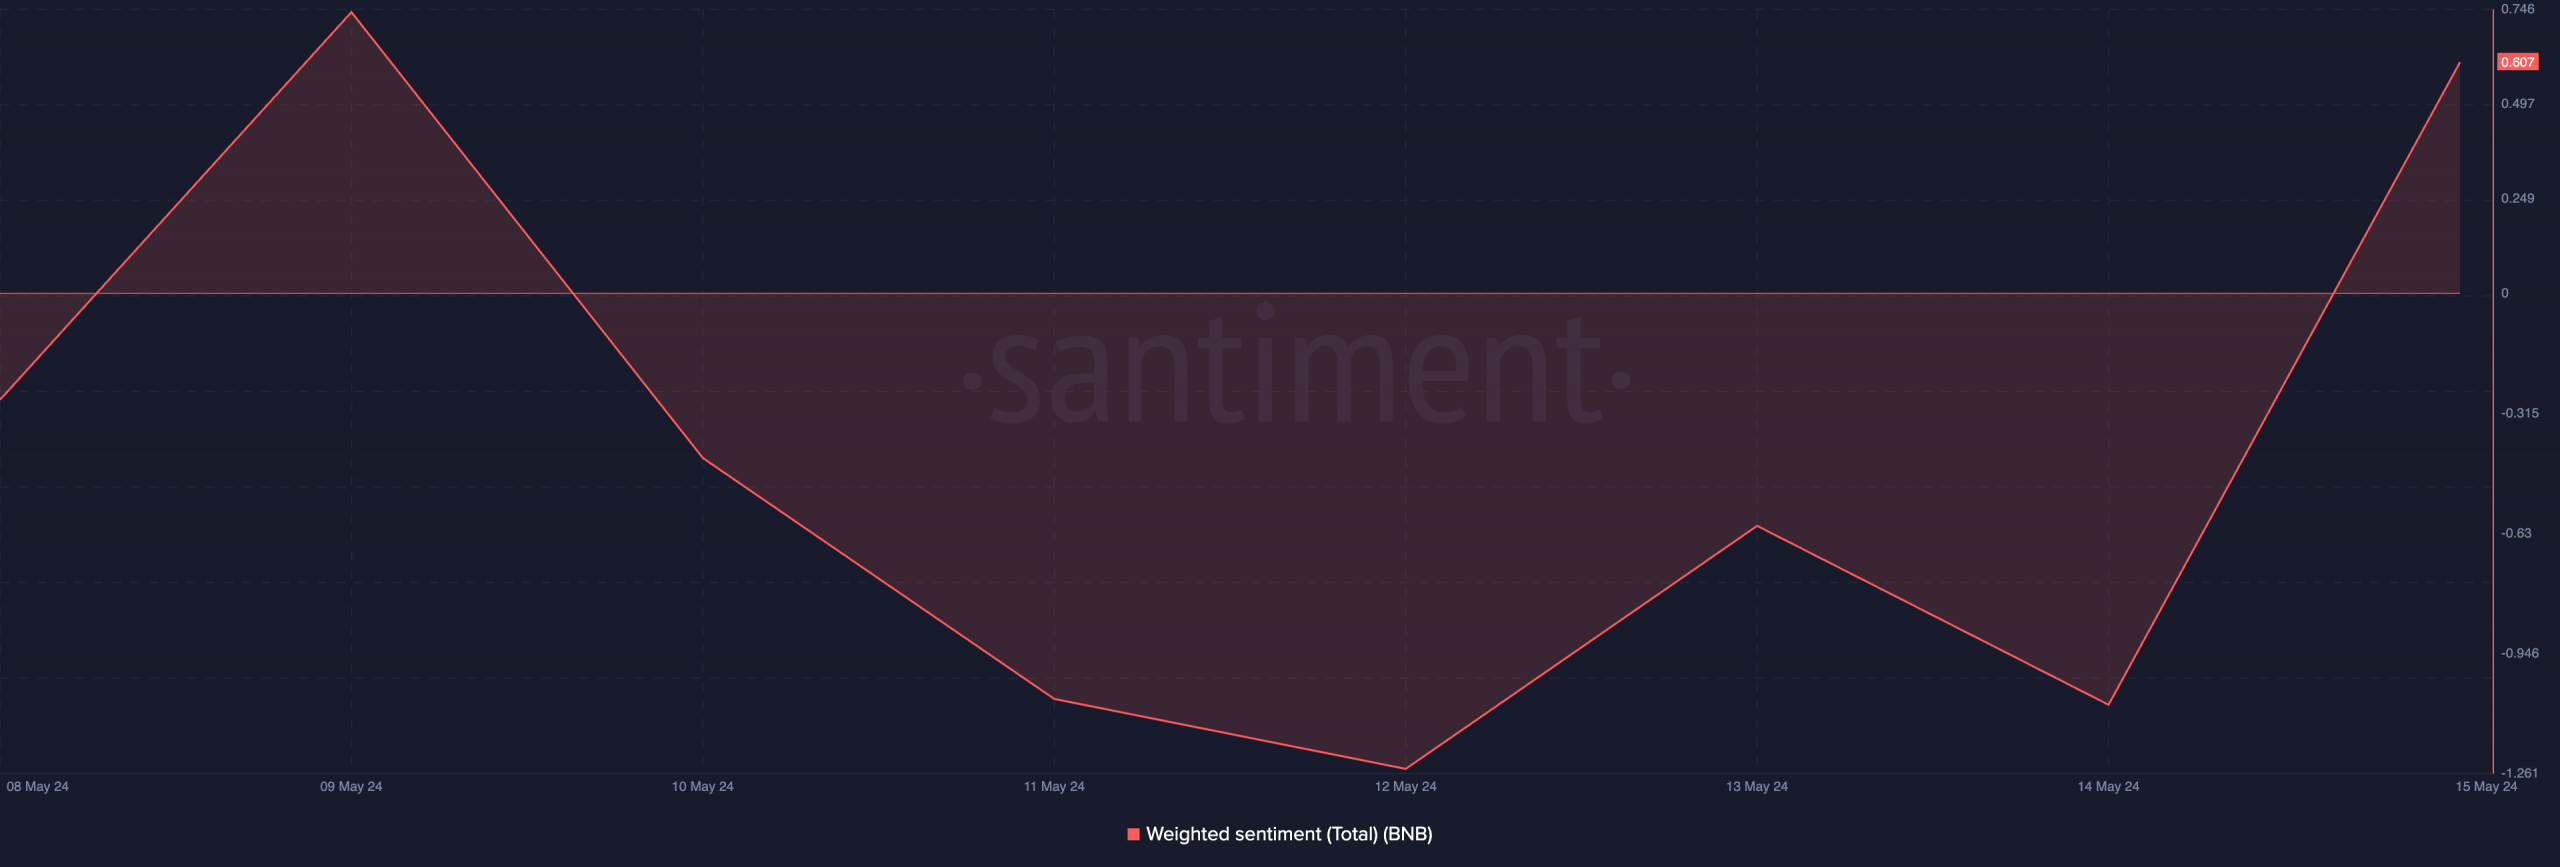
According to Santiment’s data, the coin’s weighted sentiment was 0.607 and on an uptrend at press time. The metric’s positive value suggested that the BNB market enjoyed positive sentiment from its participants.
BNB’s key momentum indicators also confirmed this bullish outlook. At press time, its Money Flow Index (MFI) was 65.61 and rising, showing that market participants favoured BNB accumulation over distributing their holdings.
Likewise, the altcoin’s Chaikin Money Flow was on an uptrend and above the zero line at 0.07. This pointed to a steady inflow of liquidity into the BNB market. If this indicator continues to rise, it would mean a hike in demand for the cryptocurrency.
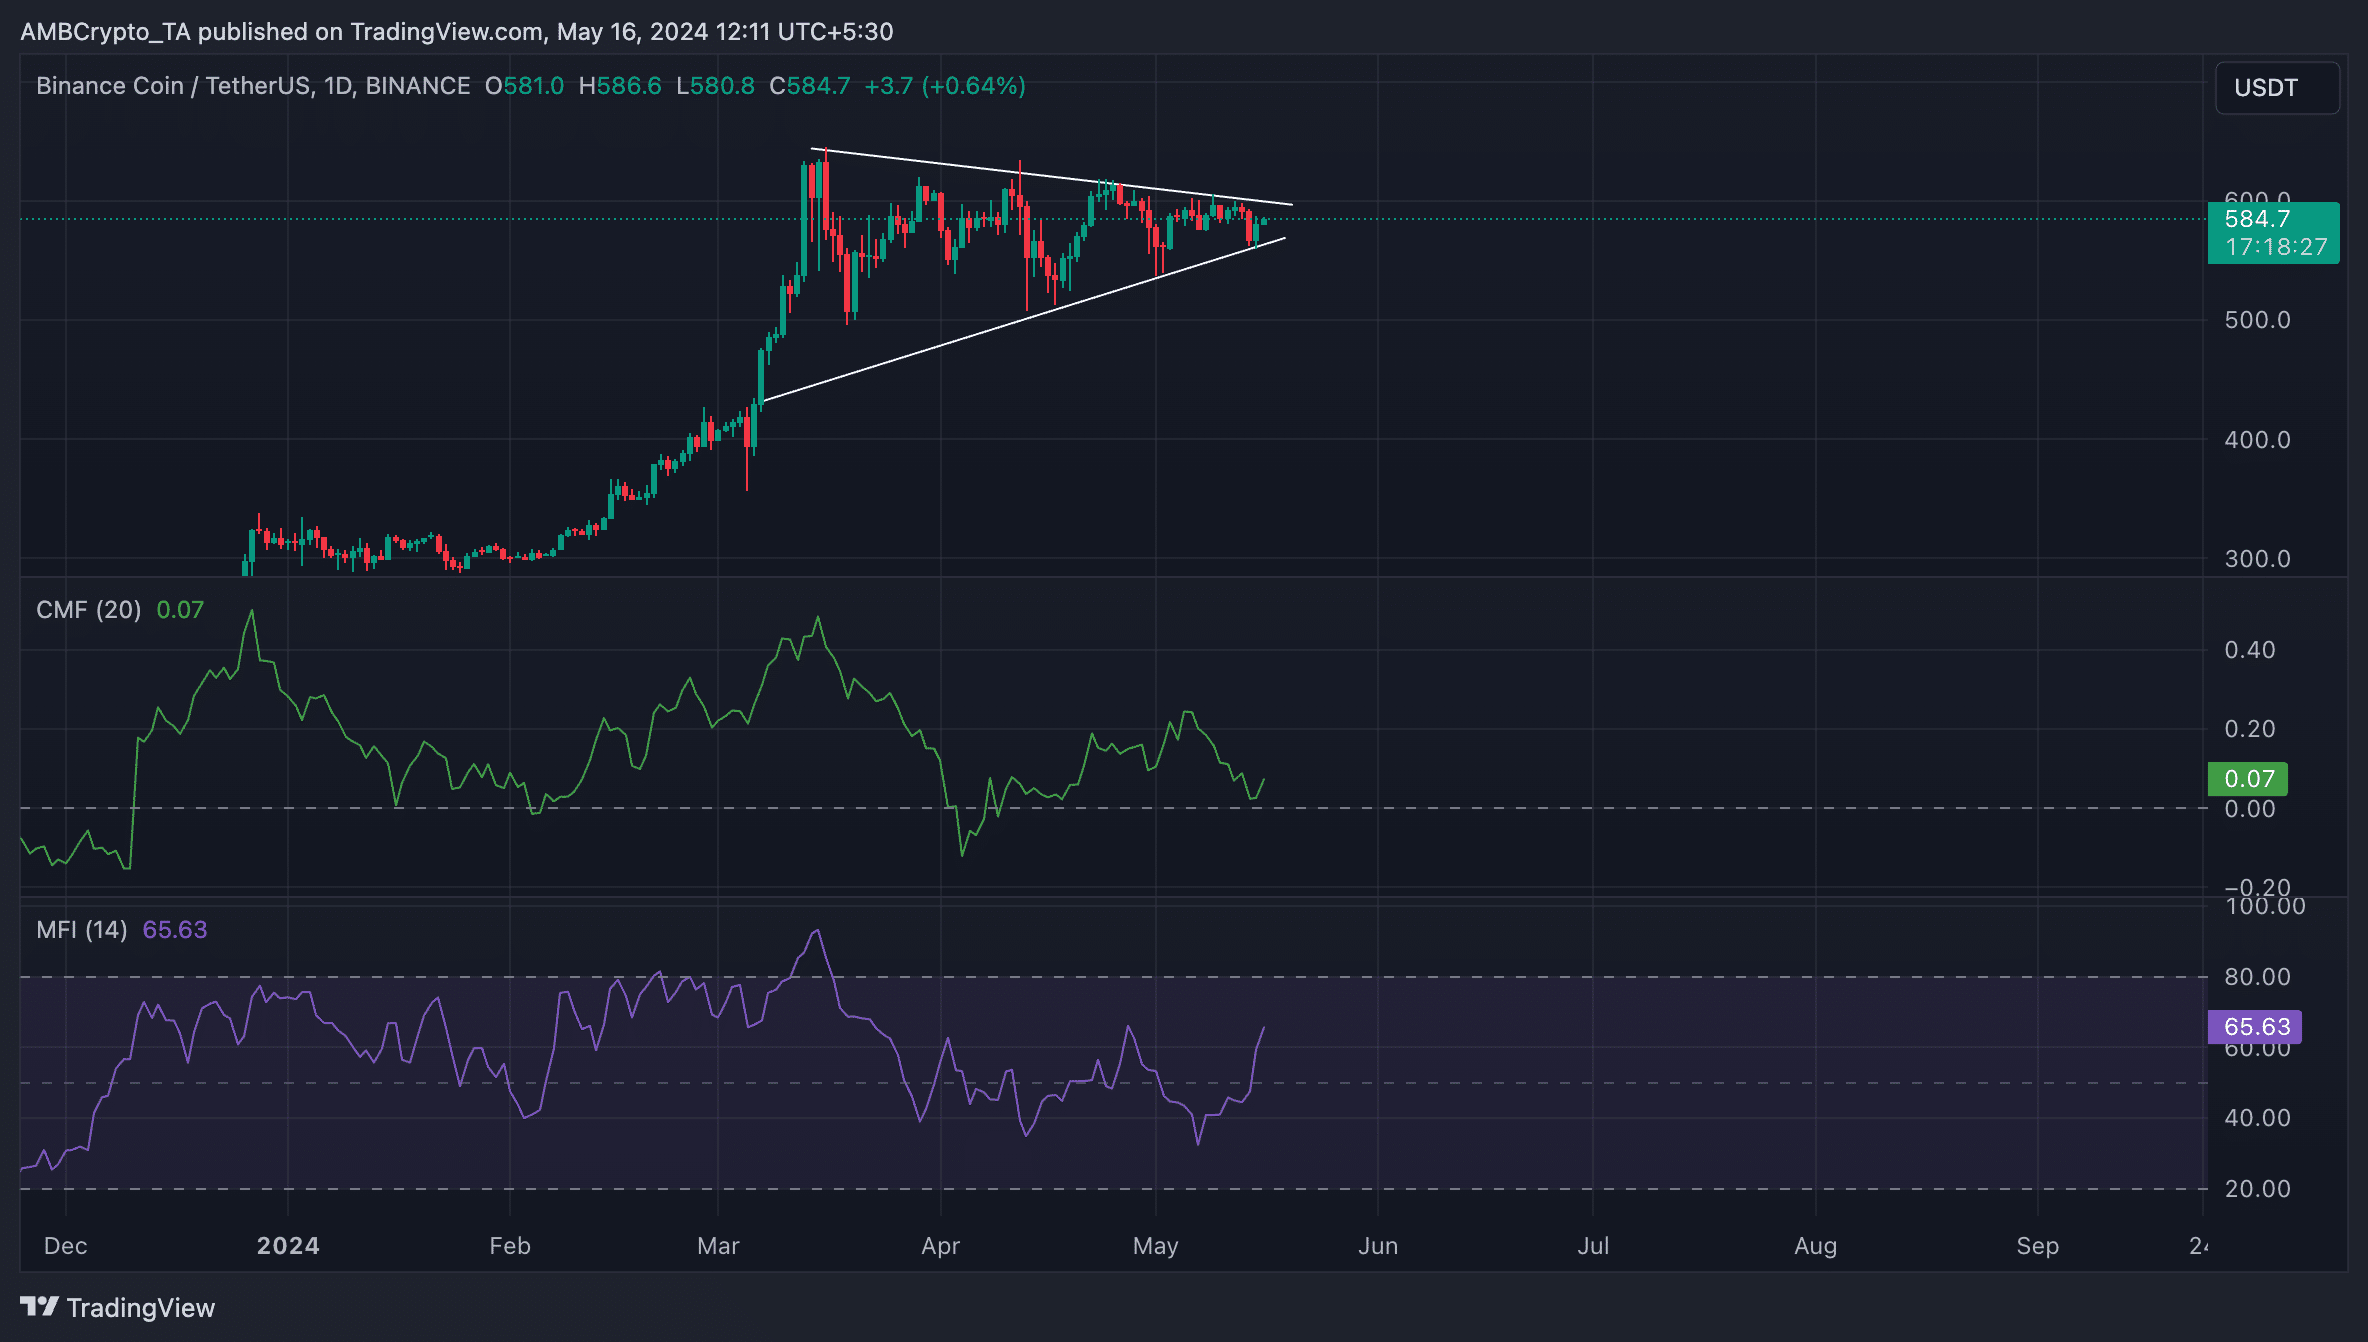
If sentiment continues to be bullish, buyers can push BNB’s price above the resistance line of the triangle. The coin’s price could surge to $596 and then, to $643.
Is your portfolio green? Check out the BNB Profit Calculator
BNB remains at risk
Conversely, if this bullish projection is invalidated and bearish pressure mounts, BNB’s price might break below the triangle to trade around the $520-level.
The possibility of this happening is heightened by how significant the altcoin’s negative funding rate has been over the last few weeks.
In fact, according to Coinglass, this coin has recorded predominantly negative funding rates since 23 April. As of 15 May, BNB’s funding rates had dropped to a multi-month low of 0.106%.
The last time the coin’s funding rate was this low was back in February.
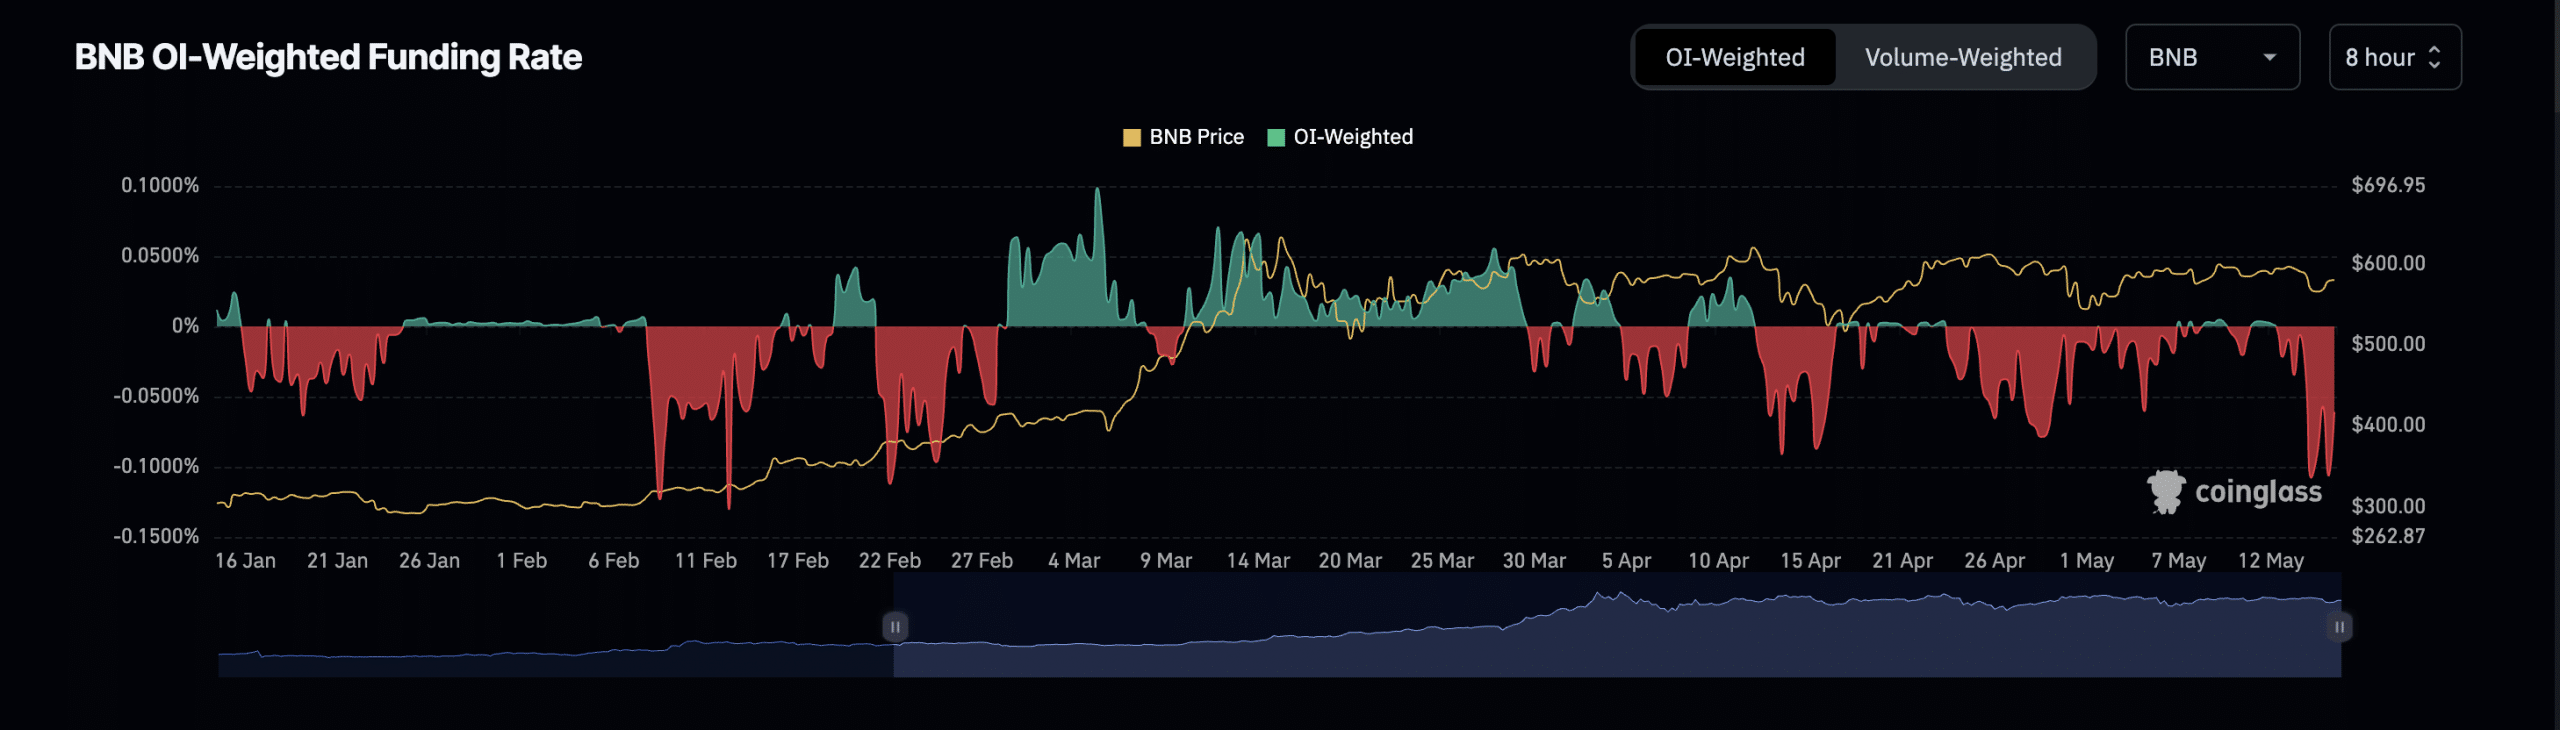
When an asset’s funding rate is negative, more traders hold short positions. This suggests that more traders are expecting the asset’s price to fall and are buying the asset with the expectation of a price rally.