Binance delists WAVES crypto: Will prices fall below $1 now?

- WAVES social activity has risen in the past 24 hours.
- The demand for the altcoin has fallen to its lowest point in years.
Waves [WAVES] has seen a spike in its social activity following Binance’s decision to delist the altcoin, data from Santiment has shown.
According to the on-chain data provider’s list of trending coins in the past 24 hours, WAVES ranks highest as the asset that has seen the most social media discussions.
On 3rd June, leading cryptocurrency exchange Binance announced the delisting of WAVES and three other assets—OMG Network (OMG), Nem (XEM), and Wrapped NXM (WNXM)—from its platform, triggering a wave of price declines.
Following Binance’s announcement, WAVES value immediately dropped by 30%. At press time, the altcoin traded at $1.53, its lowest price since October 2023, according to CoinGecko.
WAVES’ demand crashes
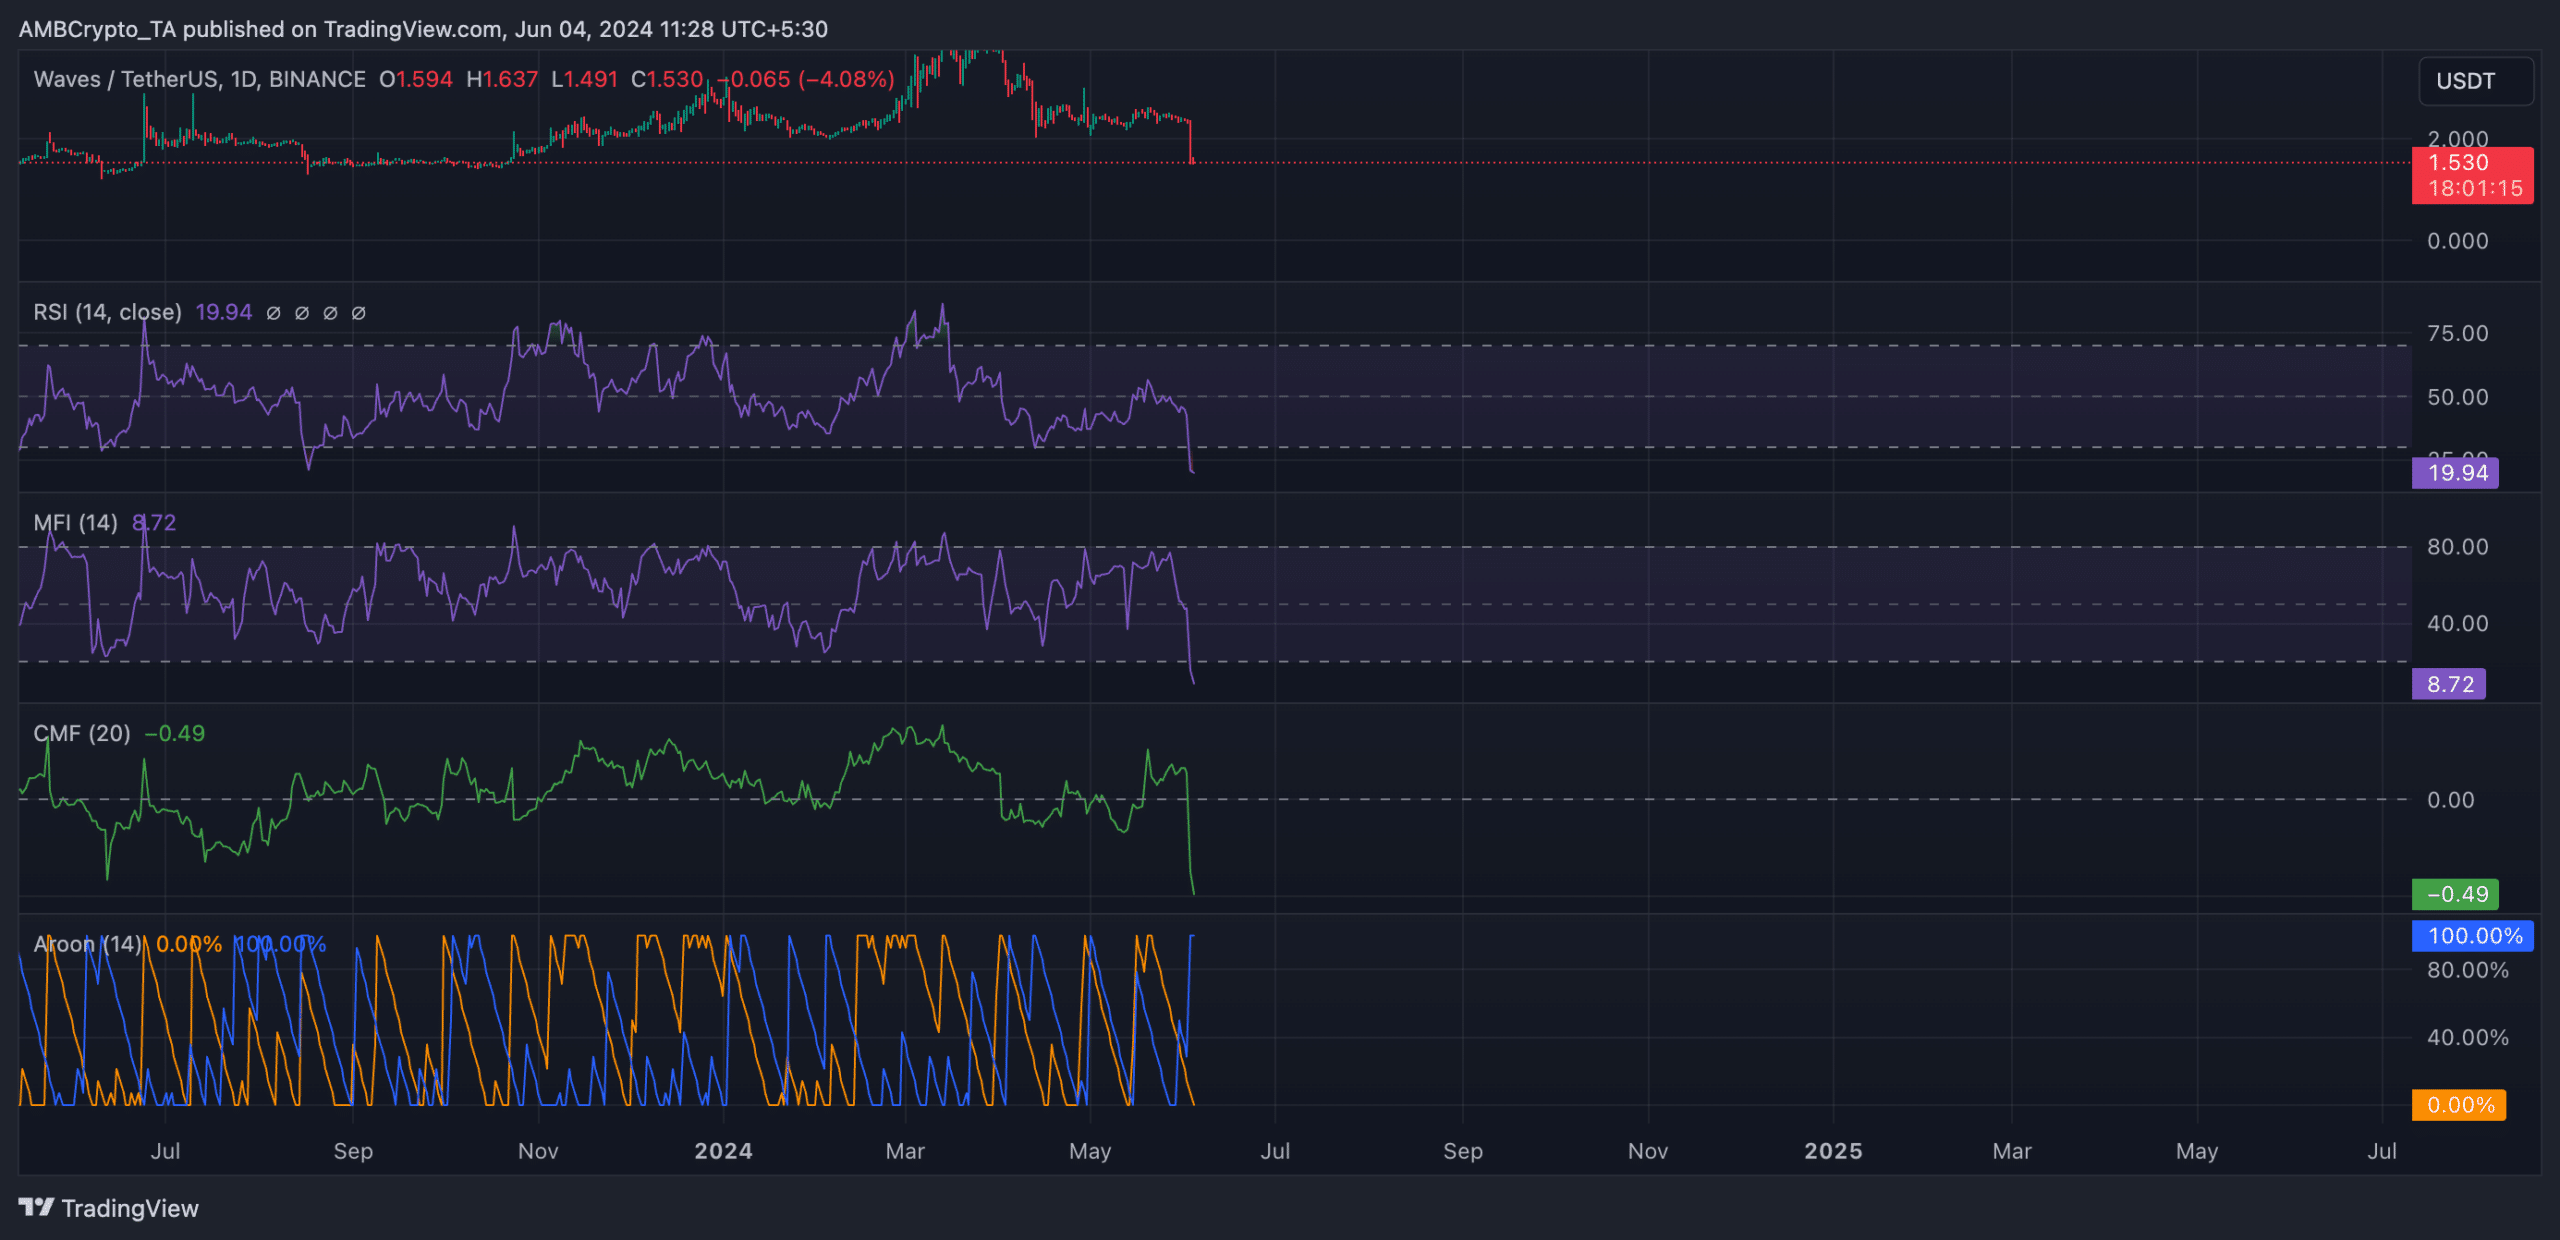
AMBCrypto’s assessment of WAVES’ performance on a one-day chart showed that demand for the altcoin has cratered to new lows. For example, its Relative Strength Index (RSI) and Money Flow Index (MFI) indicators were 19.99 and 8.73, respectively.
These values showed that selling pressure was significant and overshadowed all forms of buying activity.
Although the values of these key momentum indicators signaled that the token was oversold and a correction might be underway, readings from its Chaikin Money Flow (CMF) suggested that the possibility of any price rebound in the short term was low.
As of this writing, WAVES’ CMF was -0.49, its lowest level since the token launched.
This indicator measures the flow of money into and out of an asset. When its value is zero below, it signals increased liquidity exit from the asset’s market. With a CMF value of -0.49, capital flight from the WAVES market was very significant at press time.
WAVES’ Aroon Down Line (blue) was 100%, confirming the strength of the current downtrend. This indicator identifies the token’s trend strength and potential reversal points in its price movement.
When the asset’s Aroon Down line is close to 100, it indicates that the downtrend is strong and that the most recent low was reached relatively recently.
Is your portfolio green? Check the Waves Profit Calculator
Conversely, WAVES’ Aroon Up Line (orange) was 0% as of this writing, suggesting that there was no uptrend and the token’s most recent high was reached long ago.
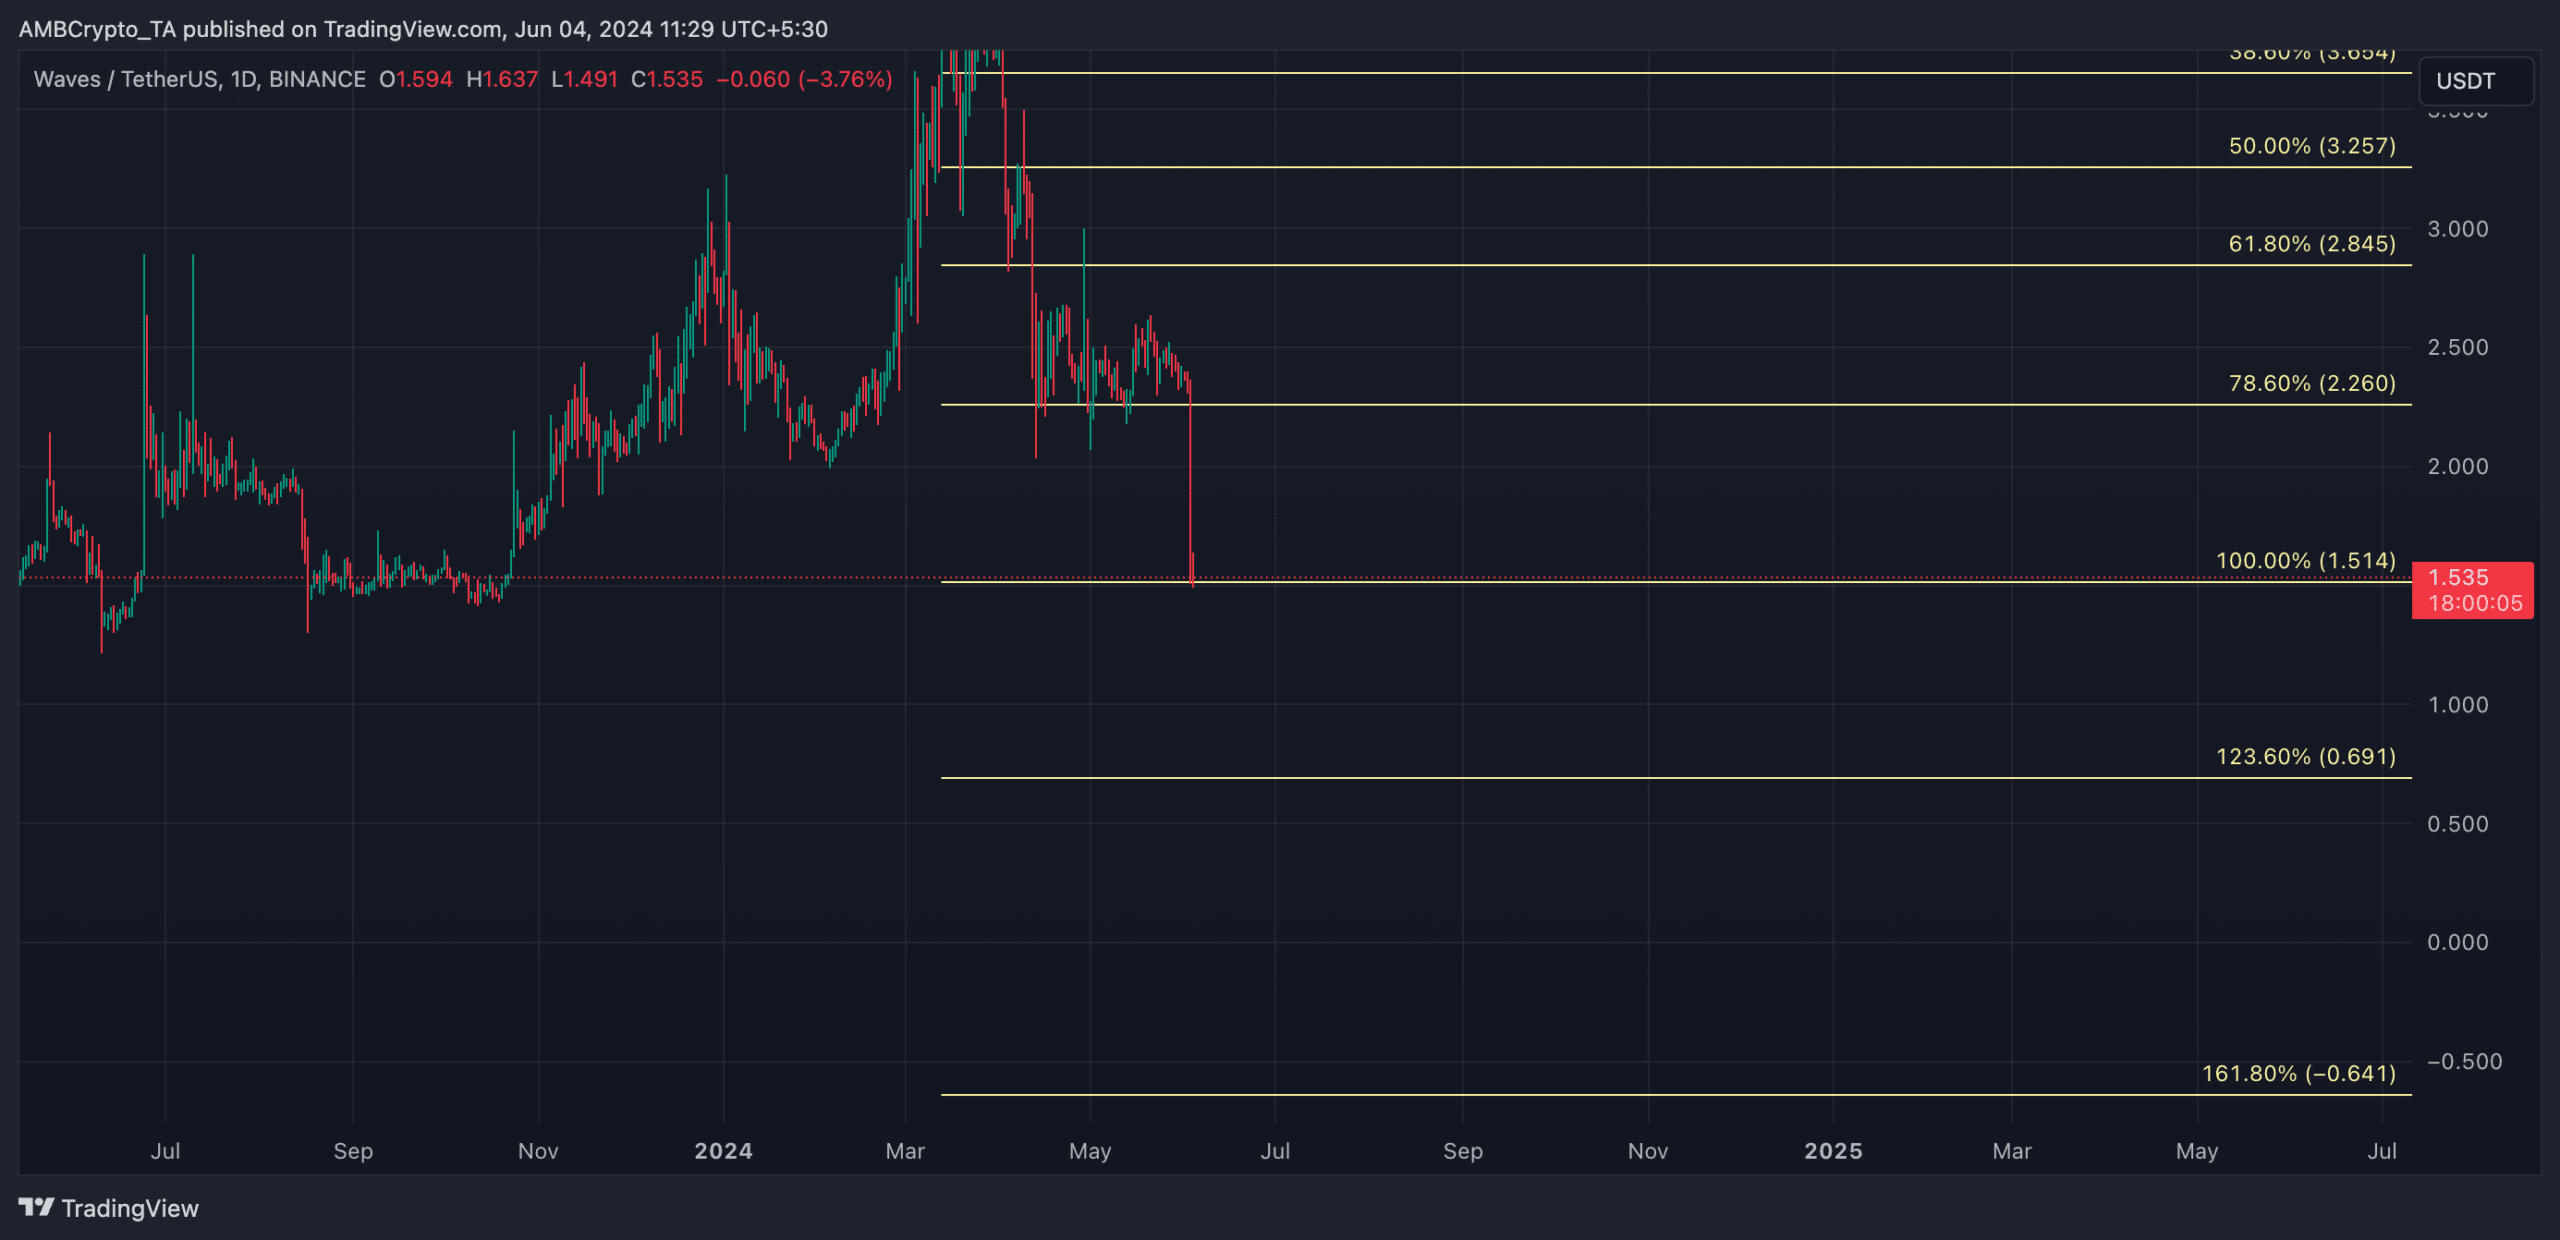
If demand continues to plummet this way, WAVES might drop below $1 to exchange hands at $0.69.


