Binance vs. Coinbase: CZ’s bold comparison and BNB’s bullish momentum

- Binance CEO Chanpeng Zhao compared Binance.US’s trading volume with that of Coinbase.
- BNB shifted towards a slightly bullish trend following its recent modest gains over the past four days.
In a bold move, Binance [BNB] CEO Chanpeng Zhao shared a comparison of Binance.US’s trading volume with that of Coinbase on 31 March, showcasing an impressive surge in activity for the former. With such a significant uptick in trading volume, one might wonder if this newfound confidence has also extended to the BNB coin.
Realistic or not, here’s BNB market cap in BTC’s terms
Binance trading volume dwarfs Coinbase
CZ may have made this comparison because Binance.US and Coinbase both operate in the United States. CZ shared a post indicating that Binance US achieved a remarkable feat – its weekly trading volume was equivalent to 41% of Coinbase’s global trading volume.
Sharing some public data. @BinanceUS (NOT including https://t.co/ukvU1dlpOt) weekly trading volume reached 41% of Coinbase's (global) trading volume last week. An ATH. pic.twitter.com/DMY8f64Eab
— CZ ? Binance (@cz_binance) March 31, 2023
It is worth noting how CZ emphasized that these figures pertained only to Binance.US and did not consider the entirety of Binance’s trading volume, unlike the comparison being made with Coinbase.
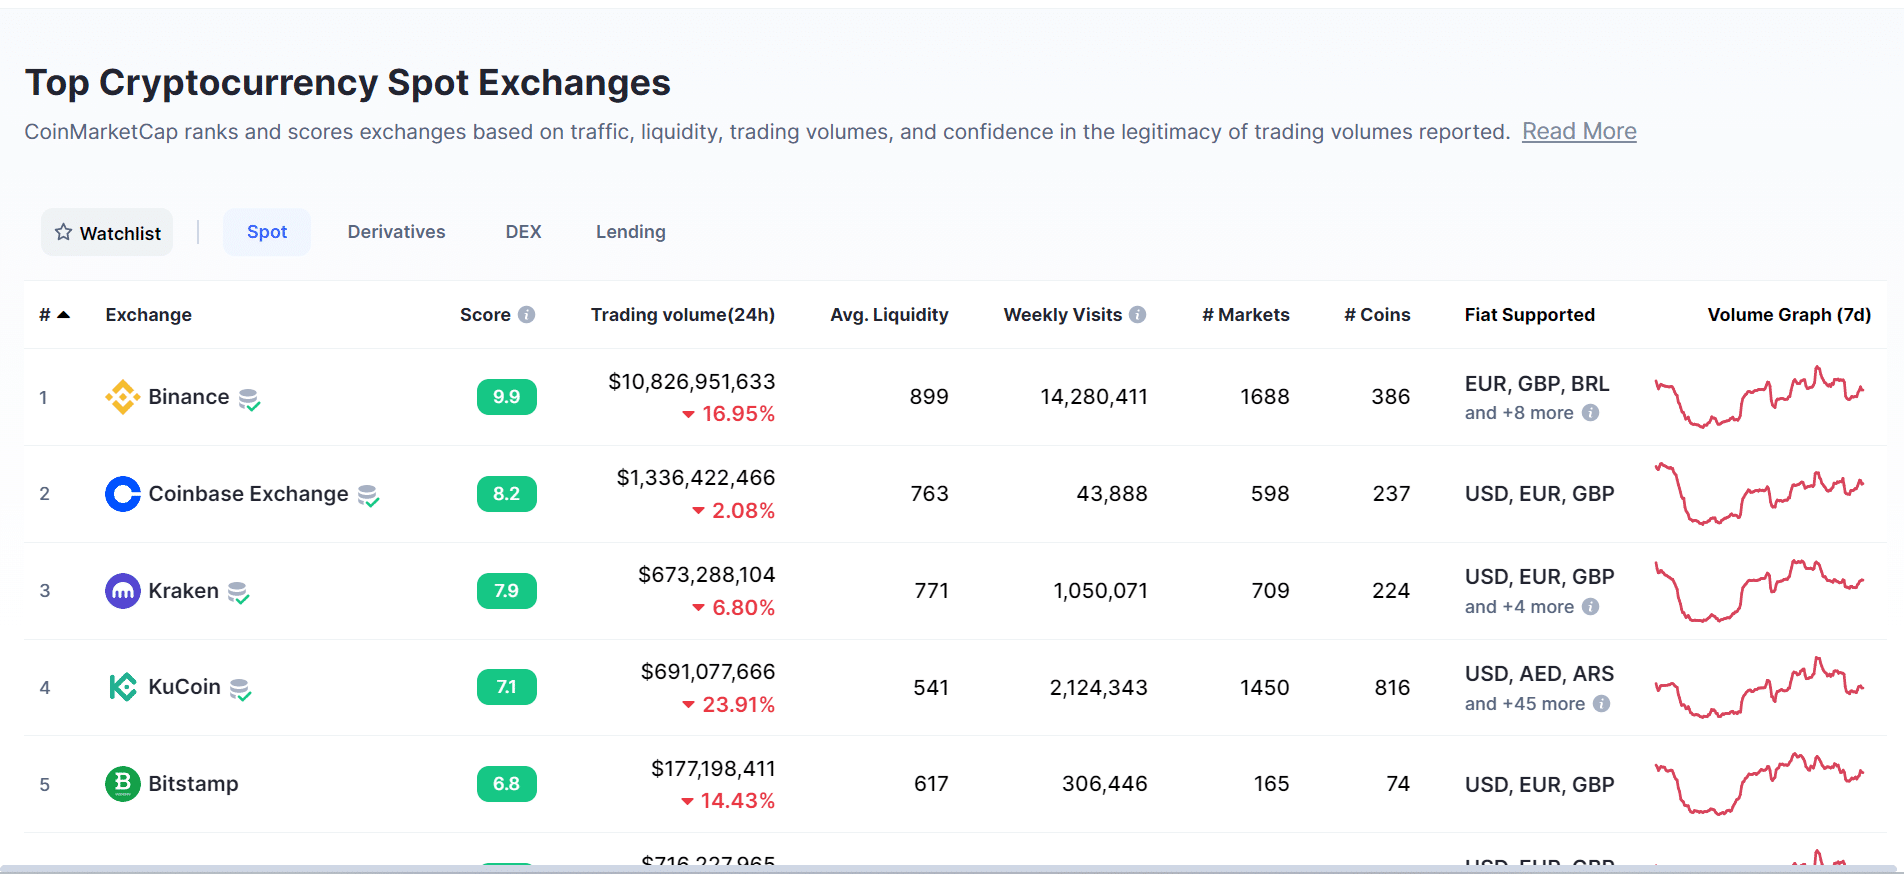
Based on CoinMarketCap’s data, a comparison between Binance and Coinbase revealed a stark contrast between the two exchanges. Looking at the 24-hour trading volume, Binance’s $11 billion dwarfed Coinbase’s $1 billion figure.
Binance also enjoyed a significantly larger number of weekly visits, with over 14 million compared to Coinbase’s meagre 43,000. Additionally, Binance offered more markets than Coinbase, further solidifying its status as a major player in the cryptocurrency exchange industry.
BNB chain transactions YTD
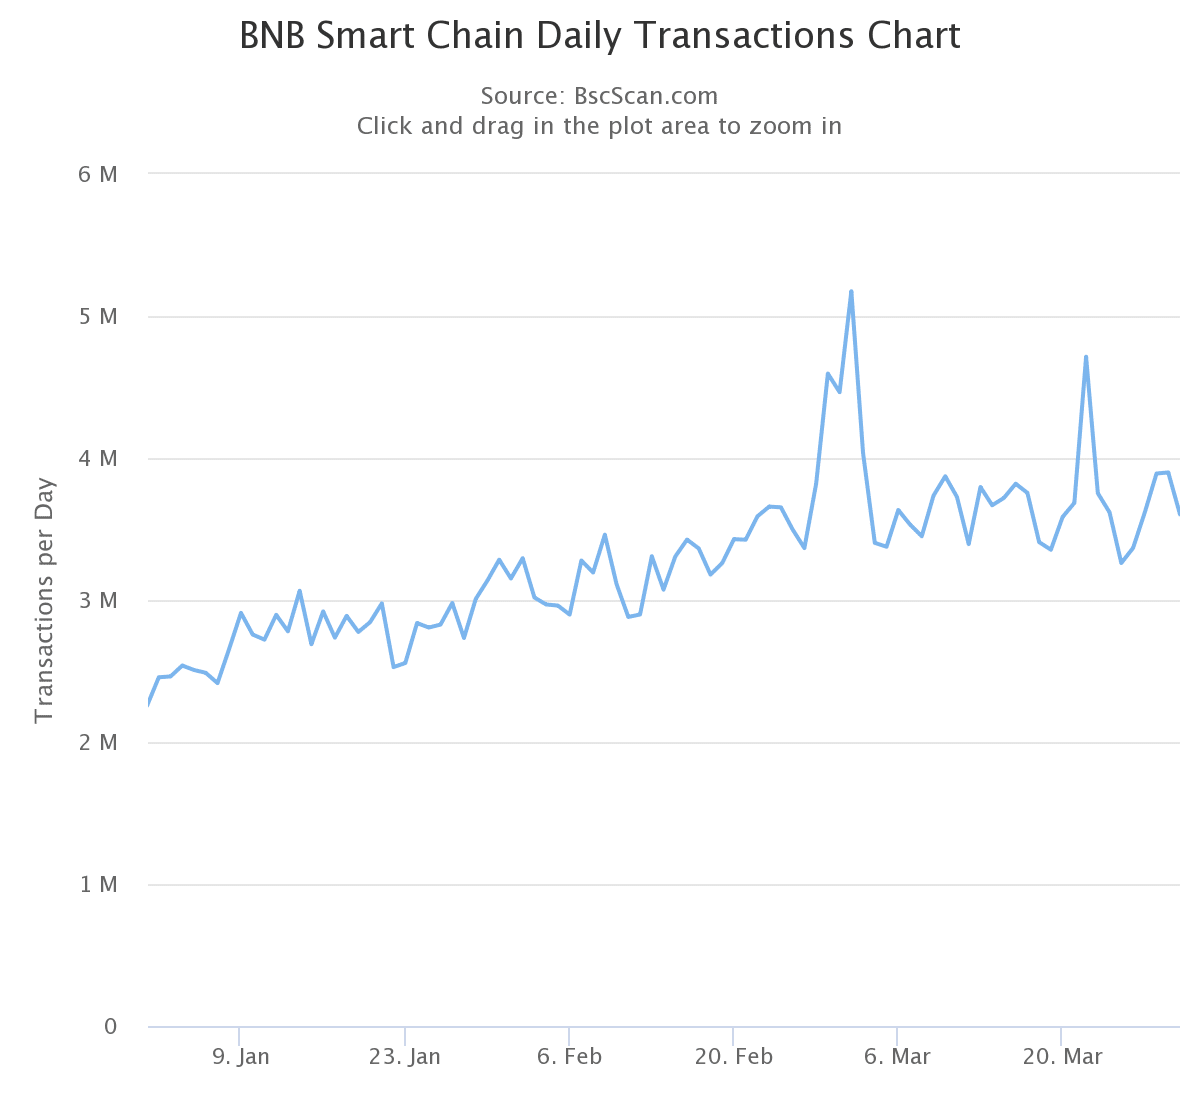
An upward trend can be seen when one takes a close look at the transaction history of the BNB Smart Chain [BSC] since January. Daily transactions in January and February were mostly under 3 million, but the figure consistently remained above the mark in March.
This indicated a rise in volume on the chain, despite the recent Fear, Uncertainty, and Doubt (FUD) surrounding the exchange.
While the surge in transactions on the BNB Smart Chain could be attributed to several factors, it was still a clear indication of increased activity on the network.
BNB on a daily timeframe
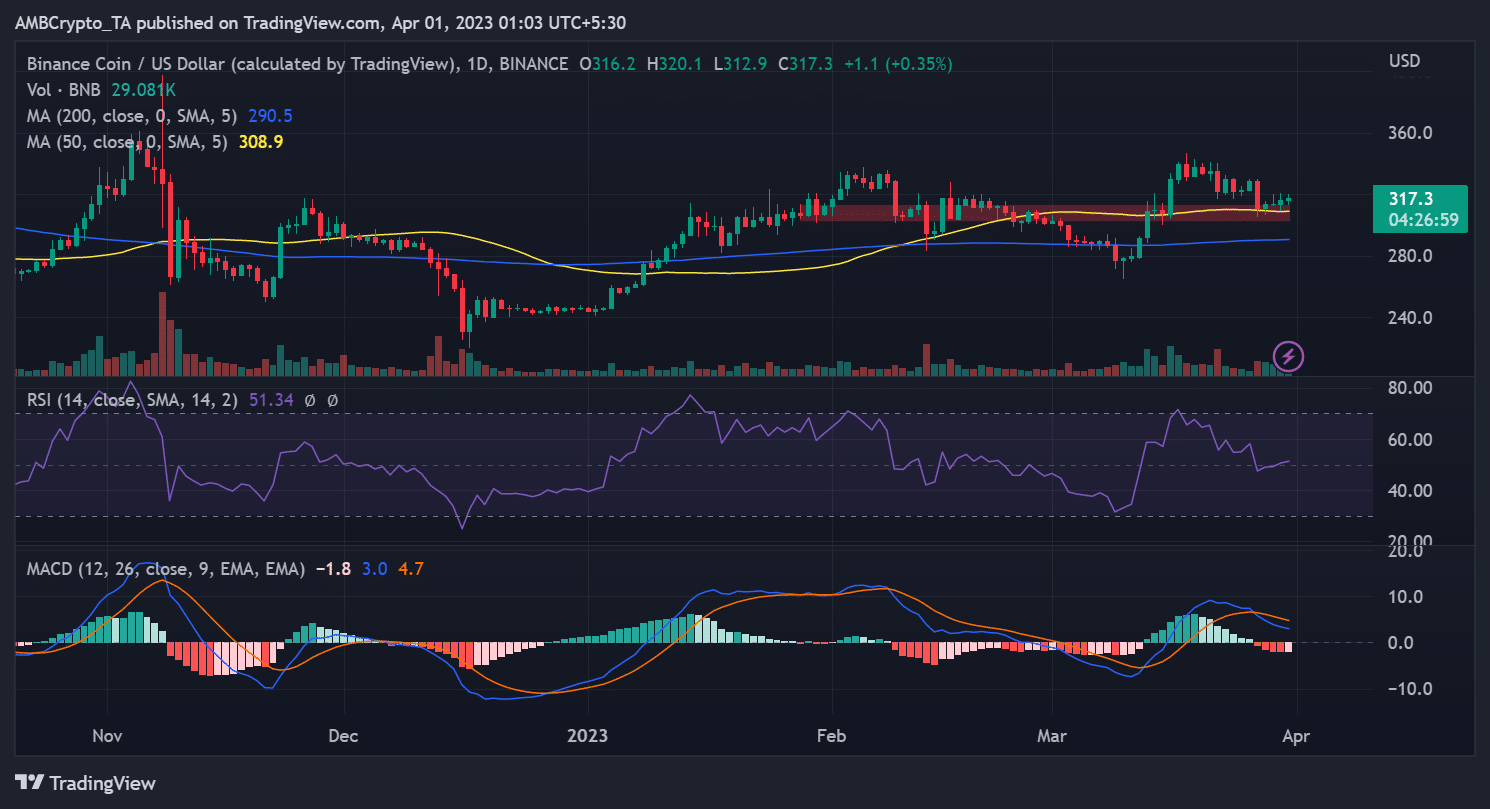
As of this writing, BNB was attempting to recover on a daily timeframe. The chart showed that it had been experiencing gains of less than 1% over the past three days.
How much are 1,10,100 BNBs worth today?
It was trading at around $317 with a gain of less than 1% at press time. The slight increase indicated a tug of war between buyers and sellers, as both sides fought for market control.
Following its modest gains over the past four days, BNB has shifted towards a slightly bullish trend. As of this writing, the Relative Strength Index (RSI) line was slightly above the neutral line, indicating the coin could begin an upward swing.


