
- Analysts predicted that Bitcoin’s price could reach $107K before a major sell-off, which could cause a fall to $50K.
- Regardless, analysts remained optimistic about Bitcoin’s long-term potential.
Despite a recent decline in Bitcoin’s [BTC] price, analysts remained optimistic about its long-term potential. At press time, Bitcoin was priced at $63,986.45, with a 24-hour trading volume of $25,273,209,651.
This reflected a -1.28% price decline in the last 24 hours but an 11.93% price increase over the past seven days.
Analyst predictions
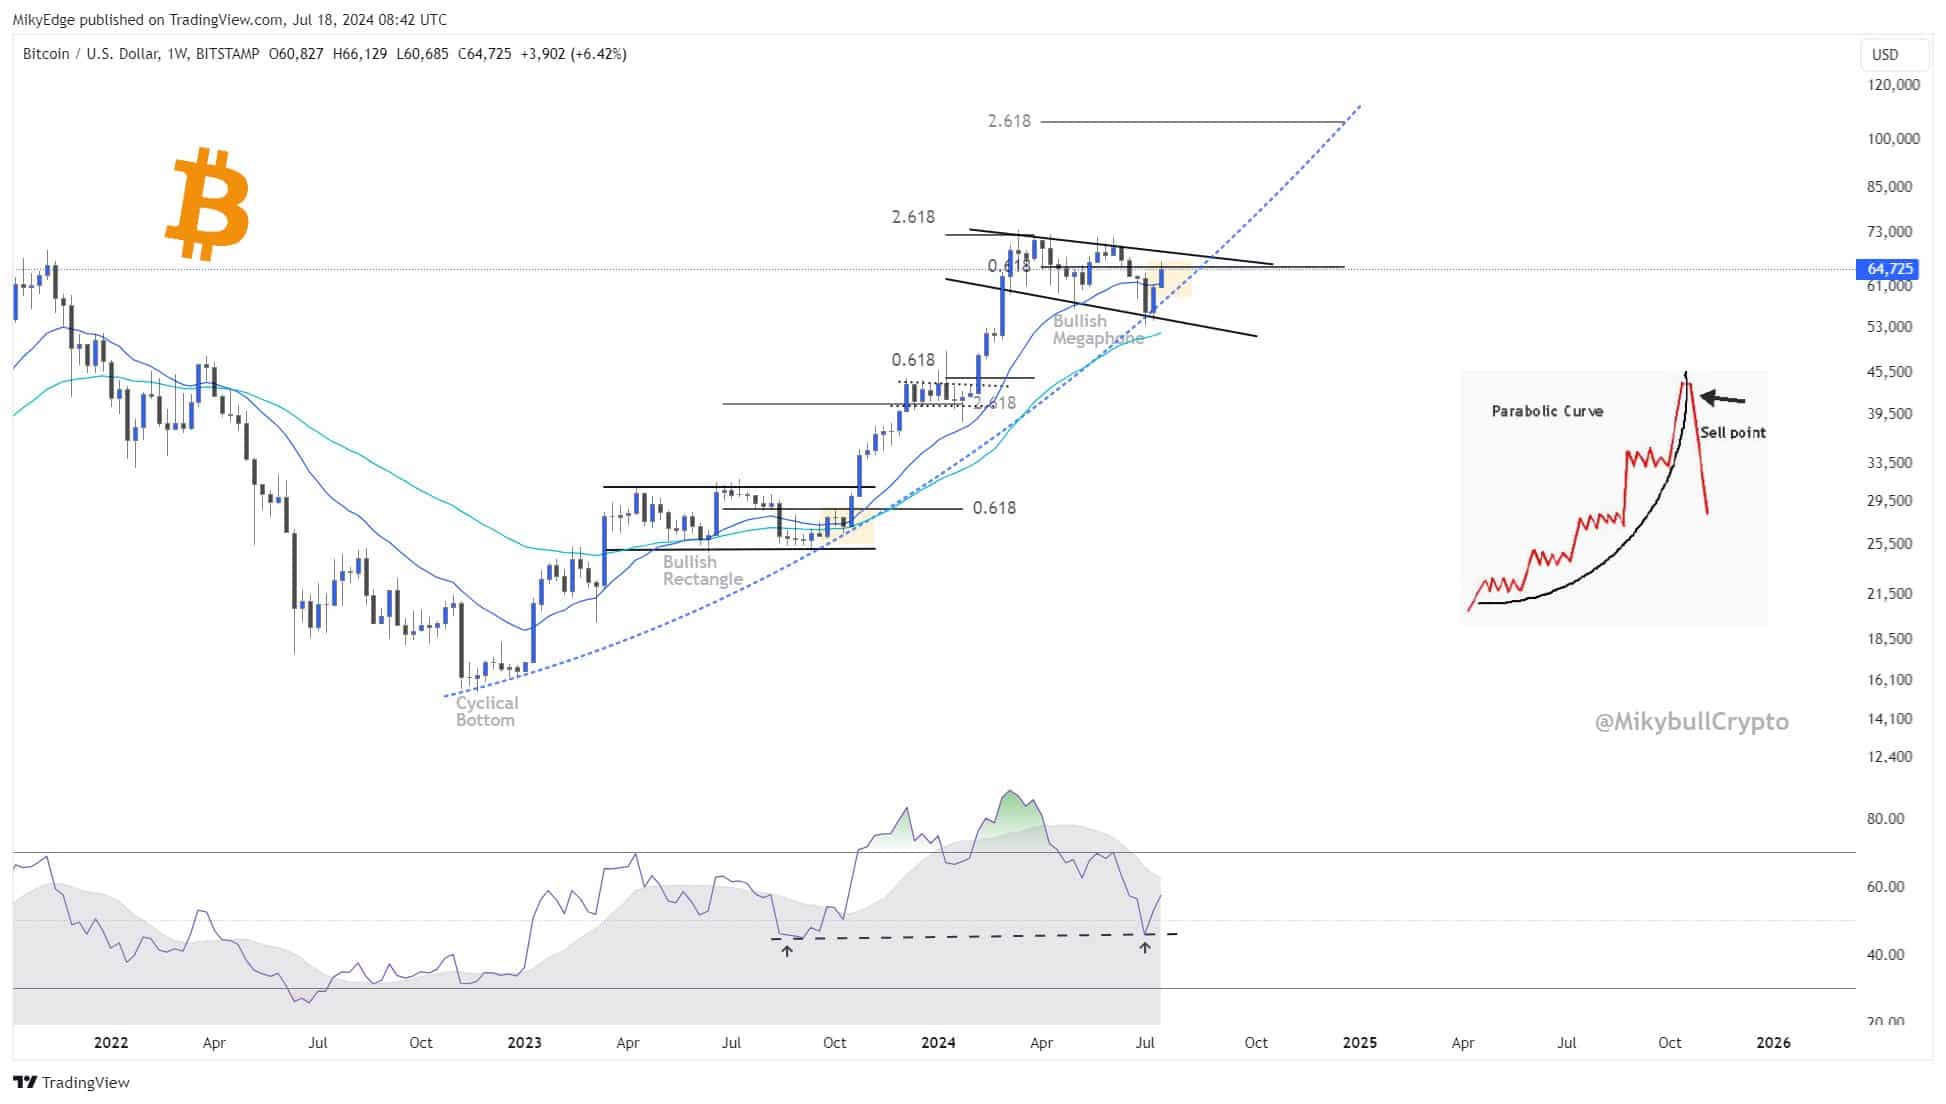
Mikybull Crypto noted on X (formerly Twitter) that Bitcoin’s conservative parabolic curve target stood at $107,000 before a massive sell-off to $50,000.
He stated,
“I don’t know how this is going to happen but I simply follow what the chart tells me rather than emotion.”
Source: X
CryptoCon, another analyst, noted,
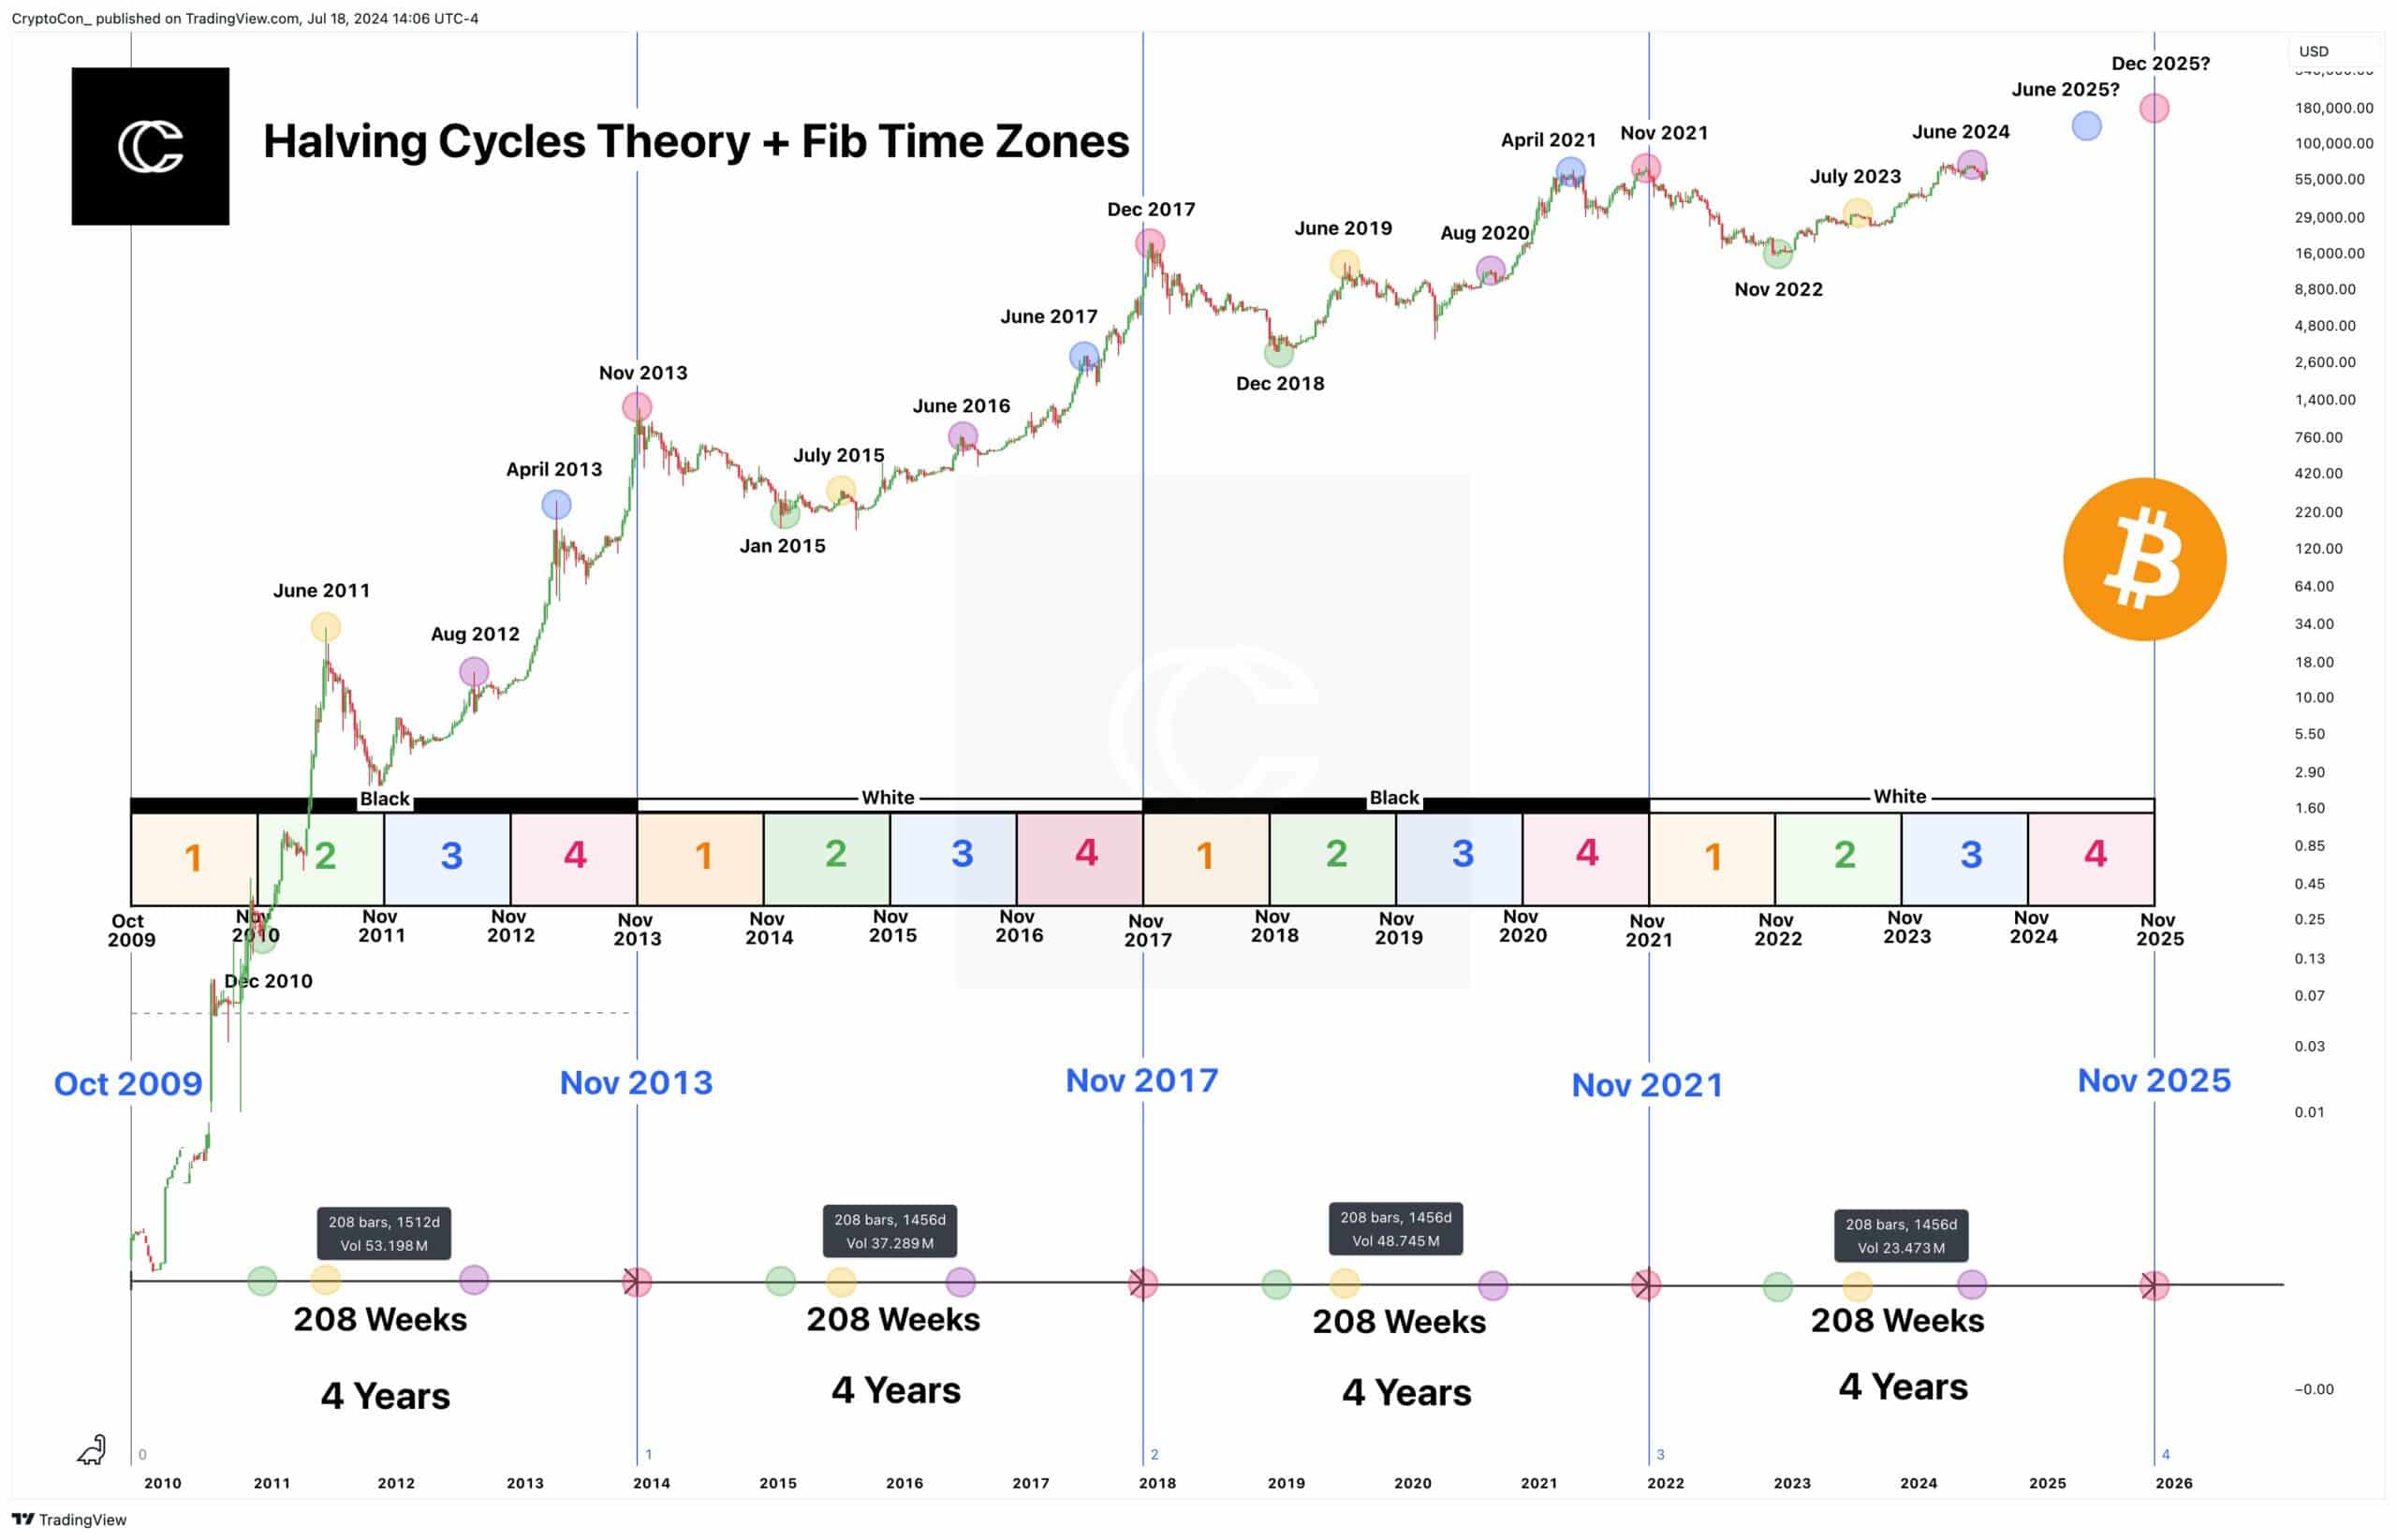
“Although there are still signs of acceleration in the #Bitcoin cycles, I sincerely hope original timing finds its way back. Perfect 4-year cycles since inception, 208 weeks exactly.”
CryptoCon noted that the March 2024 high was an early deviation, resulting in a lower high in June. Despite these variations, he believed that the long-term cycle patterns would persist.
The analyst further highlighted the potential for Bitcoin to follow historical patterns, citing BitTime and The Halving Cycles Theory, which predicted a first top in June 2025 and a final top in December 2025.
He noted,
“As much as I love the Halving Cycles Theory, I am prepared for anything.”
Source: X
Bitcoin technical analysis
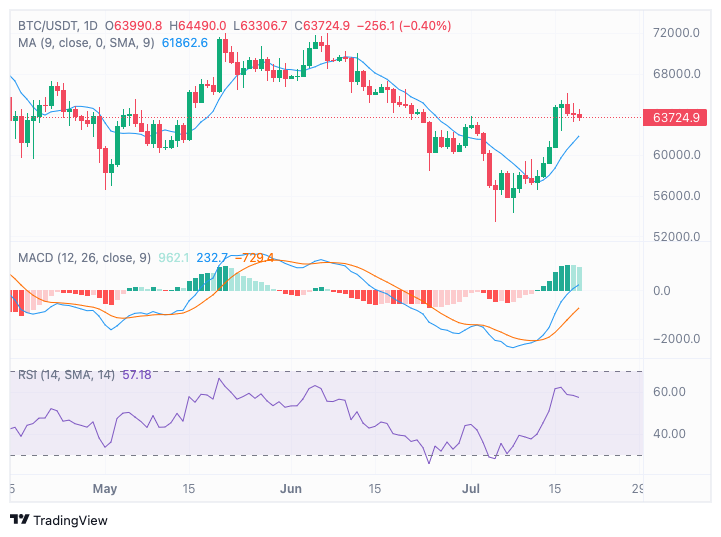
AMBCrypto’s look at the BTC/USDT 1-day chart from TradingView revealed that the 9-day moving average (MA) was acting as a support level around $61,891.7 at press time.
The recent price increase from mid-June lows suggested a potential continuation of the bullish trend.
Bitcoin’s price moving above the 9-day MA indicated positive short-term momentum.
Source: TradingView
The MACD (Moving Average Convergence Divergence) indicator showed a bullish crossover, with the MACD line above the signal line, reinforcing the upward momentum.
The histogram’s positive territory further confirmed this bullish sentiment, suggesting that buying pressure might continue, potentially pushing prices higher.
At press time, the Relative Strength Index (RSI) stood at 58.19, placing Bitcoin in a neutral zone but edging closer to overbought territory.
This suggested room for further upward movement, though traders should watch for potential overbought conditions.
Read Bitcoin’s [BTC] Price Prediction 2024-25
Decline in network activity
Meanwhile, active addresses have dropped from peaks above 500,000 in January to around 243,000 at press time.
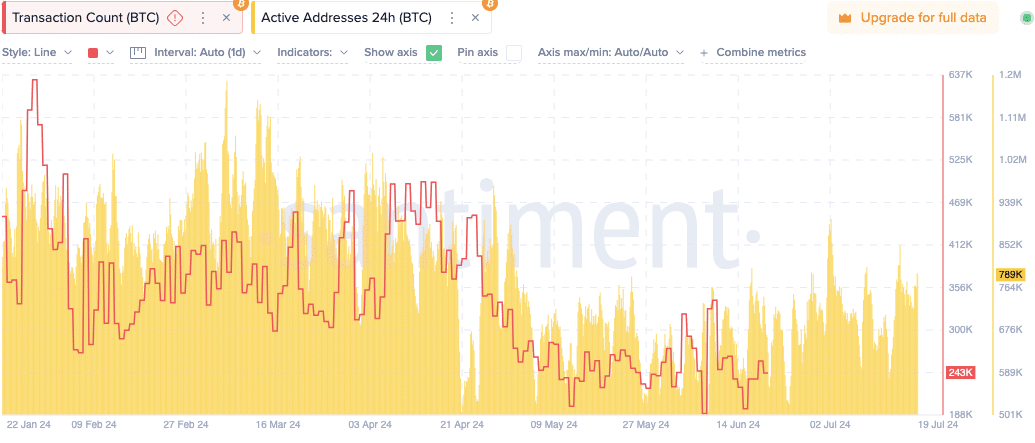
Source: Santiment
Similarly, transaction counts have decreased from over 1.1 million to approximately 796,000 during this period. This reduction suggested decreased engagement and activity on the Bitcoin network.