
SharpLink stakes big on Ethereum: Are institutions moving away from BTC?

- Bitcoin experienced a significant decline over the past month.
- The declining short-term Sharpe ratio left analysts eyeing a rebound.
Bitcoin [BTC], the largest cryptocurrency by market cap, has experienced a sustained decline over the past 30 days. However, the last 24 hours have seen the crypto make moderate gains.
As of this writing, it was trading at $58,820 after a 1.10% increase over the past day.
Prior to this, the king coin was in a declining trend, dropping by 6.32% over the past seven days. Equally, it has declined by 4.37% over the past month.
Despite the recent gains on daily charts, BTC remained 20% below its ATH of $73737 recorded earlier this year.
Despite the recent poor performance, key stakeholders including analysts remained optimistic about the crypto’s direction.
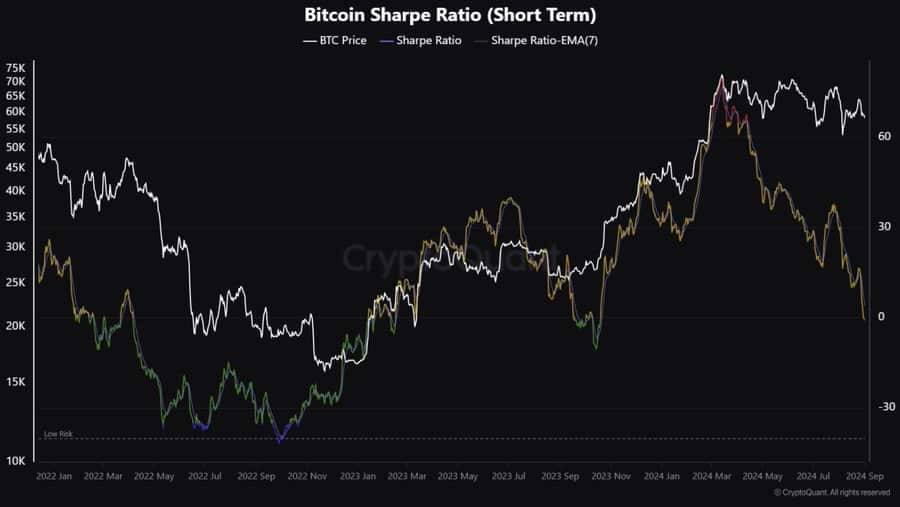
For instance, CryptoQuant analyst Kripto Mevsimi eyed a rebound from the recorded downside, citing short-term Sharpe ratios.
Market sentiment
In his analysis, Mevsimi cited the 2023 cycle, arguing that the current short-term Sharpe ratio mirrored the previous year’s cycle.
Source: X
During the previous cycle, when the short-term Sharpe ratio declined, BTC prices surged from a low of $26675 to a high of $35137.
Based on this historical performance, those who are bullish view it as a possible rebound signal.
However, the analyst provided a contrary view for bearish investors, positing that a bearish interpretation may indicate a sustained volatility.
In totality, a declining short-term Sharpe ratio implied increased volatility without a proportional increase in investment returns, thus making investments less attractive.
If the analysis is purely based on the historical cycle in relation to the short-term Sharpe ratio, BTC might rebound.
Accordingly, this bullish assessment is further strengthened by Santiment’s analysis, which posited that BTC was performing well without relying on S&P 500, suggesting independence from equities.
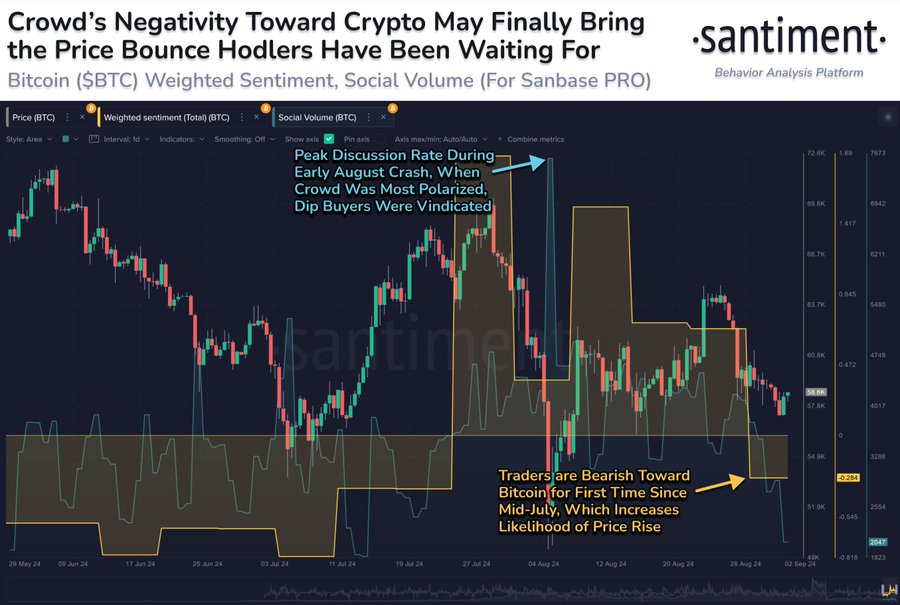
Source: Santiment
What BTC’s charts suggest
This analysis provided a positive outlook for future price movement. Therefore, it’s essential to understand what other indicators suggest.
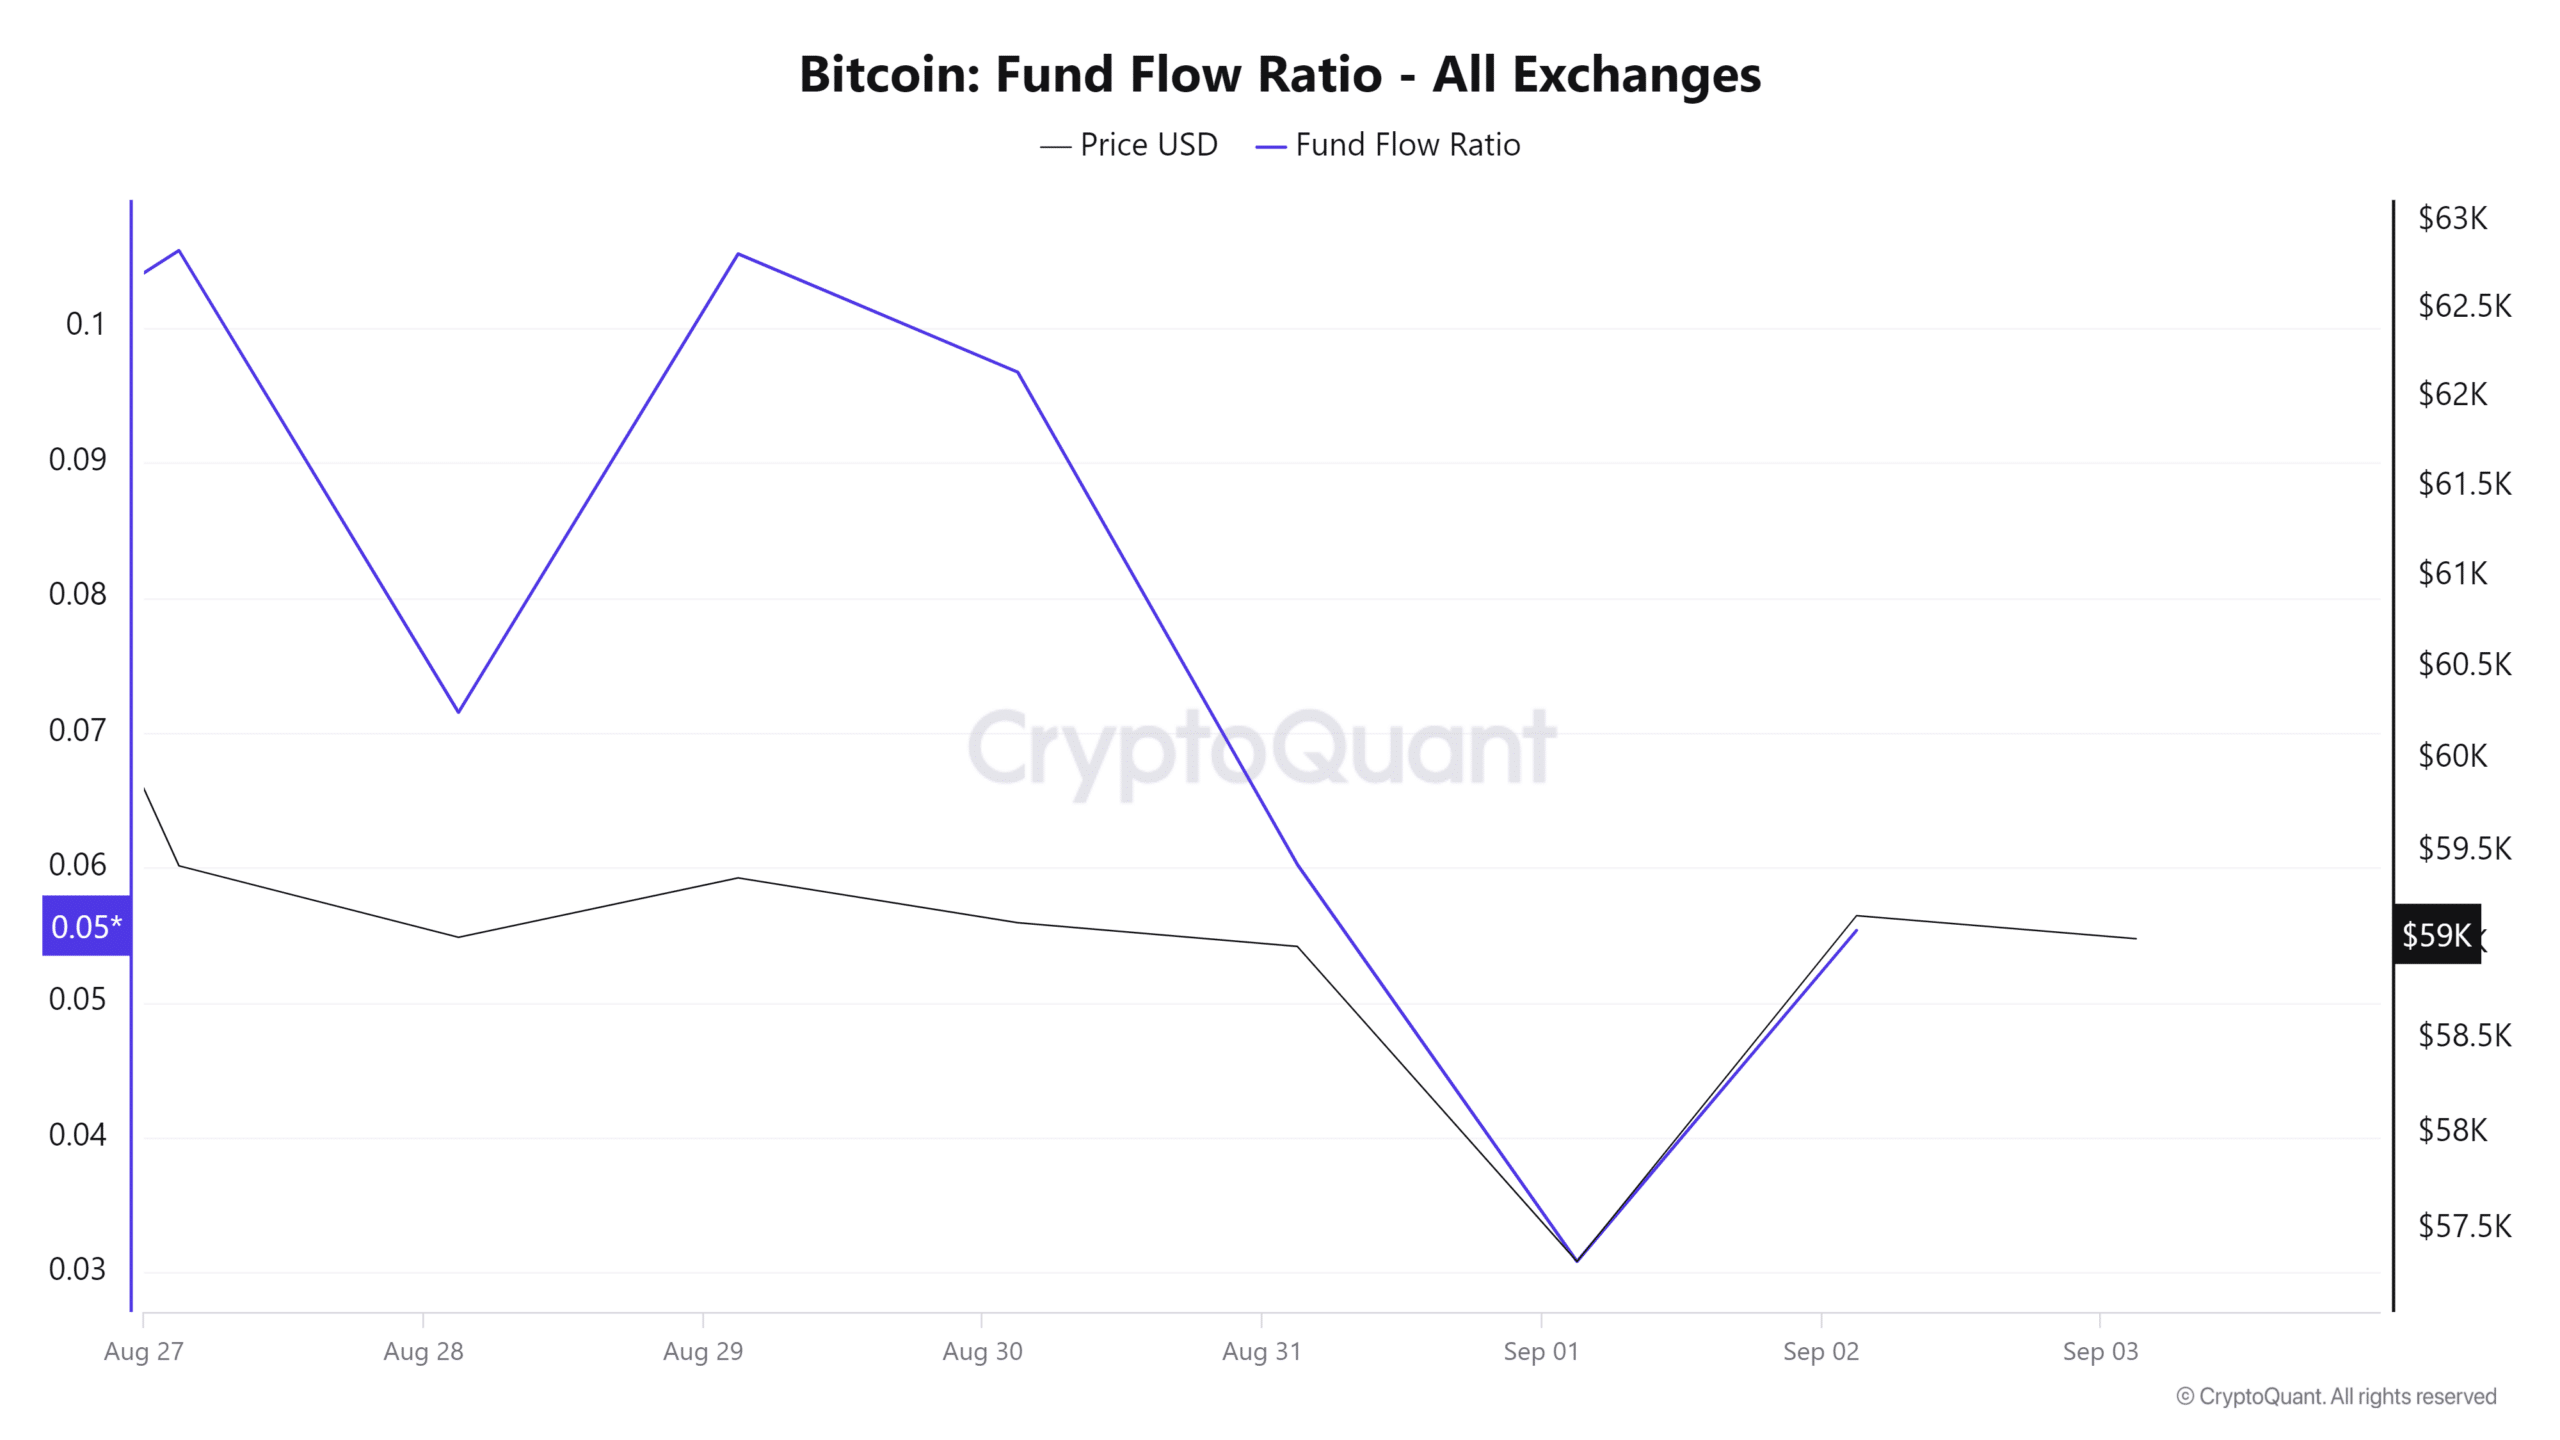
Source: CryptoQuant
For starters, Bitcoin’s Fund Flow Ratio declined over the past seven days. A decline in the fund flow ratio implied that investors were choosing to HODL their assets rather than sell.
This signaled long-term confidence, with investors keeping their funds in cold storage rather than exchanges. Such market behavior results in accumulation in anticipation of the future price increase.
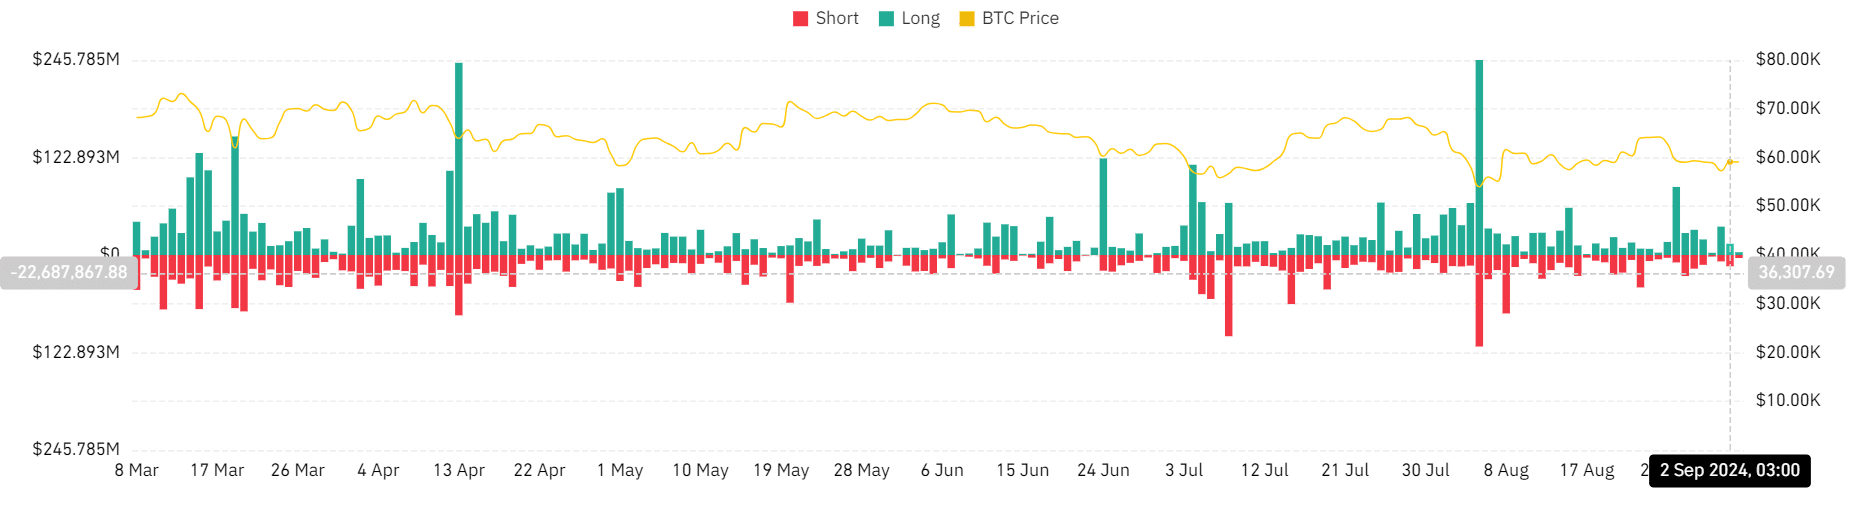
Source: Coinglass
Additionally, BTC’s liquidation has reduced over the past three days. Long position has declined from $35.7 million to $3.4 million at press time.
This showed investor confidence in long-term price increases, as they were willing to pay a premium to hold these positions.
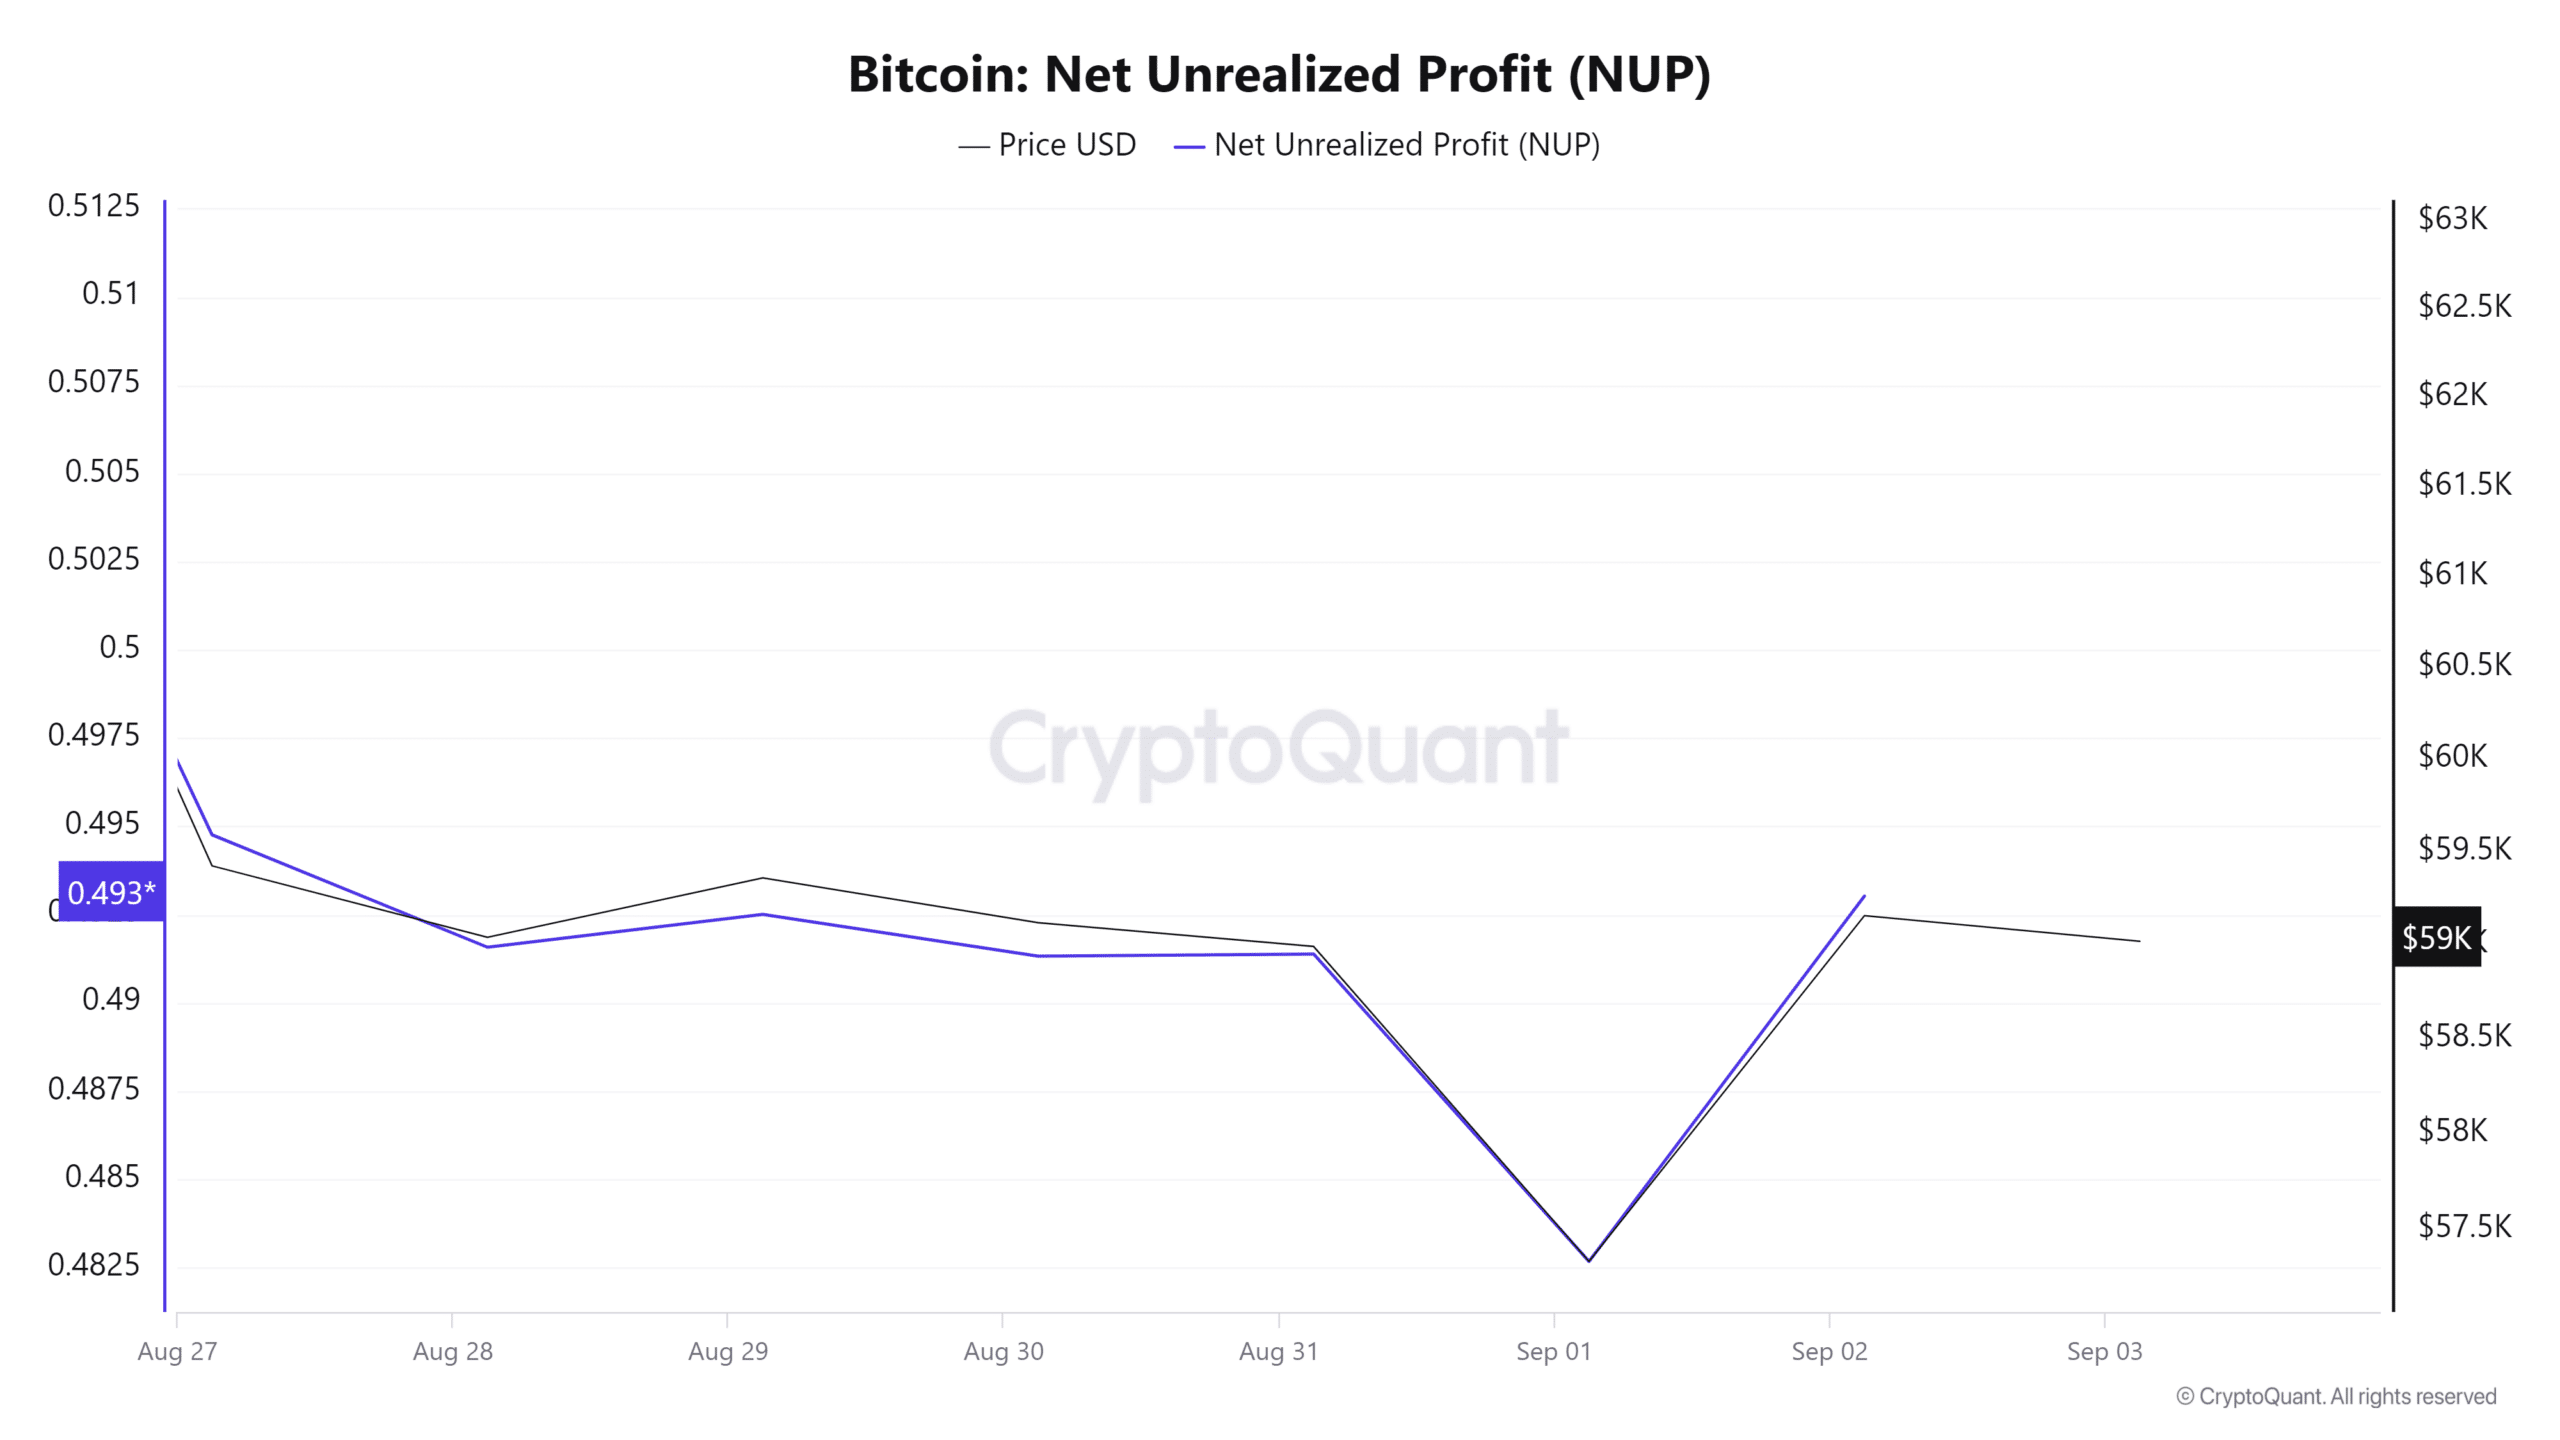
Source: CryptoQuant
Read Bitcoin’s [BTC] Price Prediction 2024–2025
Finally, BTC’s net unrealized profit was at 0.49, indicating that the prevailing market sentiment was optimistic. At this rate, although there was some profit-taking, it was unlikely to result in a major correction.
Therefore, if the prevailing market sentiment holds, BTC is well positioned to break out of the stubborn resistance level around $60k and challenge the $64,752 resistance level.


