


- The Bitcoin range formation of the past month remained in play.
- The on-chain metrics showed investors need not worry about a downtrend yet.
Bitcoin [BTC] saw a large amount of volatility on 3rd January as prices fell by 6.3% on the day. Despite the selling pressure, on-chain metrics such as the Net Unrealized Profit/Loss (NUPL) suggested that the market is in a healthy bullish state.
AMBCrypto recently reported that the Coinbase Premium was on the rise. It has been positive since September, with a brief drop into the negative territory in mid-December.
This was a sign of steady buying pressure on Coinbase. It sparked speculation of consistent buying activity from institutional investors ahead of a Bitcoin ETF approval.
AMBCrypto took a look at other metrics to understand where BTC stands.
Assessing the available ammunition for the bulls
The Coinbase Premium Gap has been positive for most of the time since October. It dipped into the negative territory in mid-December. Its inference has already been mentioned, but it can be combined with other metrics to provide keener insight.
One such metric is the Stablecoin Supply Ratio. It is defined as the market cap of BTC divided by the total market cap of all stablecoins. A low value for this metric indicates high buying power.

The chart above shows that the ratio has spiked since early October. This meant buying power has been declining. The strong demand for BTC, not just on Coinbase but across exchanges, saw the king coin rally from $26k in October to reach $44k in December.
The metric seemed to hit a ceiling over the past month. This was a sign that market participants could be watching and waiting. The ETF applications and debate over their approval and the impact on BTC prices could be causing this indecision.
The NUPL hit a high not seen since December 2021, but investors need not fear
On 5th December 2023, the Bitcoin NUPL climbed above 0.5. The last time this happened was back on 27th December 2021. This does not mean a reversal is around the corner. Instead, the market is neither in a state of euphoria nor despair.

The NUPL has formed a plateau over the past month. This is tied to the price action of the asset as well, for BTC was unable to continue its uptrend in recent months. An increase in BTC inflows to exchanges was part of the reason.
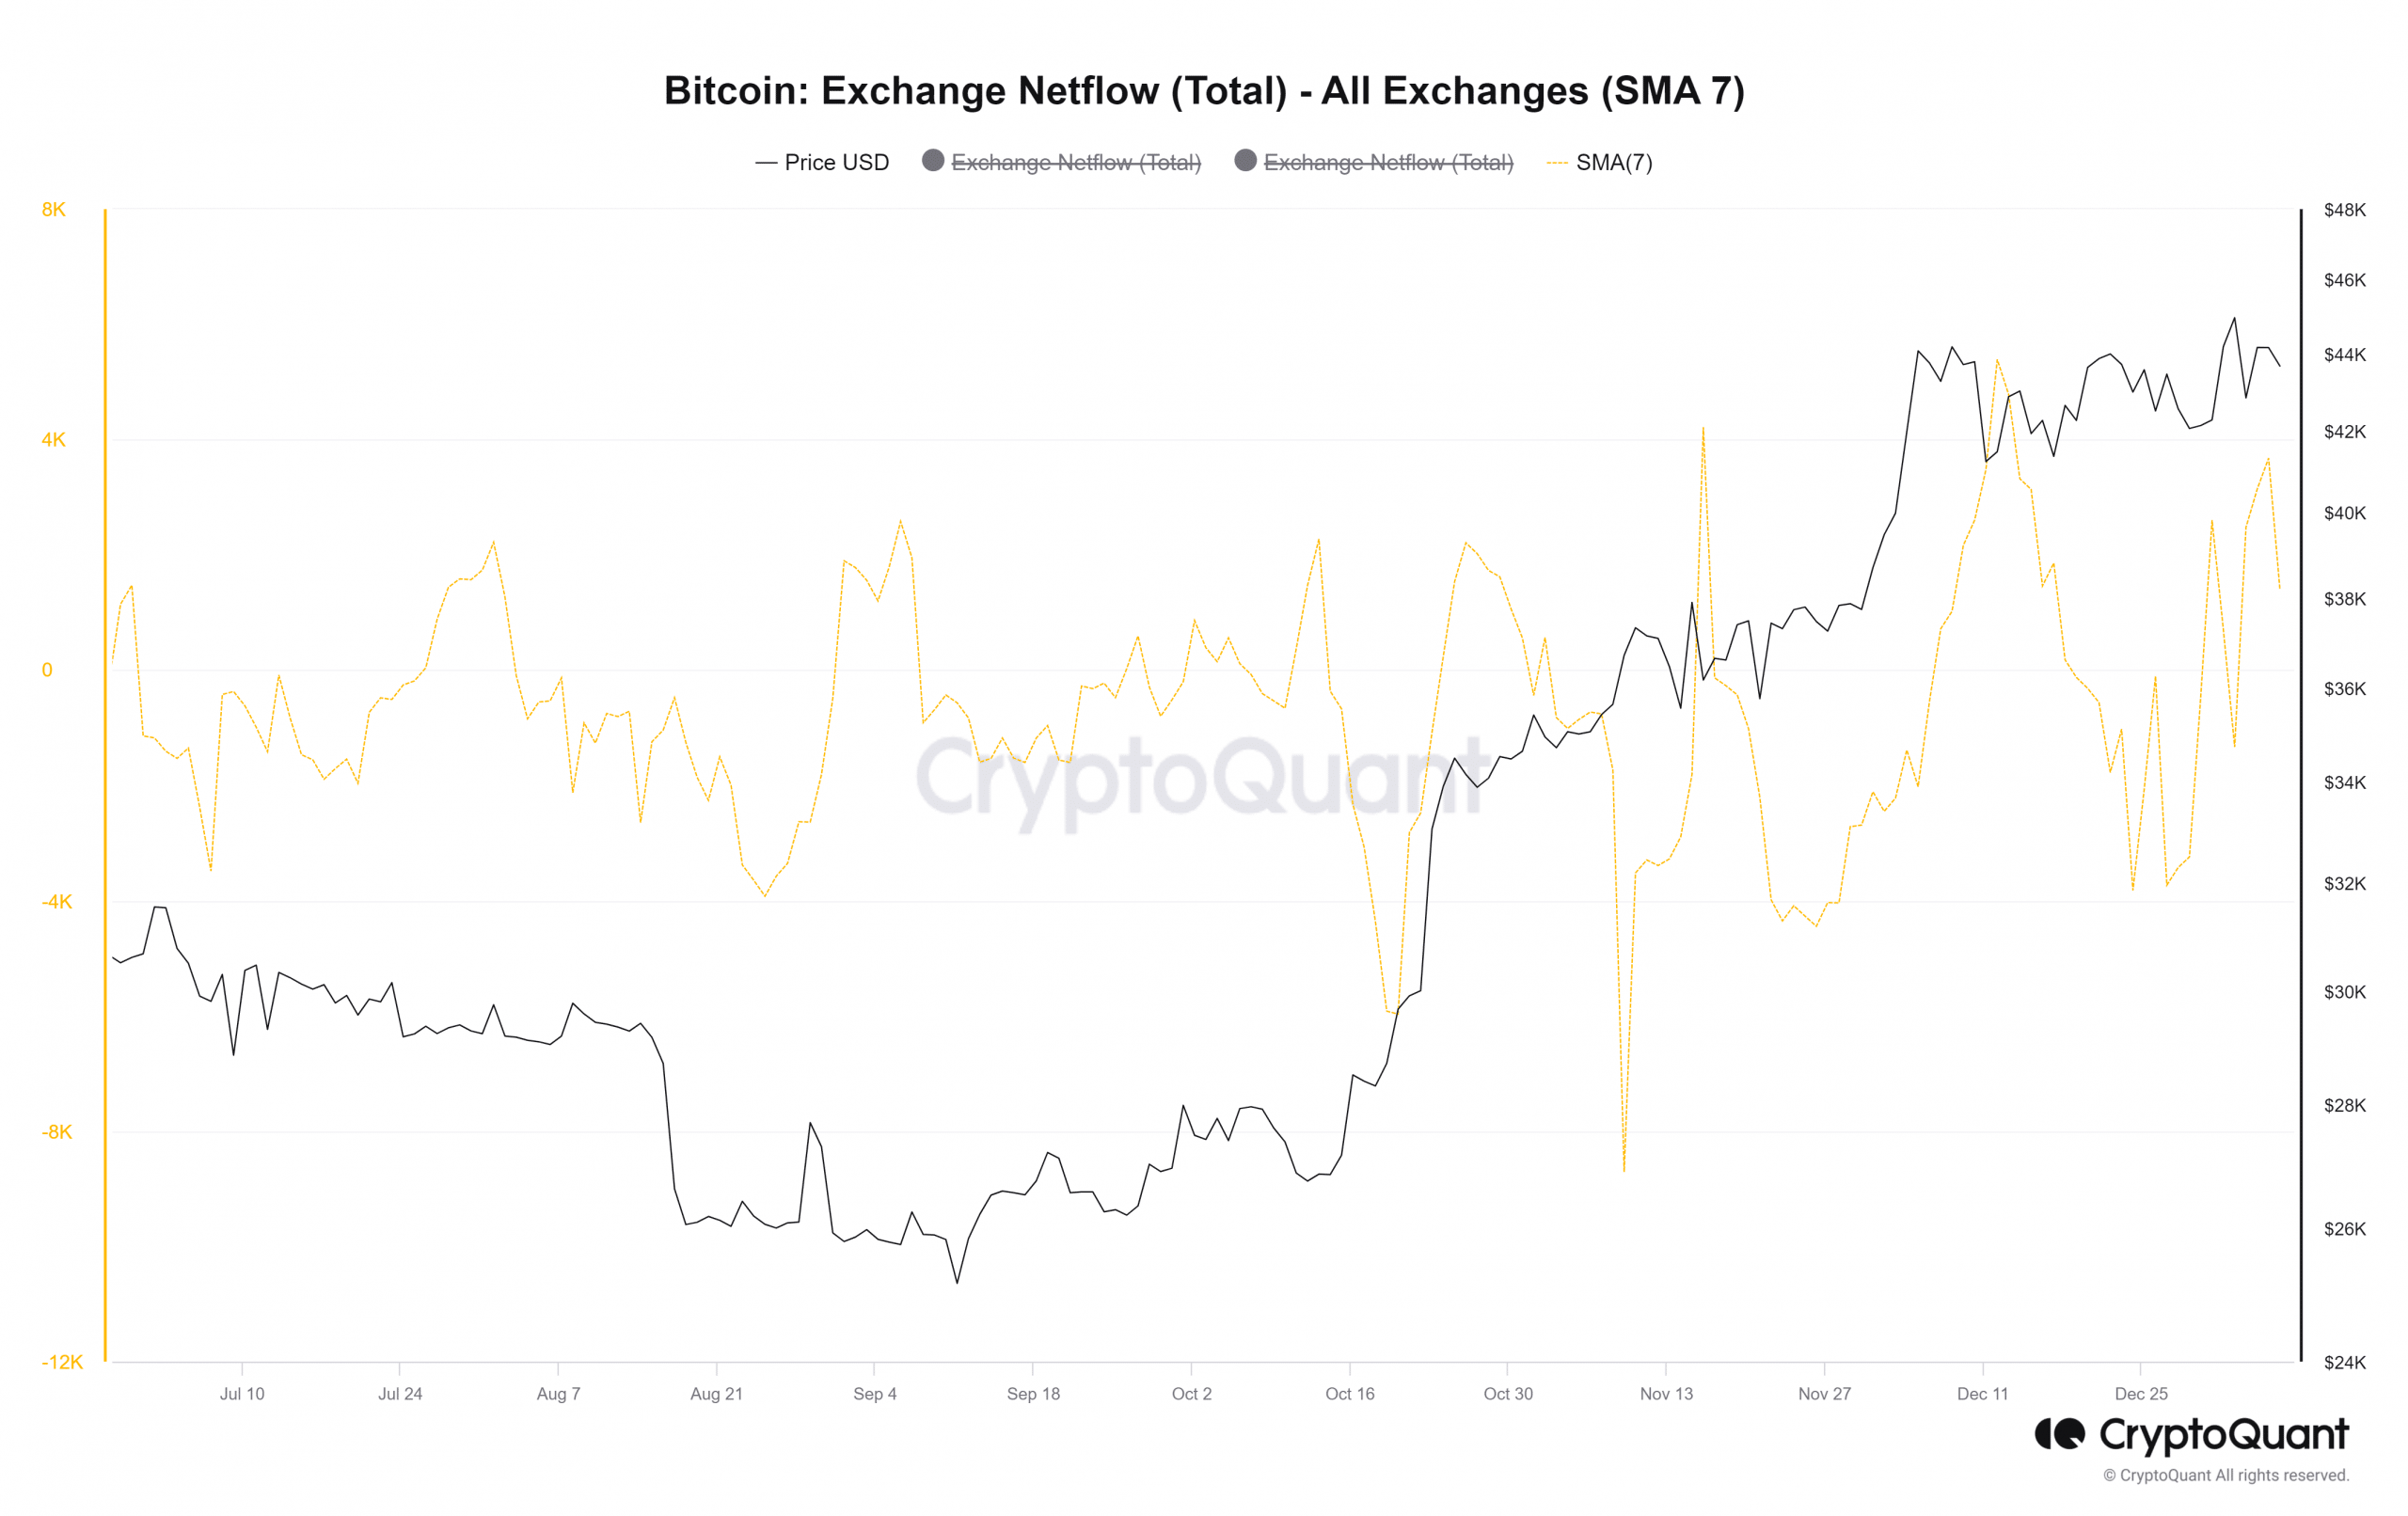
The past five days saw a rise in the 7-day Simple Moving Average of the Bitcoin Netflow. This meant that reserves on exchanges were increasing, even as BTC prices straddled the range highs. Hence, this metric’s continued rise would be useful to monitor.
The same uptrend happened in mid-December as well. This saw Bitcoin fall from $43k to $40.5k. The range formation of Bitcoin is also something investors and traders must keep an eye on.

The range (purple) has been in play since 11th December. It extended from $40.5k to $44.3k. The breakout on 2 January appeared clean, and a retest of the highs would have been a good buying opportunity.
Instead, Bitcoin dropped like a rock to $40.7k on 3rd January. Since then, it has rebounded to the $43.6k mark. The OBV has been in a gradual decline since 11th December.
Read Bitcoin’s [BTC] Price Prediction 2023-24
Attempts to revive an uptrend on the OBV have been cut short. This suggested a lack of buying volume. The RSI was at 51 to signal a possible shift in the momentum in favor of the sellers.
Hence, BTC holders must be prepared for a drop to the range lows and potentially far lower. Key levels to watch for the coming week are the mid-range mark at $42.5k and the recent highs at $45.9k.