
- Bitcoin’s price was about to reach a crucial support level.
- Most metrics hinted at a price increase soon.
Bitcoin [BTC] witnessed a price correction in the last 24 hours. A major reason behind this could be the rise in liquidation.
Nonetheless, BTC was approaching a crucial support level from which it could make a trend reversal in the coming days or weeks.
Why Bitcoin is down
CoinMarketCap’s data revealed that BTC was down by more than 3% in the last 24 hours. At the time of writing, BTC was trading at $60,862.71 with a market capitalization of over $1.2 trillion.
Ali, a popular crypto analyst, recently posted a tweet revealing a possible reason behind this downtrend. As per the tweet, BTC’s liquidation rose sharply near the $61,490 mark.
Whenever liquidation rises, it increases the chances of a price correction. Therefore, investors might have chosen to exit their positions after hitting that level.
This recent price decline has pushed BTC down towards a critical support level.
AMBCrypto’s analysis of the coin’s daily chart revealed a widening, falling wedge pattern. If the downturn continues, then investors might witness BTC dropping to $60,078.
At that point, BTC would have a chance to rebound. If that happens, then the king of cryptos’ price might gain bullish momentum and reach $71k in the coming weeks or months.
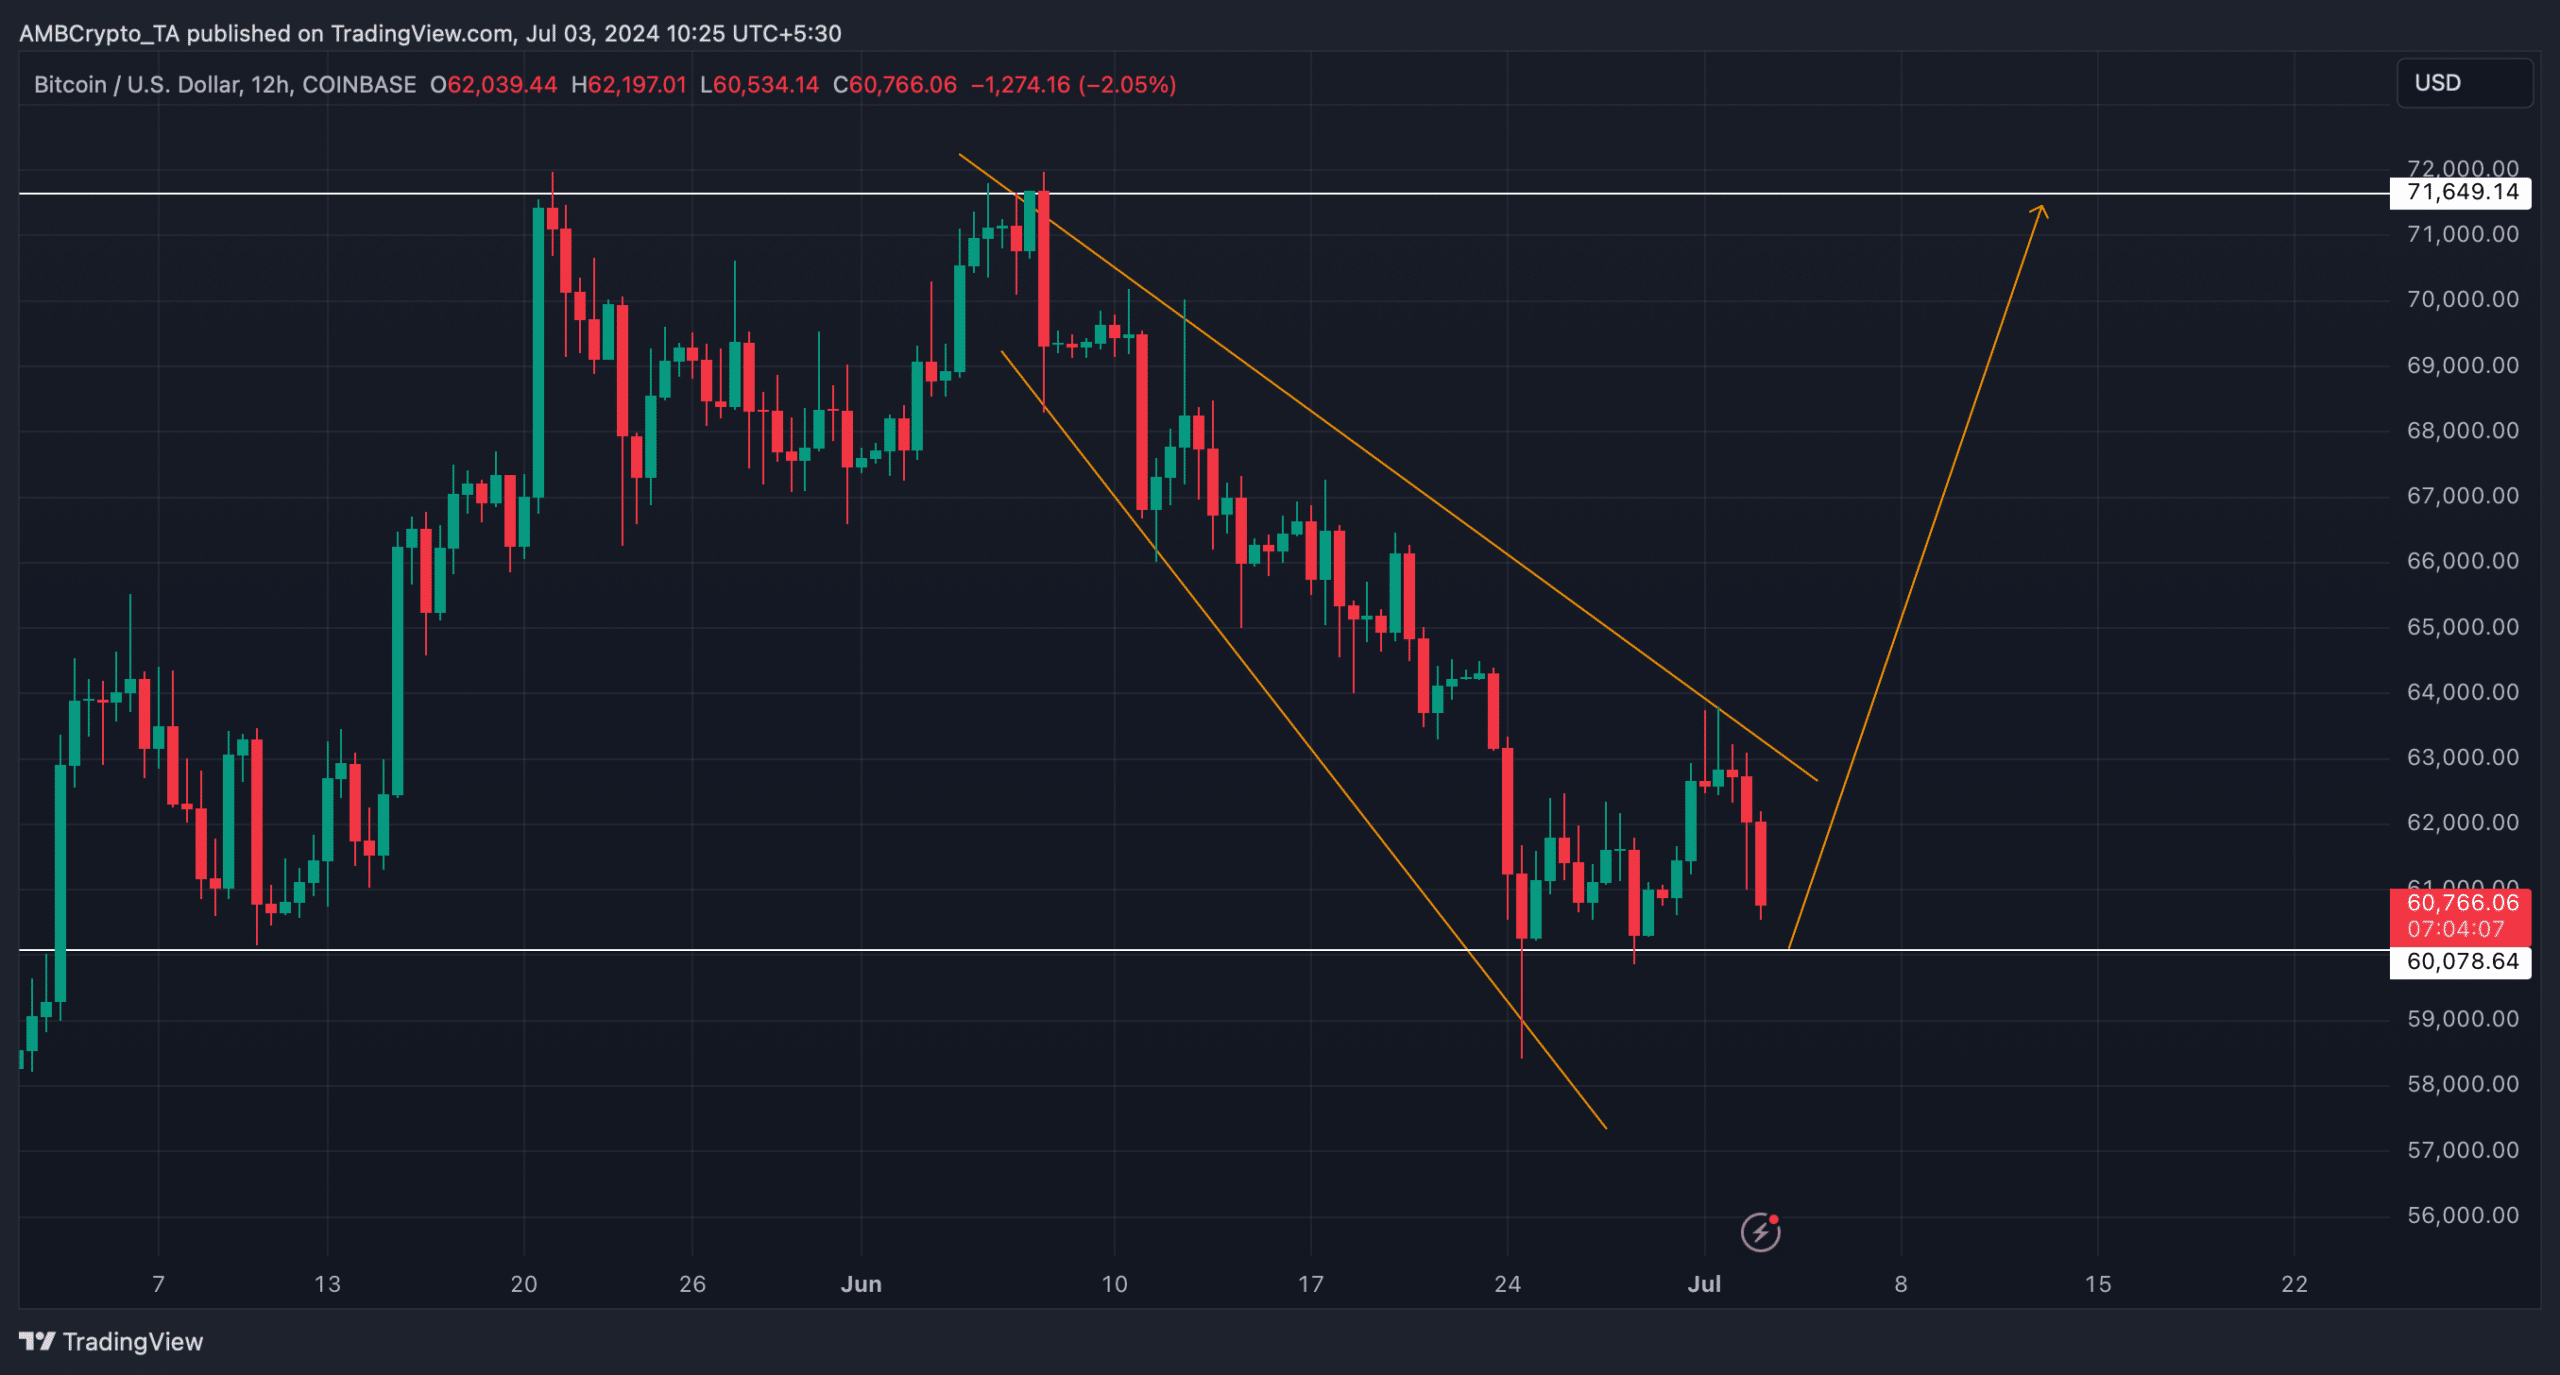
Source: TradingView
Will BTC rebound soon?
AMBCrypto then planned to take a look at the king coin’s on-chain data to see whether the coin was ready for a rebound. Our analysis of Glassnode’s data revealed a bullish metric.
Notably, BTC’s Pi Cycle Top indicators pointed out that BTC’s price was trading below its possible market bottom. If that’s true, then BTC might turn bullish soon.
For the uninitiated, the Pi Cycle indicator is composed of the 111-day moving average (111SMA) and a 2-times multiple of the 350-day moving average (350 SMA x 2) of Bitcoin’s price.
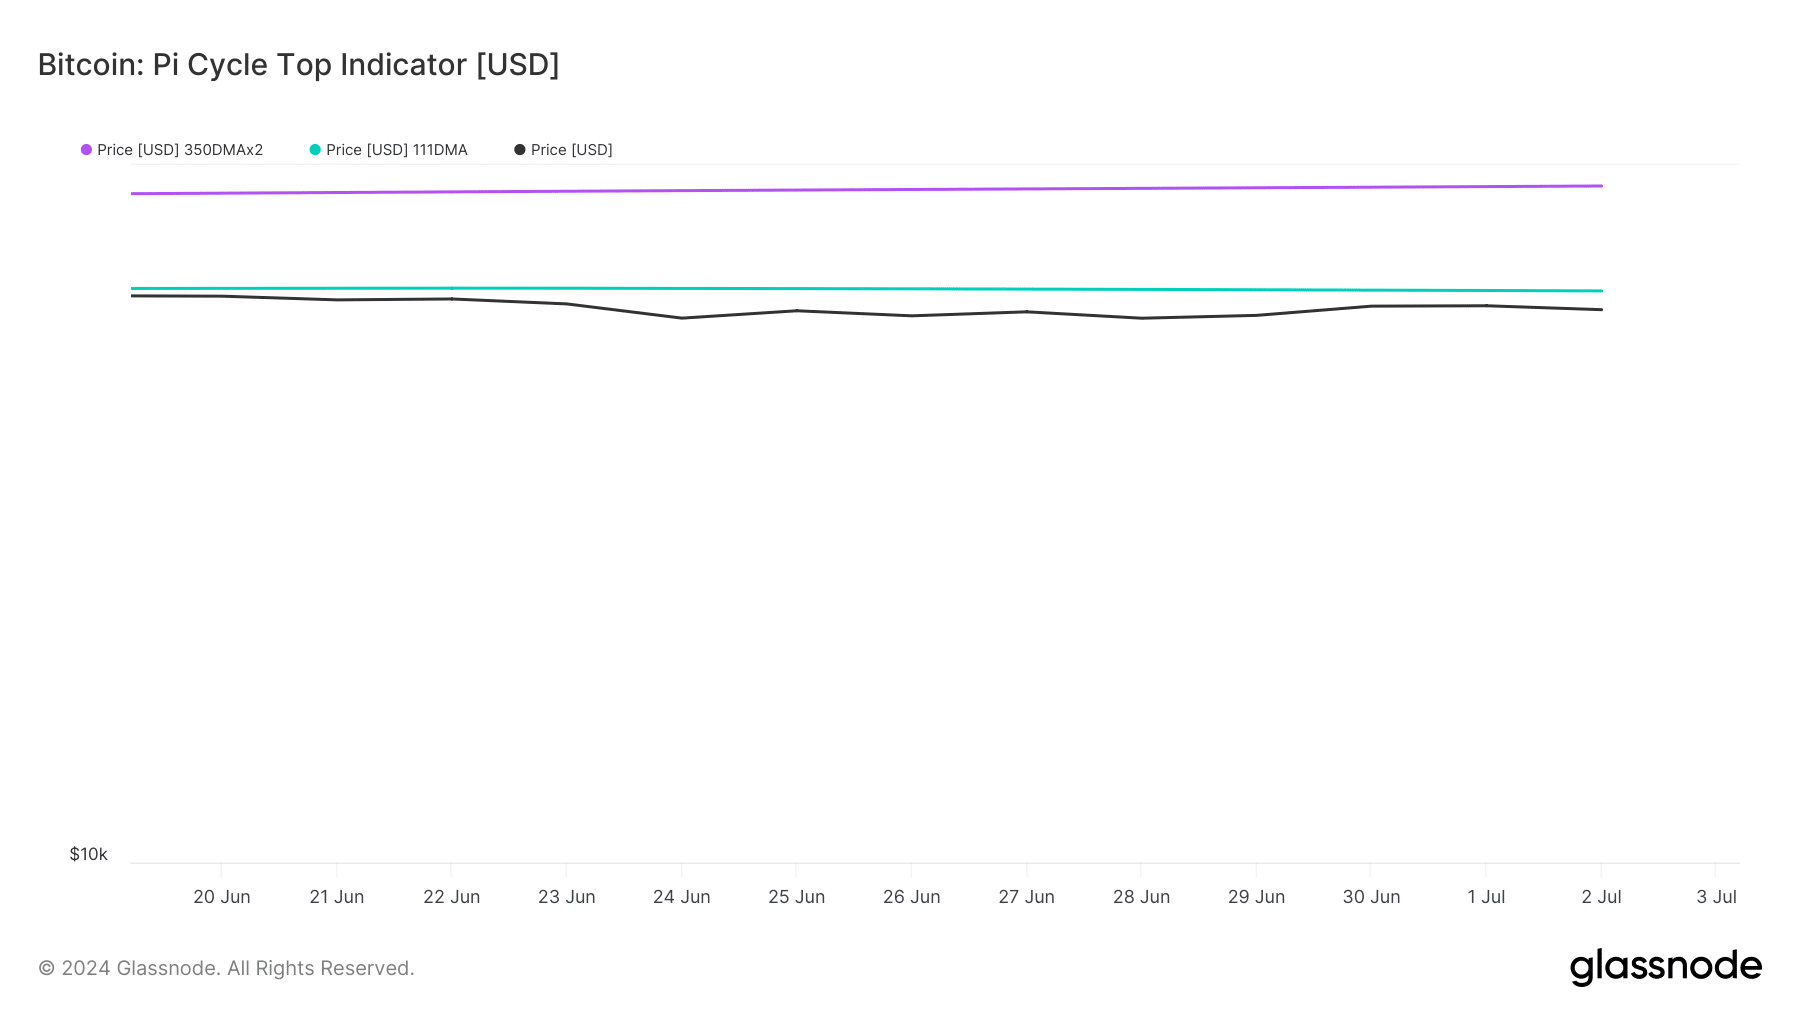
Source: Glassnode
In fact, as per CryptoQuant’s data, BTC’s net deposit on exchanges was low compared to the last seven days’ average. This clearly meant that selling pressure on BTC was low, which usually results in price upticks.
BTC’s Binary CDD was also in the green, meaning that long-term holders’ movements in the last seven days were lower than average. They have a motive to hold their coins.
Things in the derivatives market also looked good, as BTC’s Funding Rate was rising.

Source: CryptoQuant
Read Bitcoin’s [BTC] Price Prediction 2024-25
The Chaikin Money Flow (CMF) also registered a slight uptick, which suggested that the chances of a price increase were high.
However, the Relative Strength Index (RSI) supported the bears as it plummeted sharply at press time.
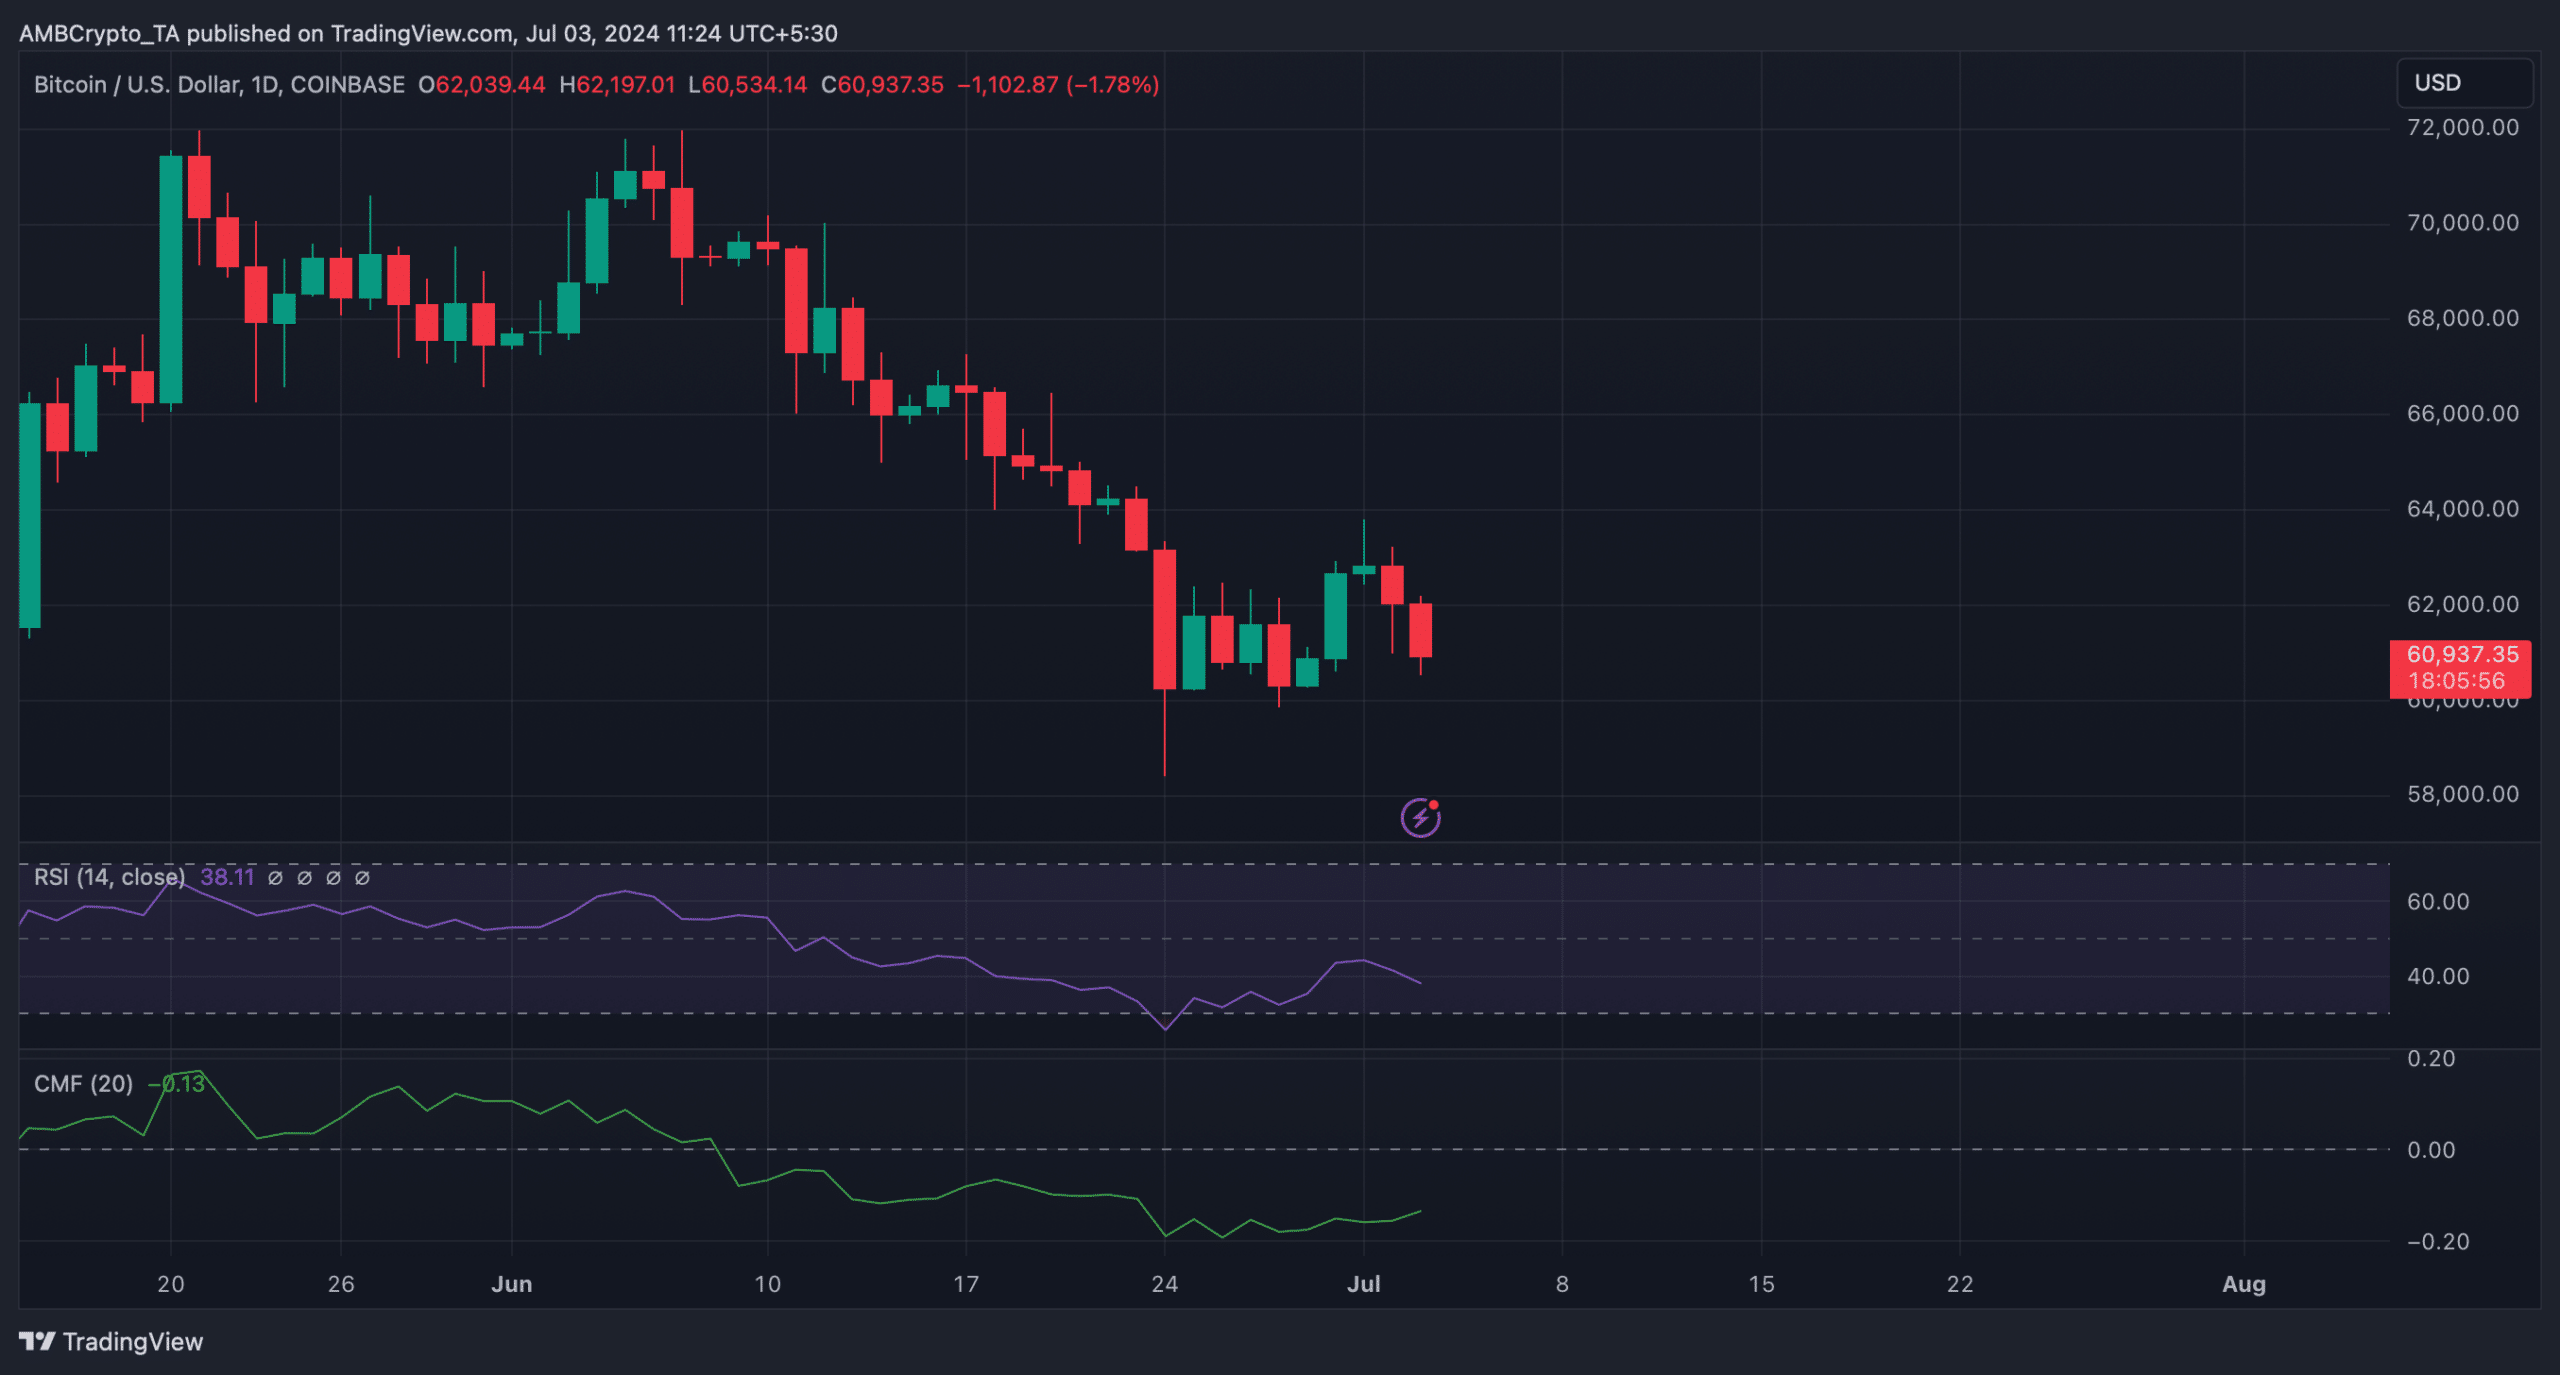
Source: TradingView