
Lido DAO jumps 10% – Can $38B TVL push LDO past $2?

- Bitcoin’s price surged by more than 4% in the last seven days.
- Indicators suggested that BTC might reach $87k soon.
Bitcoin [BTC] bulls worked hard this week as the king of cryptos’ price surpassed $70k. This sparked excitement in the community, and several expected the coin’s price to rise further.
However, a sell signal flashed on BTC’s chart, which could have impacted its price.
Bitcoin holds above $70k
CoinMarketCap’s data revealed that BTC gained bullish momentum on the 3rd of June as its value started to rise. The coin’s price spiked by more than 4% in the last seven days.
At the time of writing, BTC was trading at $71,091.06 with a market capitalization of over $1.4 trillion.
In the meantime, Ali, a popular crypto analyst, posted a tweet highlighting a sell signal. This hinted at a price decline.
However, the signal didn’t have much impact on Bitcoin’s price action as the coin continued to trade above $71k.
AMBCrypto’s analysis of CryptoQuant’s data revealed that investors didn’t sell BTC either. The coin’s exchange reserve was dropping, signaling high buying pressure.
Additionally, buying sentiment remained dominant among US investors as BTC’s Coinbase premium was green.

Source: CryptoQuant
Will BTC continue to rise?
AMBCrypto’s analysis of Glassnode’s data revealed that BTC might continue its bull rally. As per the coin’s Pi Cycle Top indicator, BTC was yet to reach its market top.
This meant that BTC’s price might continue to rise to $87k before it witnesses any major price correction.
For starters, the Pi Cycle indicator is composed of the 111-day moving average and a 2x multiple of the 350-day moving average of Bitcoin’s price.
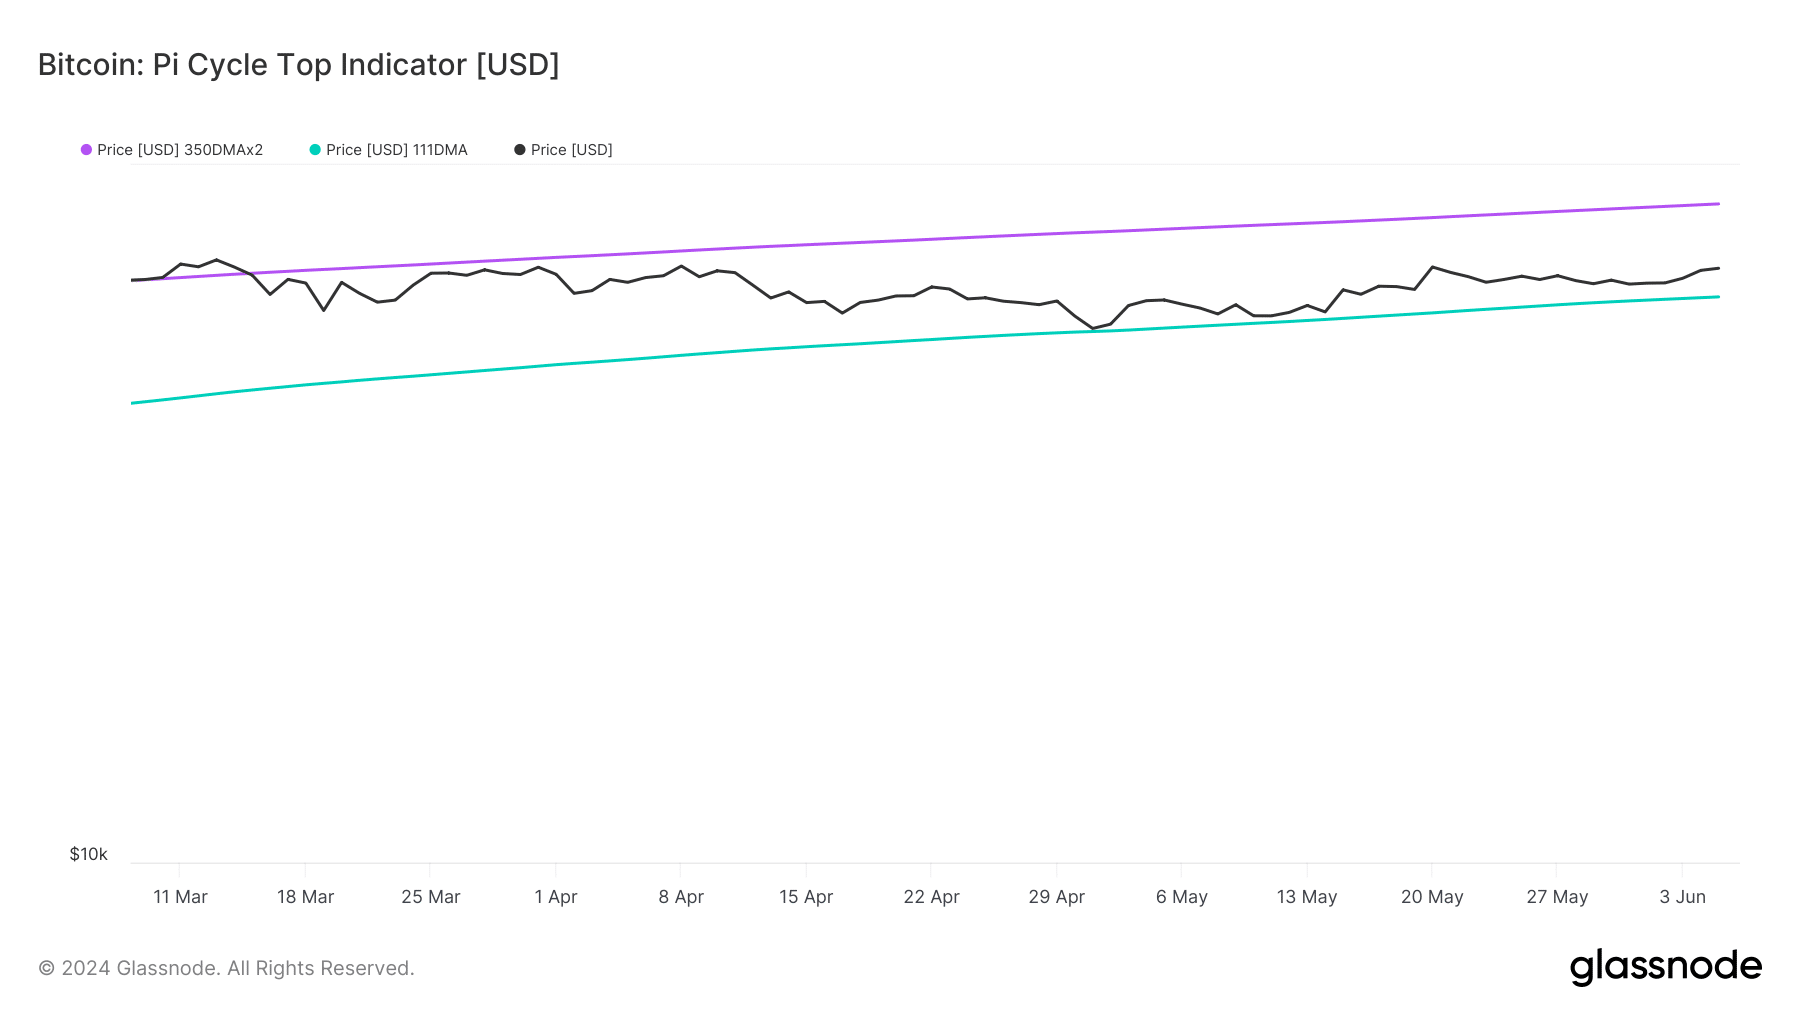
Source: Glassnode
BTC’s binary CDD was green, meaning that long-term holders’ movements in the last 7 days were lower than average. They have a motive to hold their coins.
Additionally, its funding rate also increased. This meant that long-position traders are dominant and are willing to pay short-position traders. These metrics suggested that the chances of BTC continuing to rise were high.
AMBCrypto then analyzed BTC’s daily chart to better understand which direction its price was headed. The technical indicator MACD displayed a bullish crossover.
Read Bitcoin’s [BTC] Price Prediction 2024-2025
On top of that, BTC’s Relative Strength Index (RSI) remained well above the neutral mark, suggesting a further price hike in the coming days.
However, while the aforementioned indicators supported the bulls, BTC’s Chaikin Money Flow (CMF) favored the bears. This seemed to be the case, as the indicator registered a downtick in the recent past.
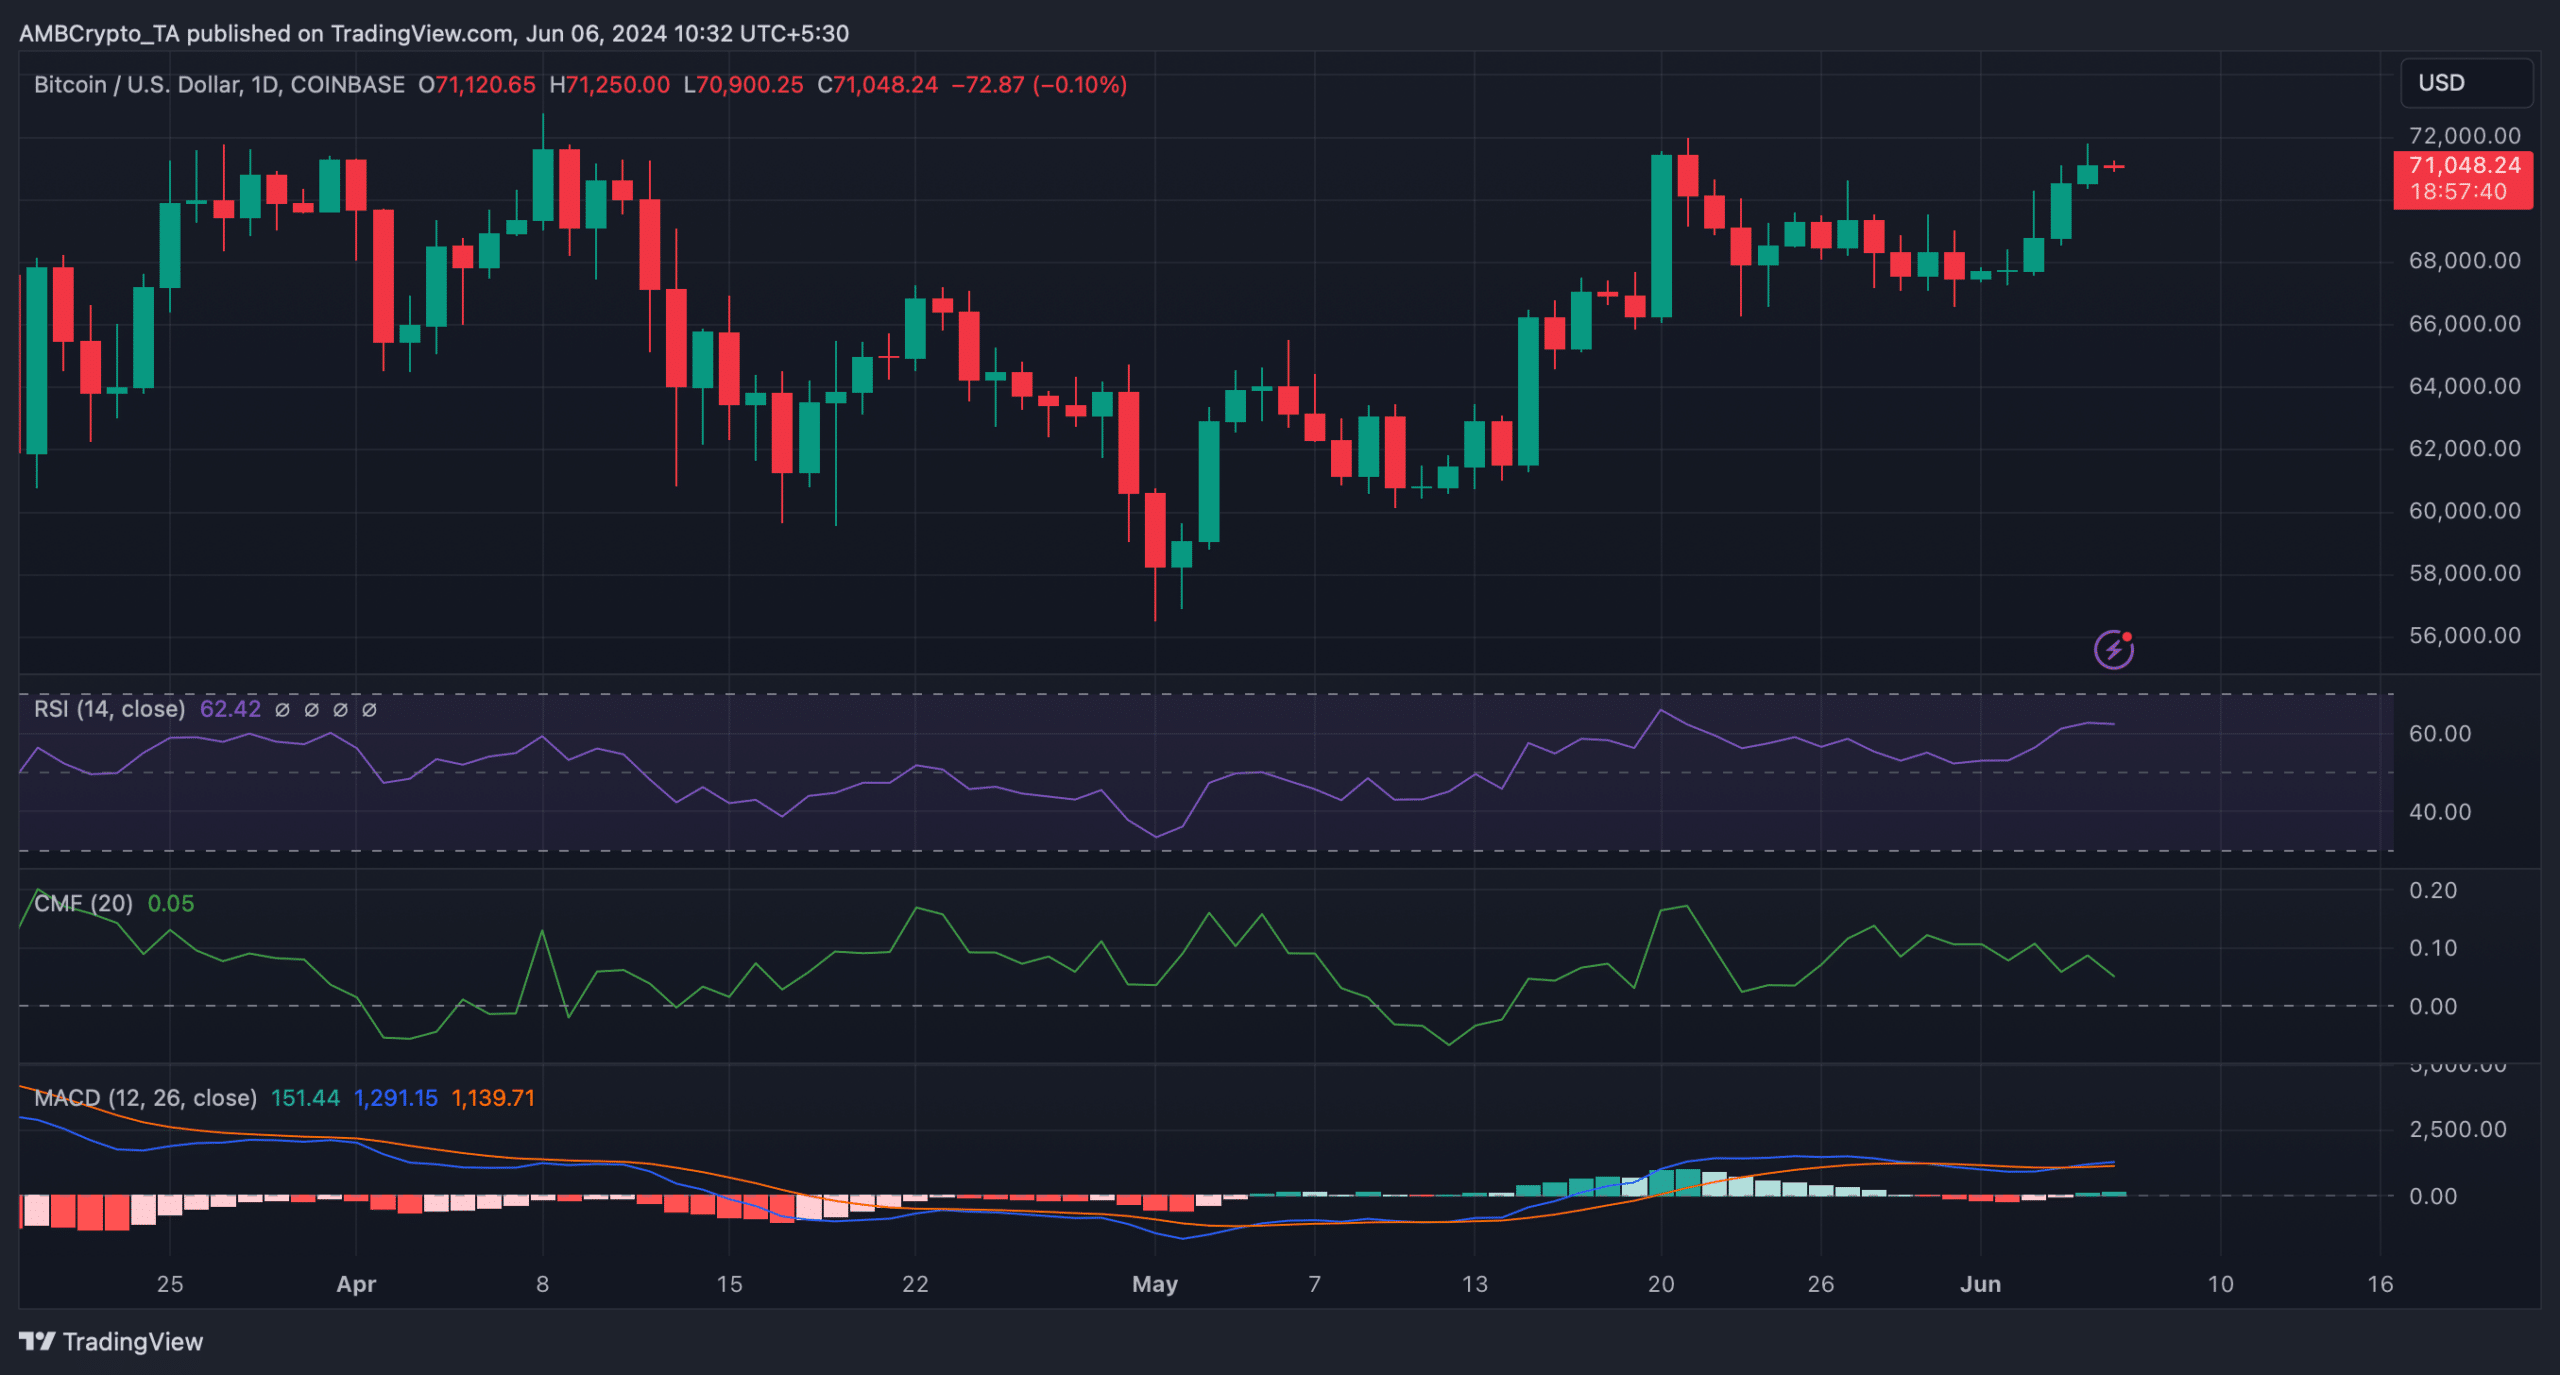
Source: TradingView


