
- Bitcoin’s trading chart showed a divergence at press time.
- Bitcoin’s fear and greed index was in the “greed” position at this time as well.
Bitcoin bears continued to control the last month as Bitcoin’s [BTC] value dropped by over 3%. However, the coin was showing signs of recovery as it managed to slip above the $56k psychological resistance.
At the time of writing, BTC was trading at $56,632.98 with a market capitalization of over $1.12 trillion.
Meanwhile, JAVON, a popular crypto analyst, posted a tweet revealing a bullish divergence on the king coin’s chart. The bullish divergence indicated a possible price increase in the coming days.
In fact, it could also push BTC towards an all-time high.
Additionally, a CryptoQuant analysis also hinted at a price rise. As per the analysis, BTC’s exchange reserve was dropping. Simultaneously, stablecoin supply increased, indicating a bullish outlook for Bitcoin.

Source: X
Bitcoin’s ATH soon?
AMBCrypto then checked several market indicators and metrics to see whether they also hinted at a price uptick that could push Bitcoin to an ATH.
First, we checked the Bitcoin Rainbow Chart. As per our analysis, BTC’s rainbow chart showed that the coin’s price was in the “Basically a Fire Sale” zone.
Whenever the indicator hits this level, it suggests that investors should consider buying, as the chances of BTC’s price increasing in the coming days are high.

Source: Blockchaincenter
Next, we took a look at Glassnode’s data. As per our look at the Pi Cycle Top indicator., BTC was trading well below its possible market bottom, which was $62k.
Therefore, if BTC bulls push hard, then it won’t be surprising to watch the coin at least touch that mark in the coming days.
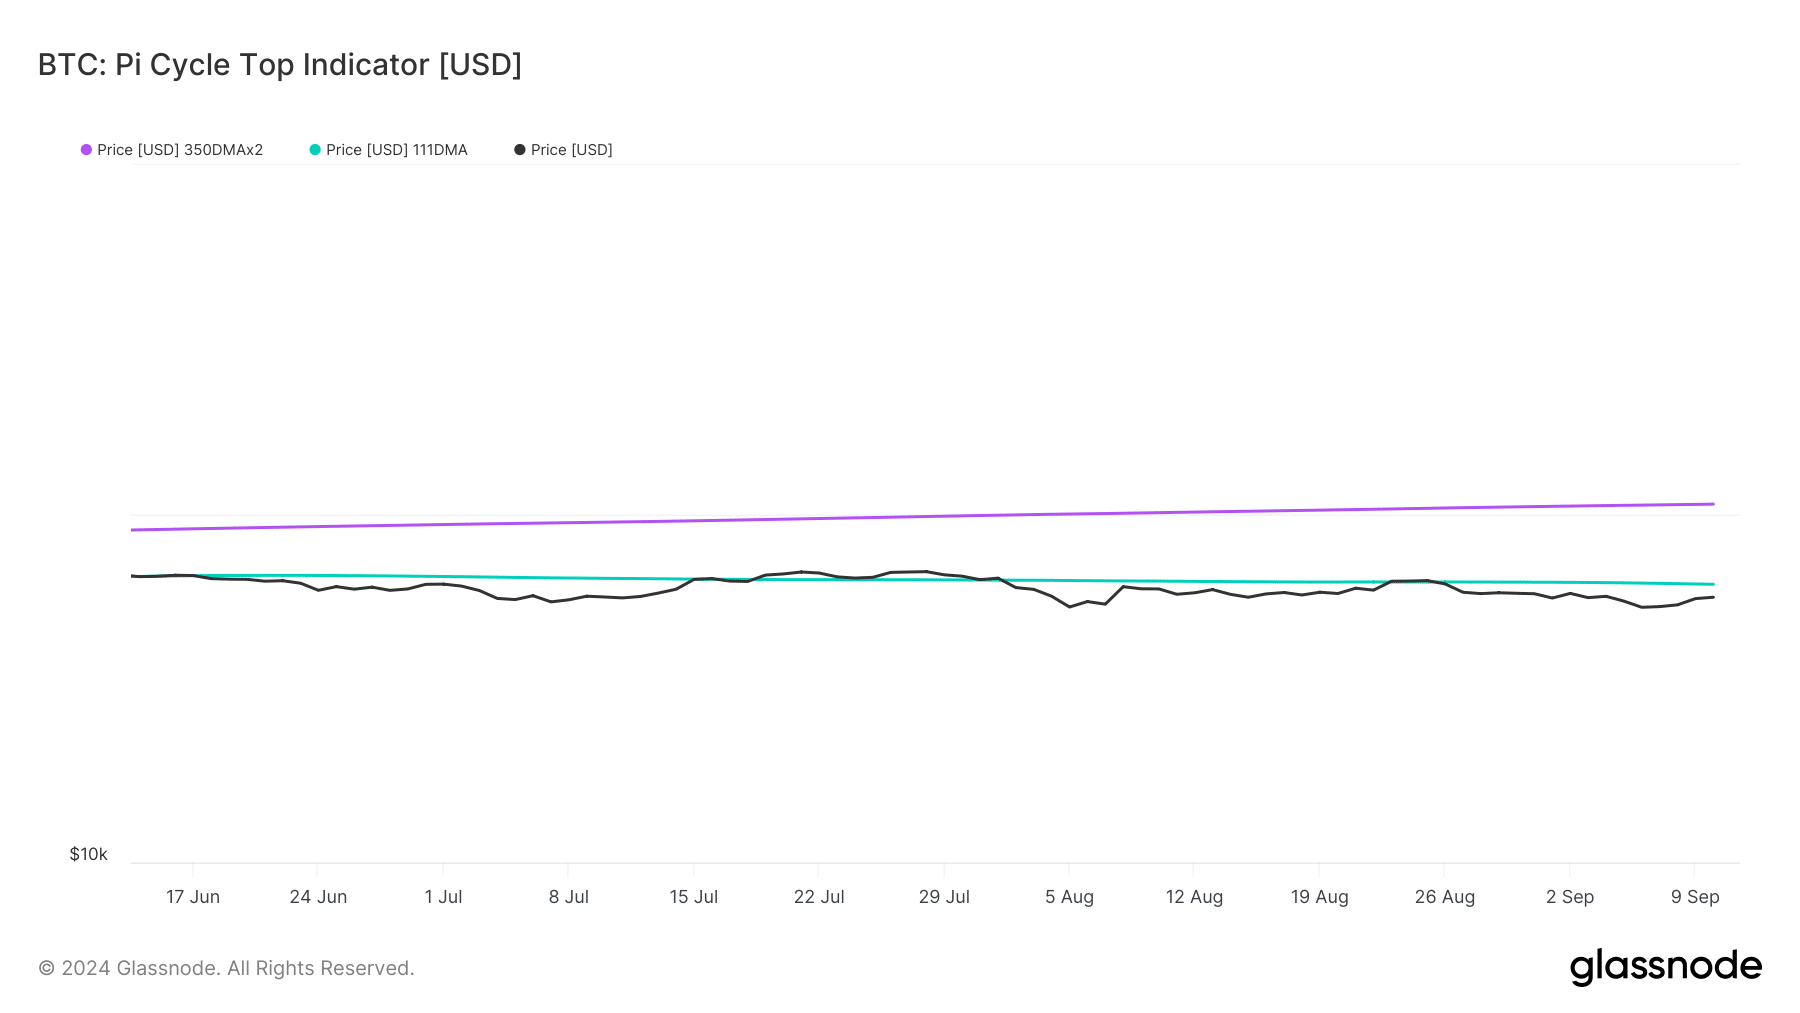
Source: Glassnode
However, at the time of writing, Bitcoin’s fear and greed index was in the “greed” position. This suggested that there were chances of a price correction.
Therefore, AMBCrypto assessed the coin’s daily chart to better understand what to expect.
Read Bitcoin’s [BTC] Price Prediction 2024–2025
According to our analysis, BTC’s Chaikin Money Flow (CMF) registered a downtick. The coin’s Money Flow Index (MFI) also registered a similar decline.
These indicators suggested that investors might witness BTC’s price to drop. However, the MACD displayed a bullish advantage in the market, which hinted at a price rise in the coming days.
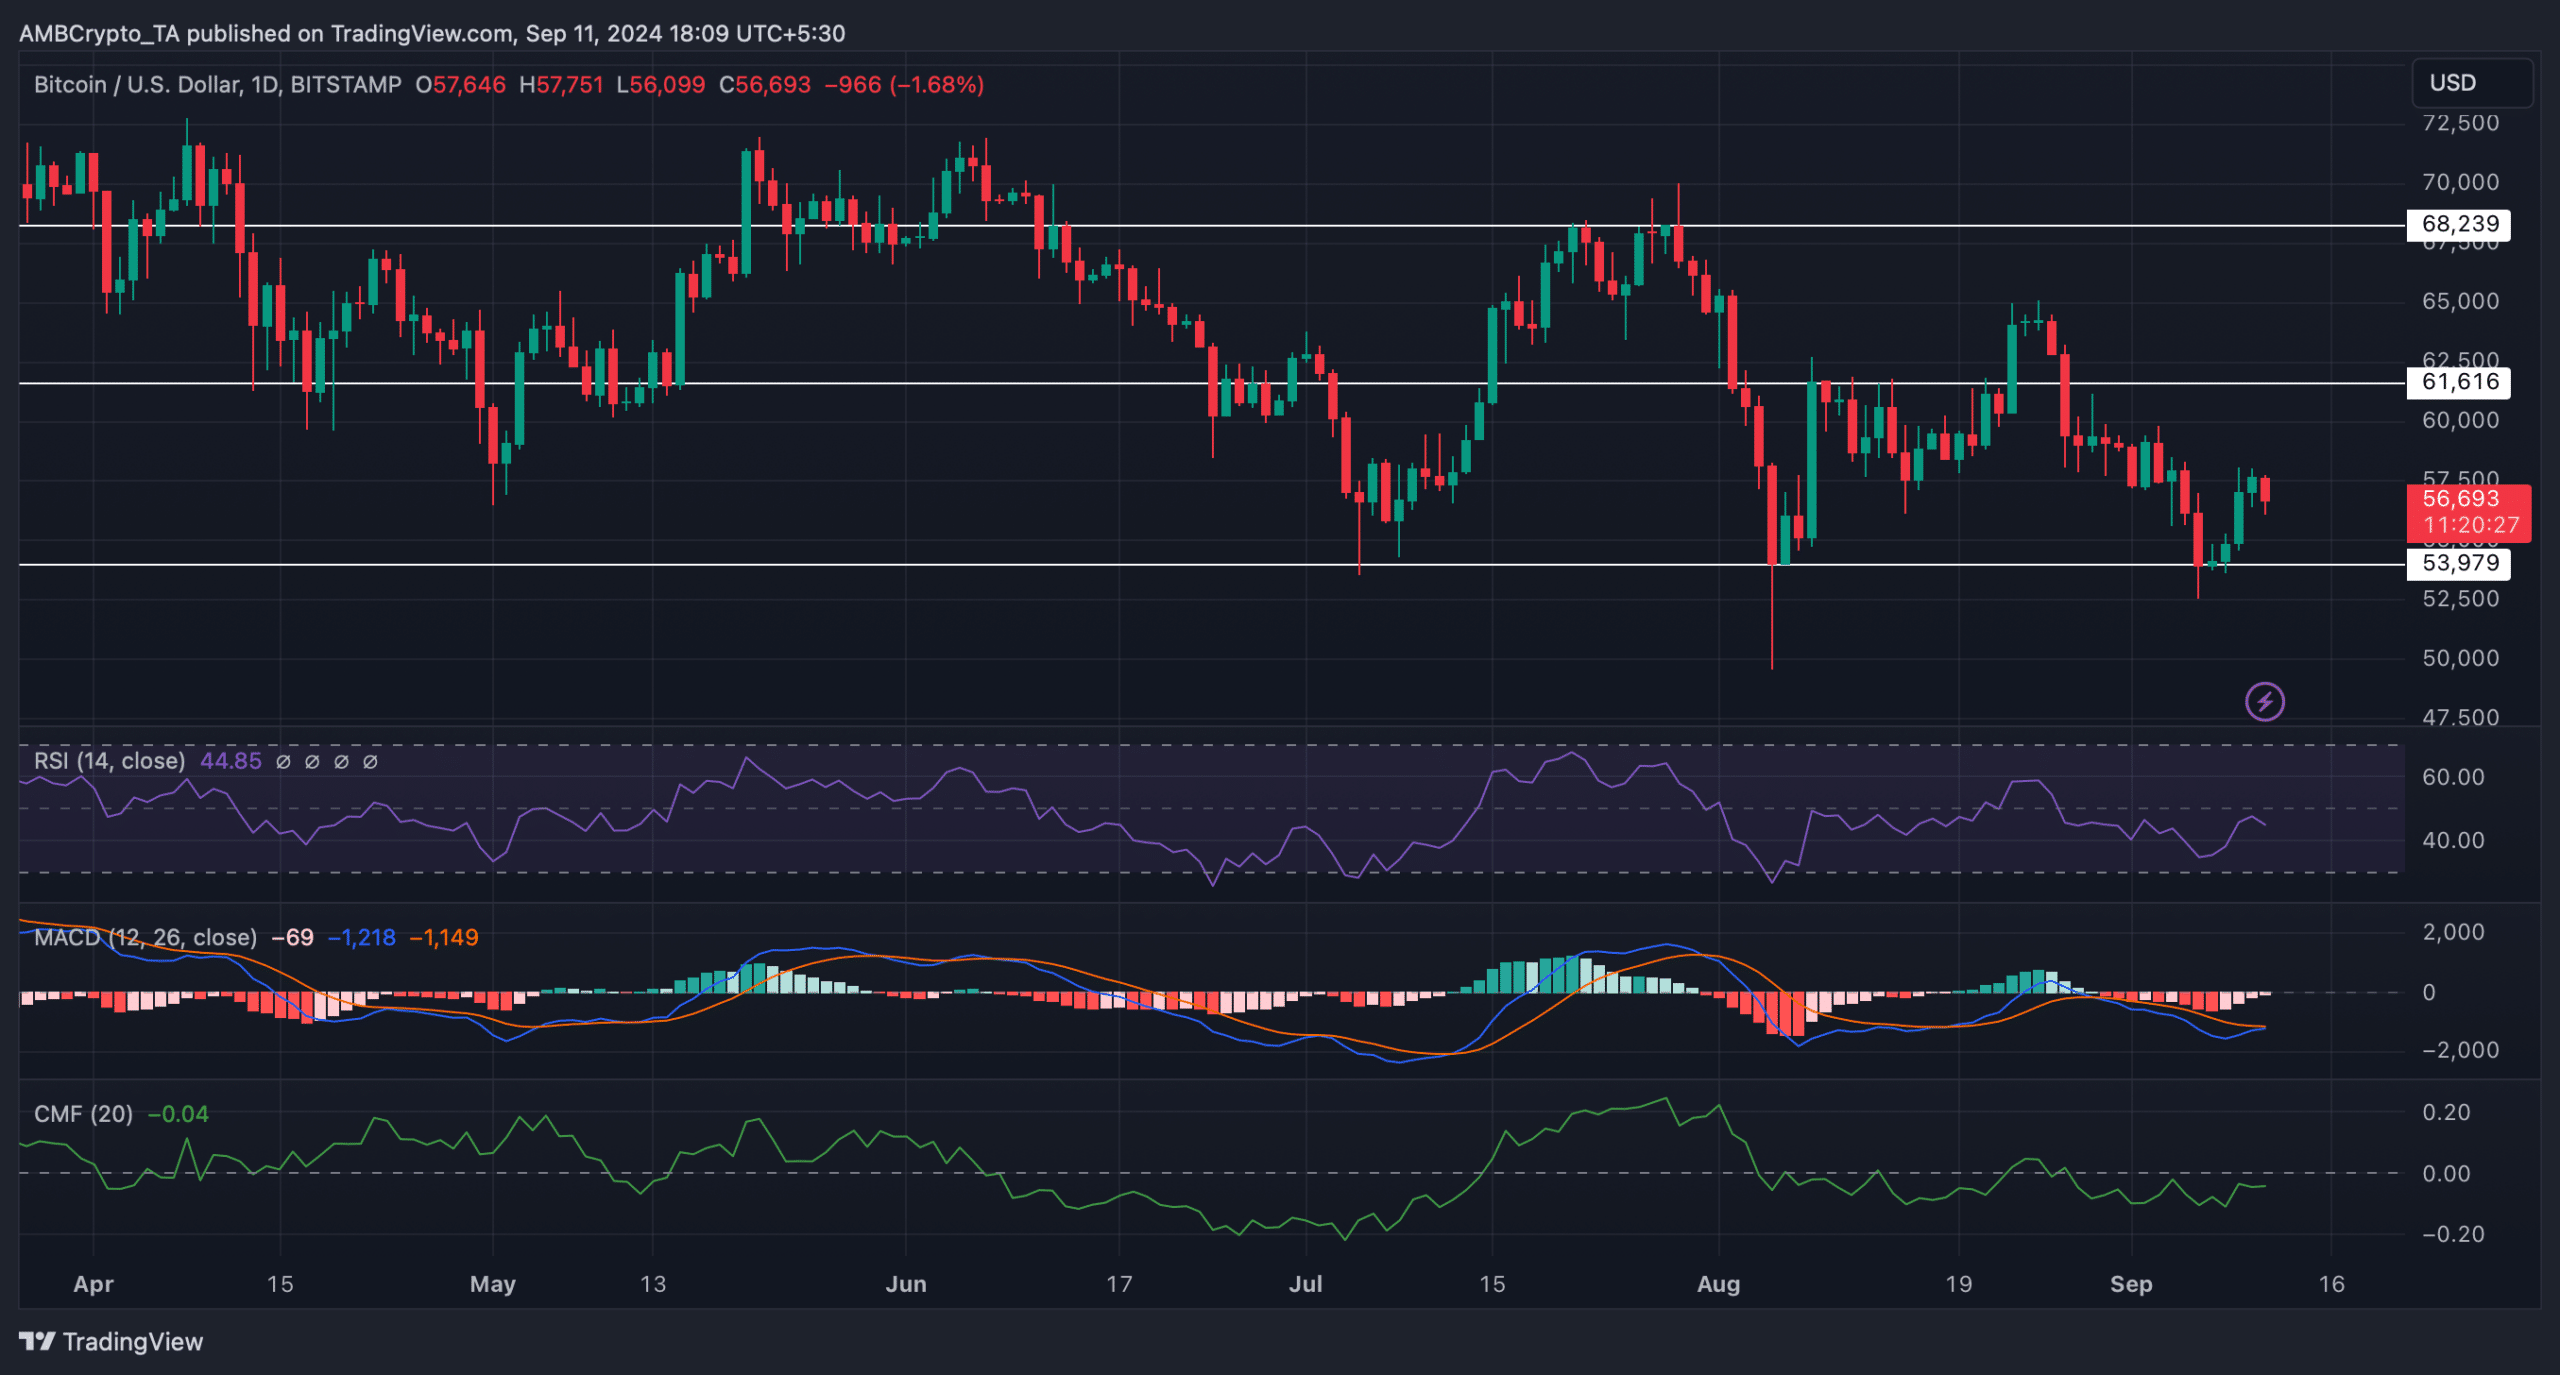
Source: TradingView