- Bitcoin was up by more than 4% in the last 24 hours.
- A few technical indicators and metrics looked bearish.
Bitcoin [BTC] regained its bullish momentum over the last few hours, as the king coin’s value surpassed the $70k mark after plummeting under $66k.
In the meantime, BTC’s long-term investors managed to take some profits during the latest price pump.
Bitcoin touches $70k
According to CoinMarketCap, BTC was up by 3% in the last seven days. In fact, over the last 24 hours, its value surged by over 4%.
At the time of writing, BTC was trading at $70,310.91 with a market capitalization of over $1.38 trillion.
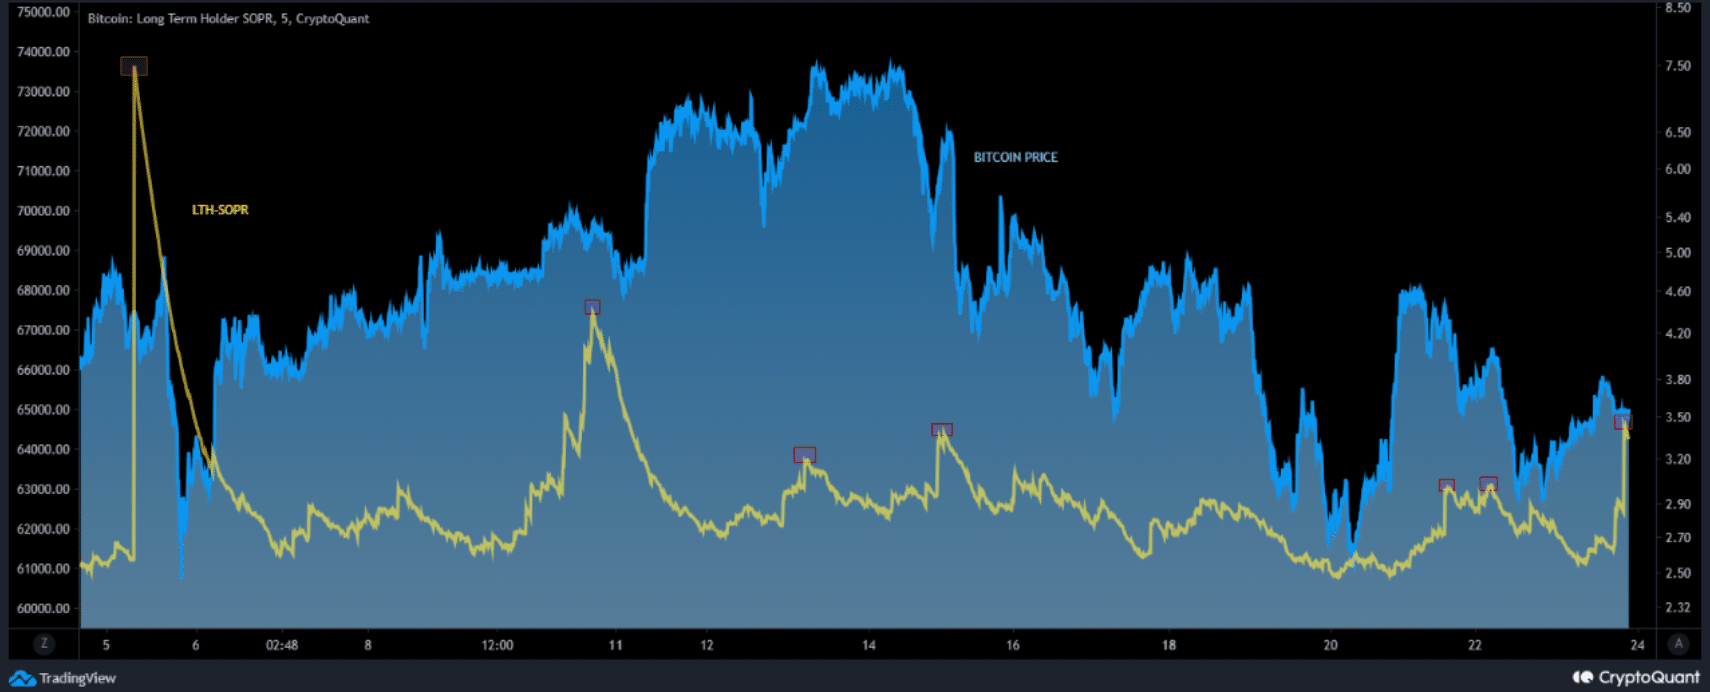
While the coin’s price rose, SimonaD, an author and analyst at CryptoQuant, posted an analysis highlighting long-term investor actions.
As per the analysis, the Long-Term Holder Spent Output Profit Ratio is a crucial metric used in analyzing market trends and investor behavior, particularly among long-term investors.
The analysis chart showed that the Bitcoin long-term holder SOPR (EMA 144) had more spikes since the beginning of March.
This means that investors took some profits along the way as the price reached new highs.
In fact, long-term holders continued to be more active as per the latest data as well. AMBCrypto’s analysis of CryptoQuant’s data revealed that BTC’s Binary CDD was red.
This meant that long-term holders’ movements in the last seven days were higher than average. If they were moved for the purpose of selling, it may have a negative impact.
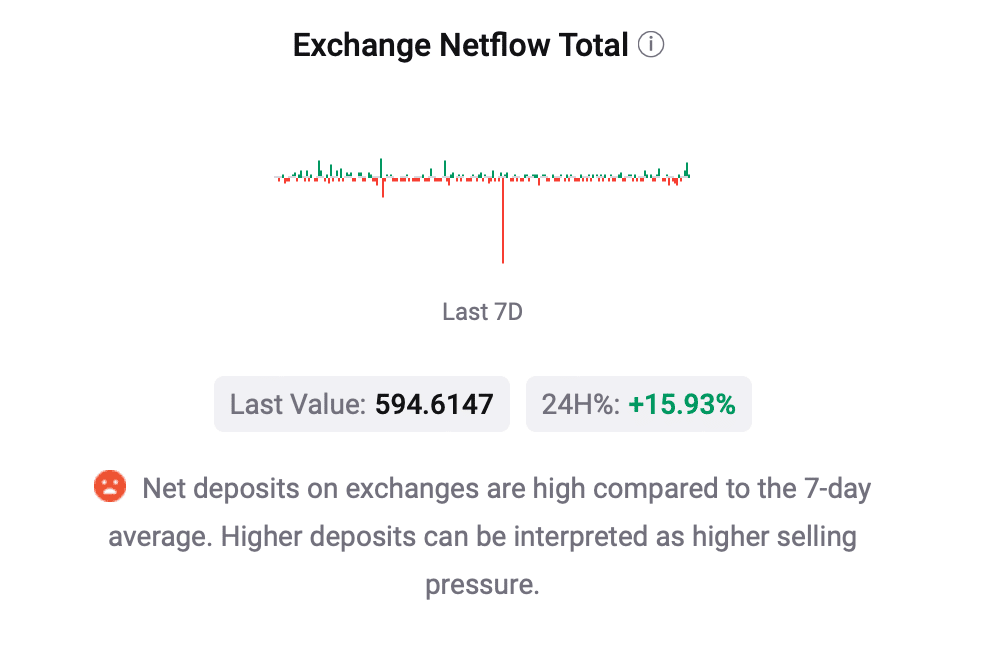
Also, selling sentiment in general seemed to have been dominating the market as BTC’s net deposit on exchanges was high compared to the last seven-day average, which might cause a price correction soon.
Which way is BTC headed?
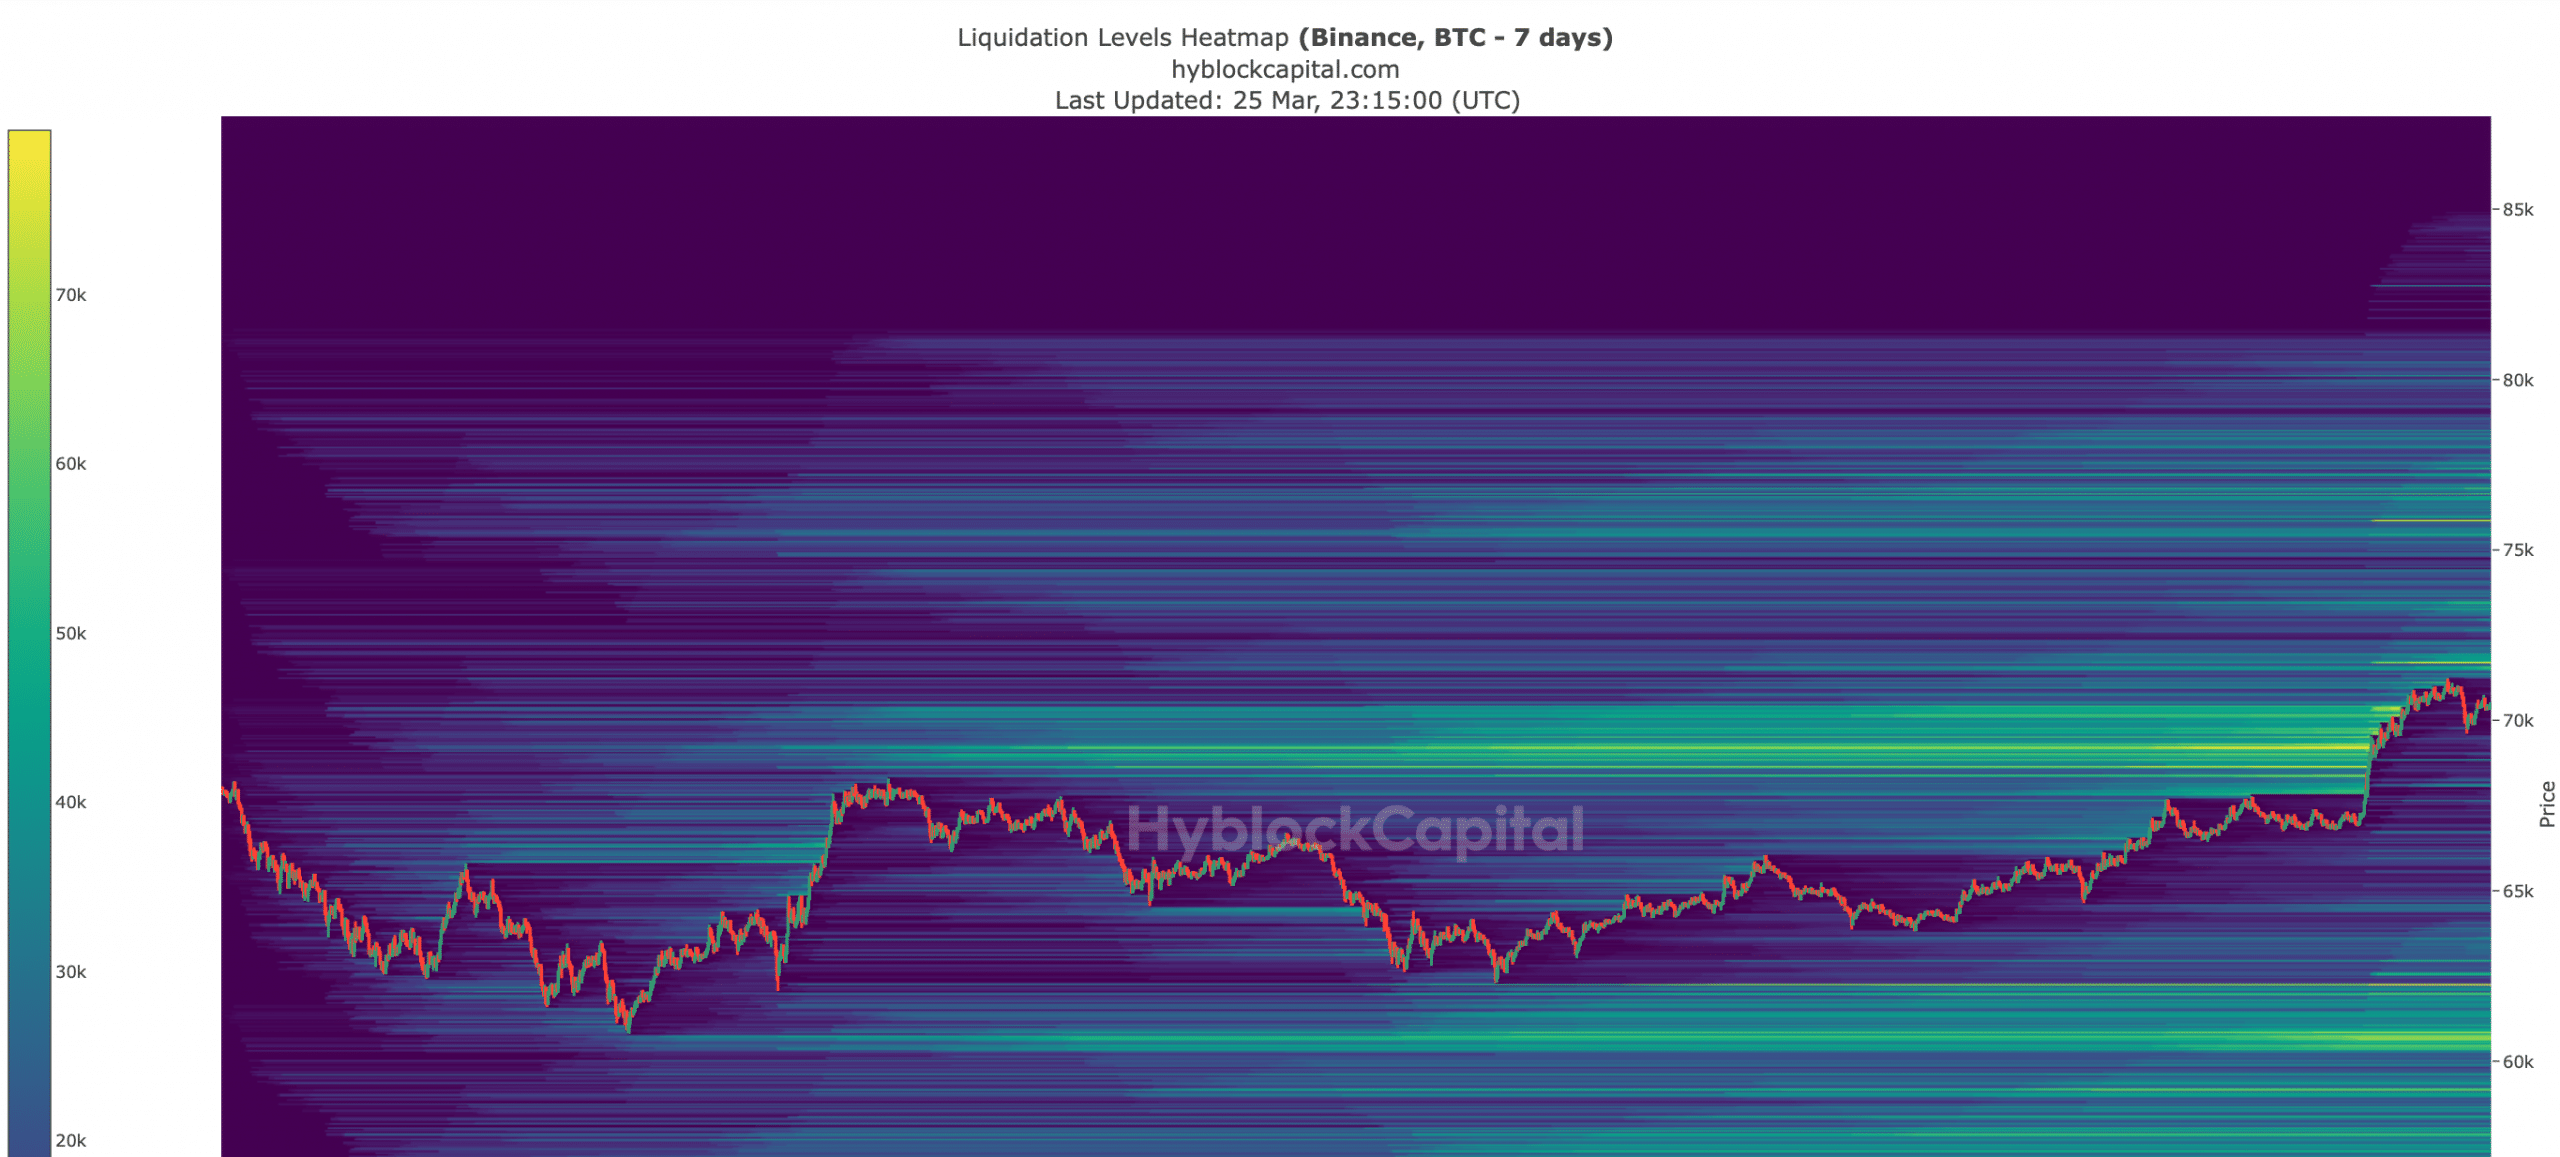
AMBCrypto’s analysis of Hyblock Capital’s data pointed out that a substantial amount of BTC could be liquidated when its value touches the $71,750 mark.
Since liquidation will rise, that level might be a resistance for BTC, which might cause a short-term price decline.
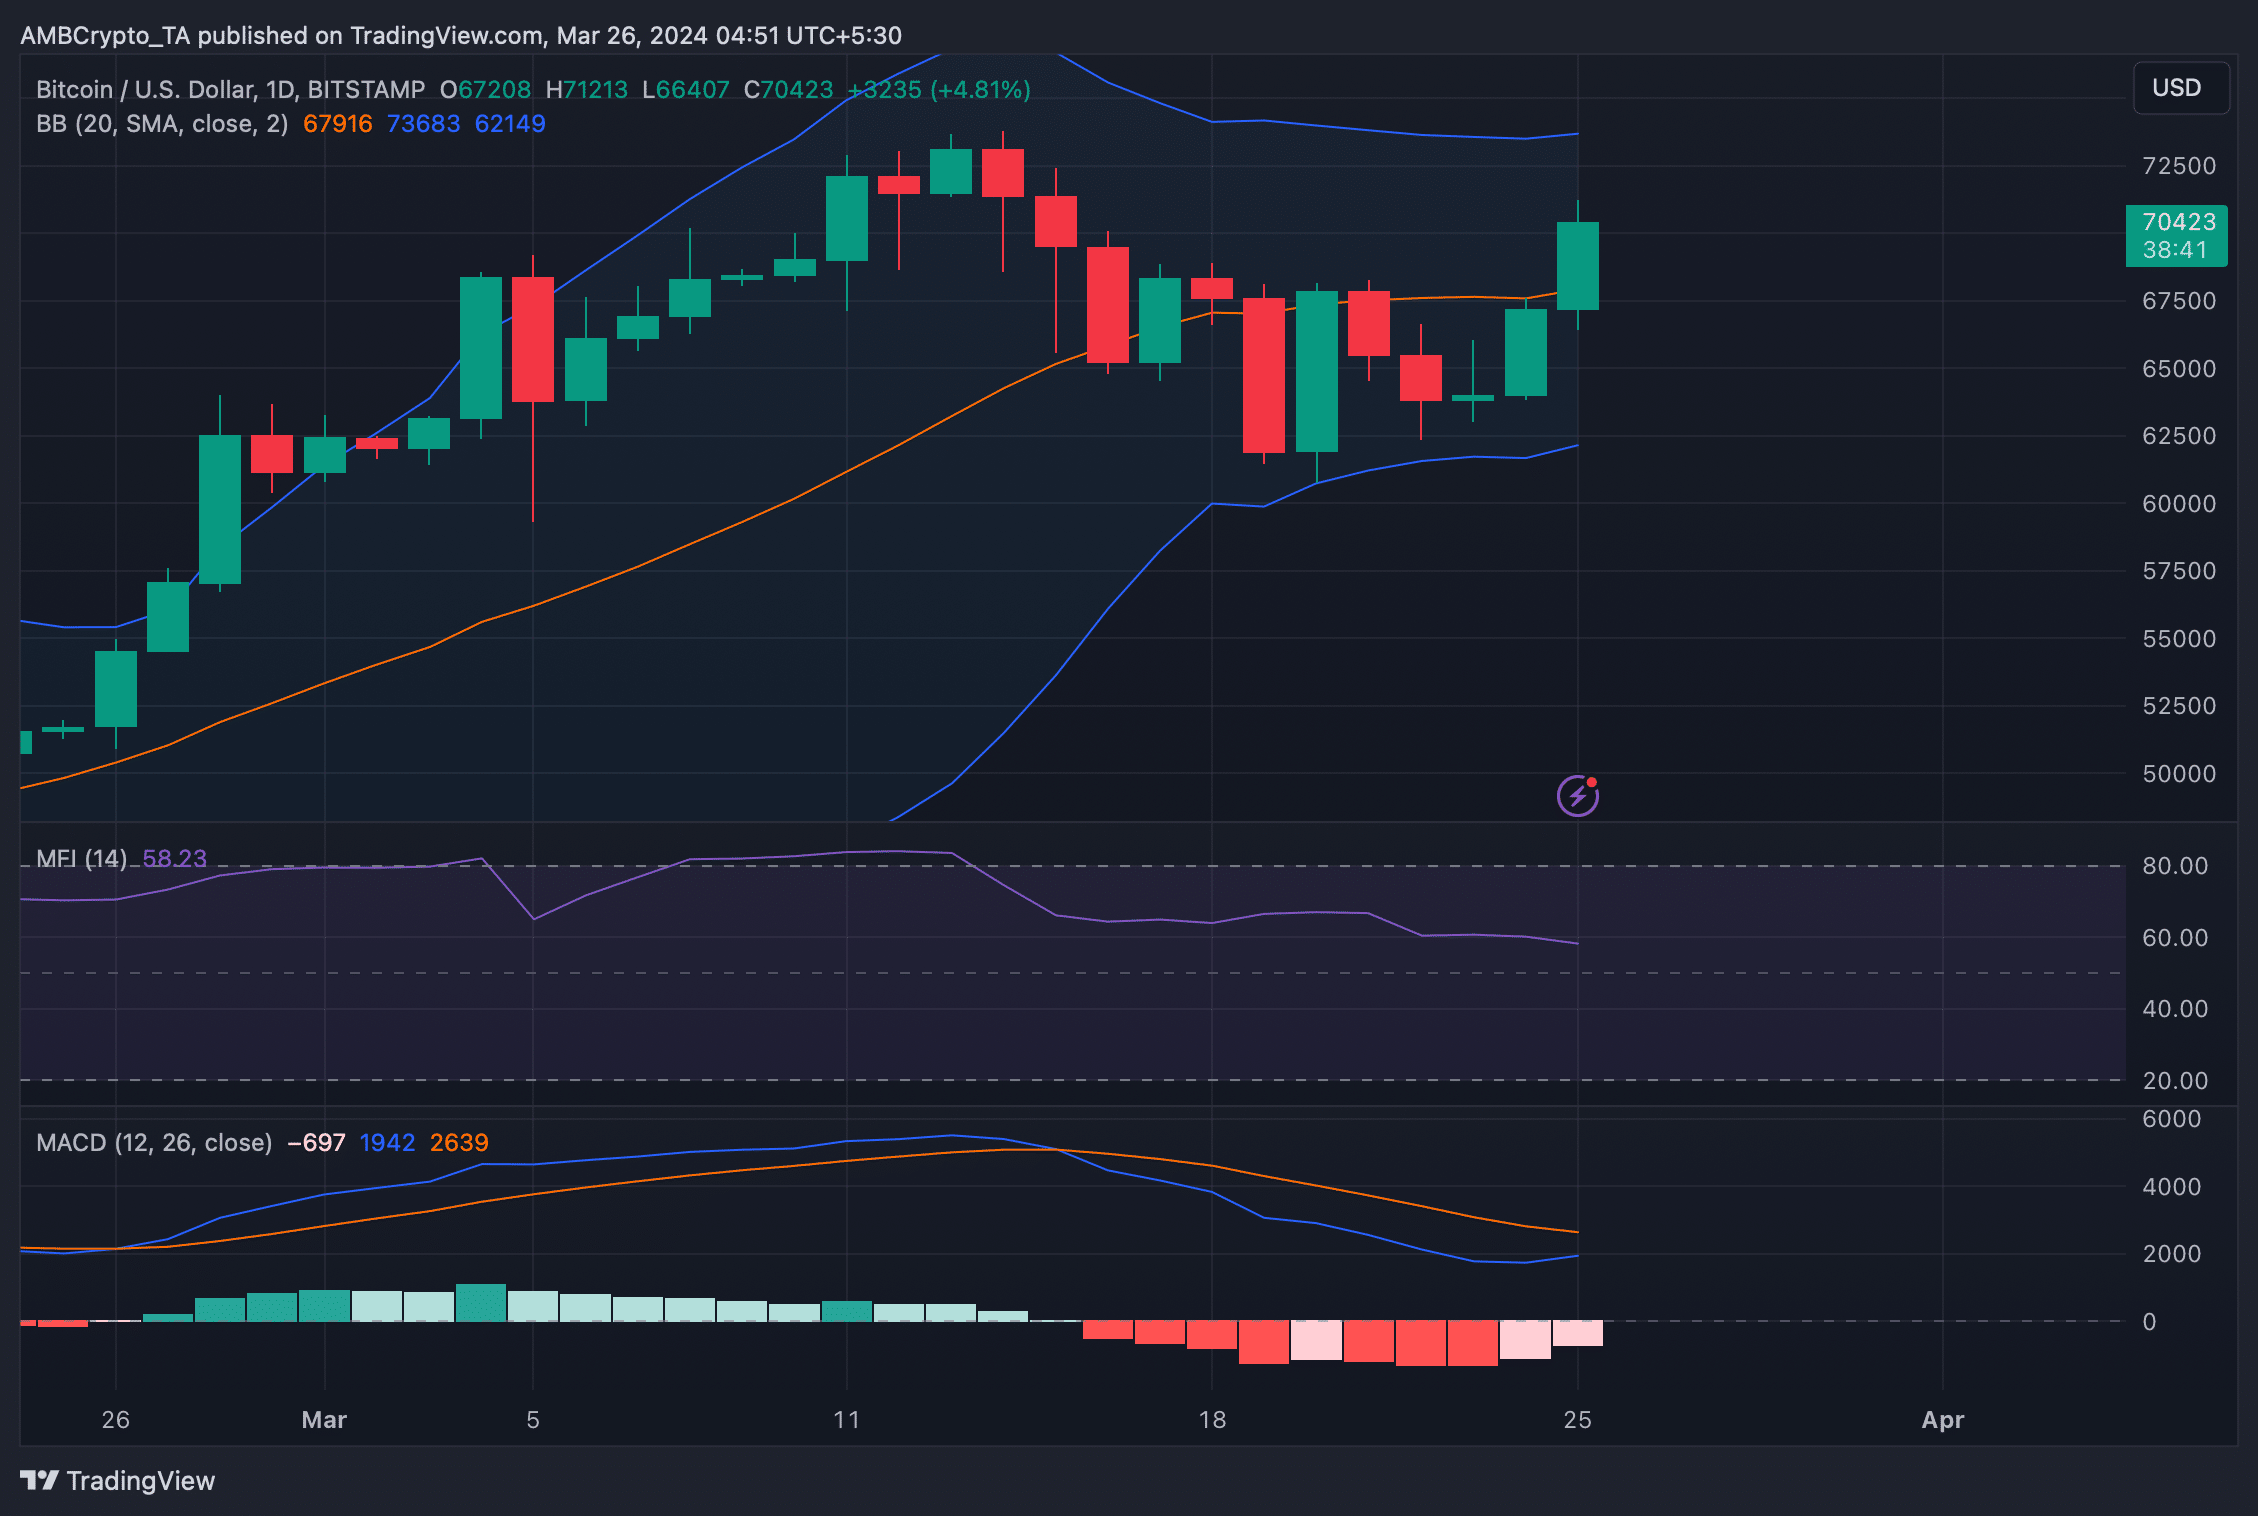
To better understand which way BTC was headed, AMBCrypto then checked its daily chart. As per our analysis, BTC’s price moved above its 20-day SMA, as displayed by the Bollinger Bands.
Read Bitcoin’s [BTC] Price Prediction 2024-25
The technical indicator MACD also displayed the possibility of a bullish crossover in the coming days.
These indicators suggested that BTC was getting ready for a further bull rally. Nonetheless, BTC’s growth momentum might decline as its Money Flow Index (MFI) moved sideways in the last few days.