
- The latest data revealed that Bitcoin’s price momentum has shifted from negative to positive.
- Metrics and market indicators looked bearish on the coin.
After crossing the $69k mark, Bitcoin [BTC] has once again fallen under that level. Though this might look concerning at first glance, the latest data revealed that now might be the right time to accumulate BTC.
Let’s have a closer look at what’s going on with the king of cryptos.
Bitcoin’s dilemma
BTC gained bullish momentum as it exceeded $69k on the 27th of July. This gave hope to investors that BTC would once again touch $70k.
However, that didn’t happen as the bears took control and pushed the coin’s price down in the following hours. According to CoinMarketCap, at the time of writing, BTC was trading at $67,481.86 with a market capitalization of over $1.33 trillion.
In the meantime, Ali, a popular crypto analyst, posted a tweet revealing an interesting development. As per the tweet, BTC’s Hash Ribbon signals the end of Bitcoin miner capitulation, suggesting BTC price momentum has shifted from negative to positive.
For starters, the Bitcoin hash ribbon show the hash rate and price recovery following miner capitulations, which have historically produced powerful long-term buy signals.

Source: X
Is buying pressure rising?
Since the above-mentioned indicator suggested that there was a buying opportunity, AMBCrypto checked BTC’s metrics to find whether investors were actively buying the coin.
Our analysis of Santiment’s data revealed that BTC’s supply on exchanges increased sharply while its supply outside of exchanges dropped. This clearly meant that selling pressure increased.
The fact that investors were selling BTC was further proven by the spike in its exchange outflow.
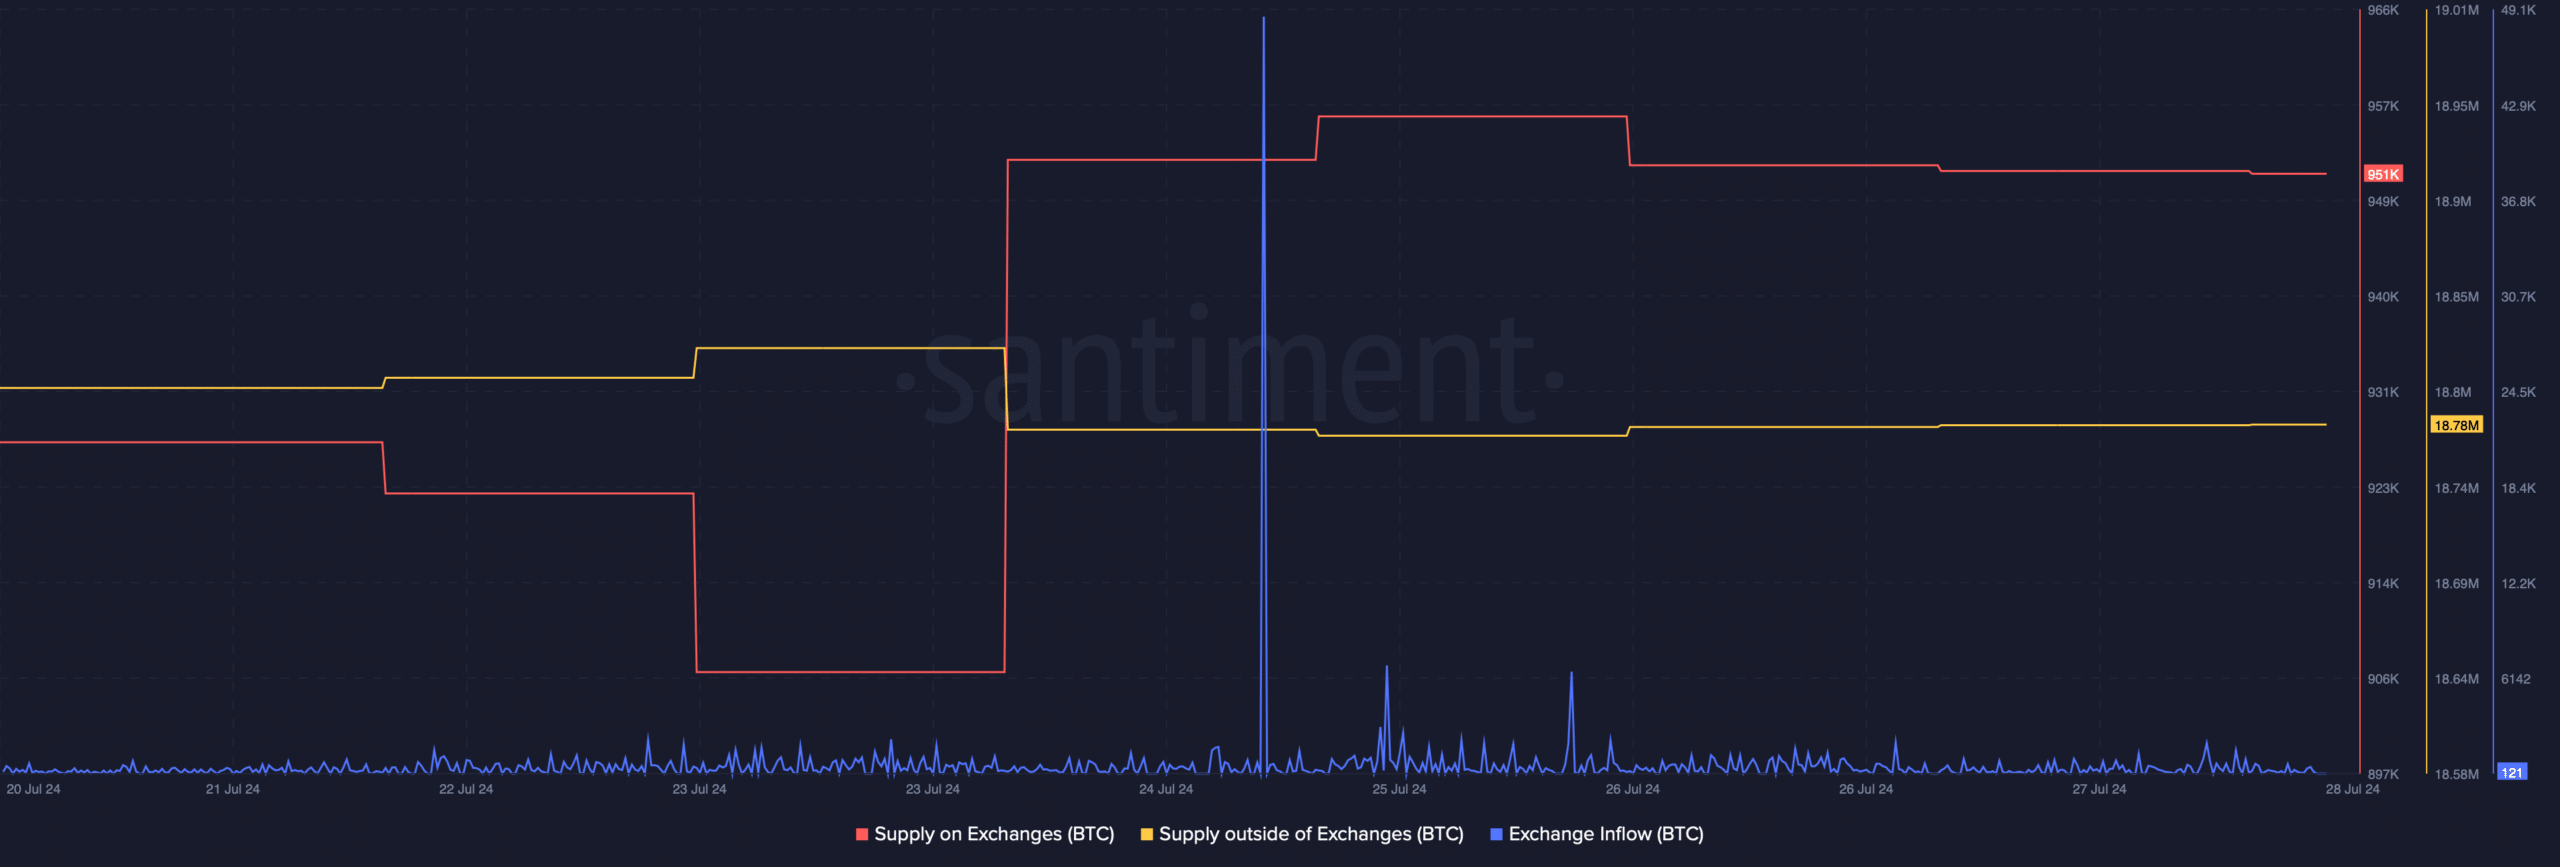
Source: Santiment
However, unlike retail investors, miners considered holding their BTC. Our look at CryptoQuant’s data revealed that BTC’s Miners’ Position Index (MPI) was green, meaning that miners were selling less holdings compared to its one-year average.
It was interesting to note that while miners were HODLing, their revenue dropped. This, in the coming days, could trigger a trend reversal and force miners to sell BTC.
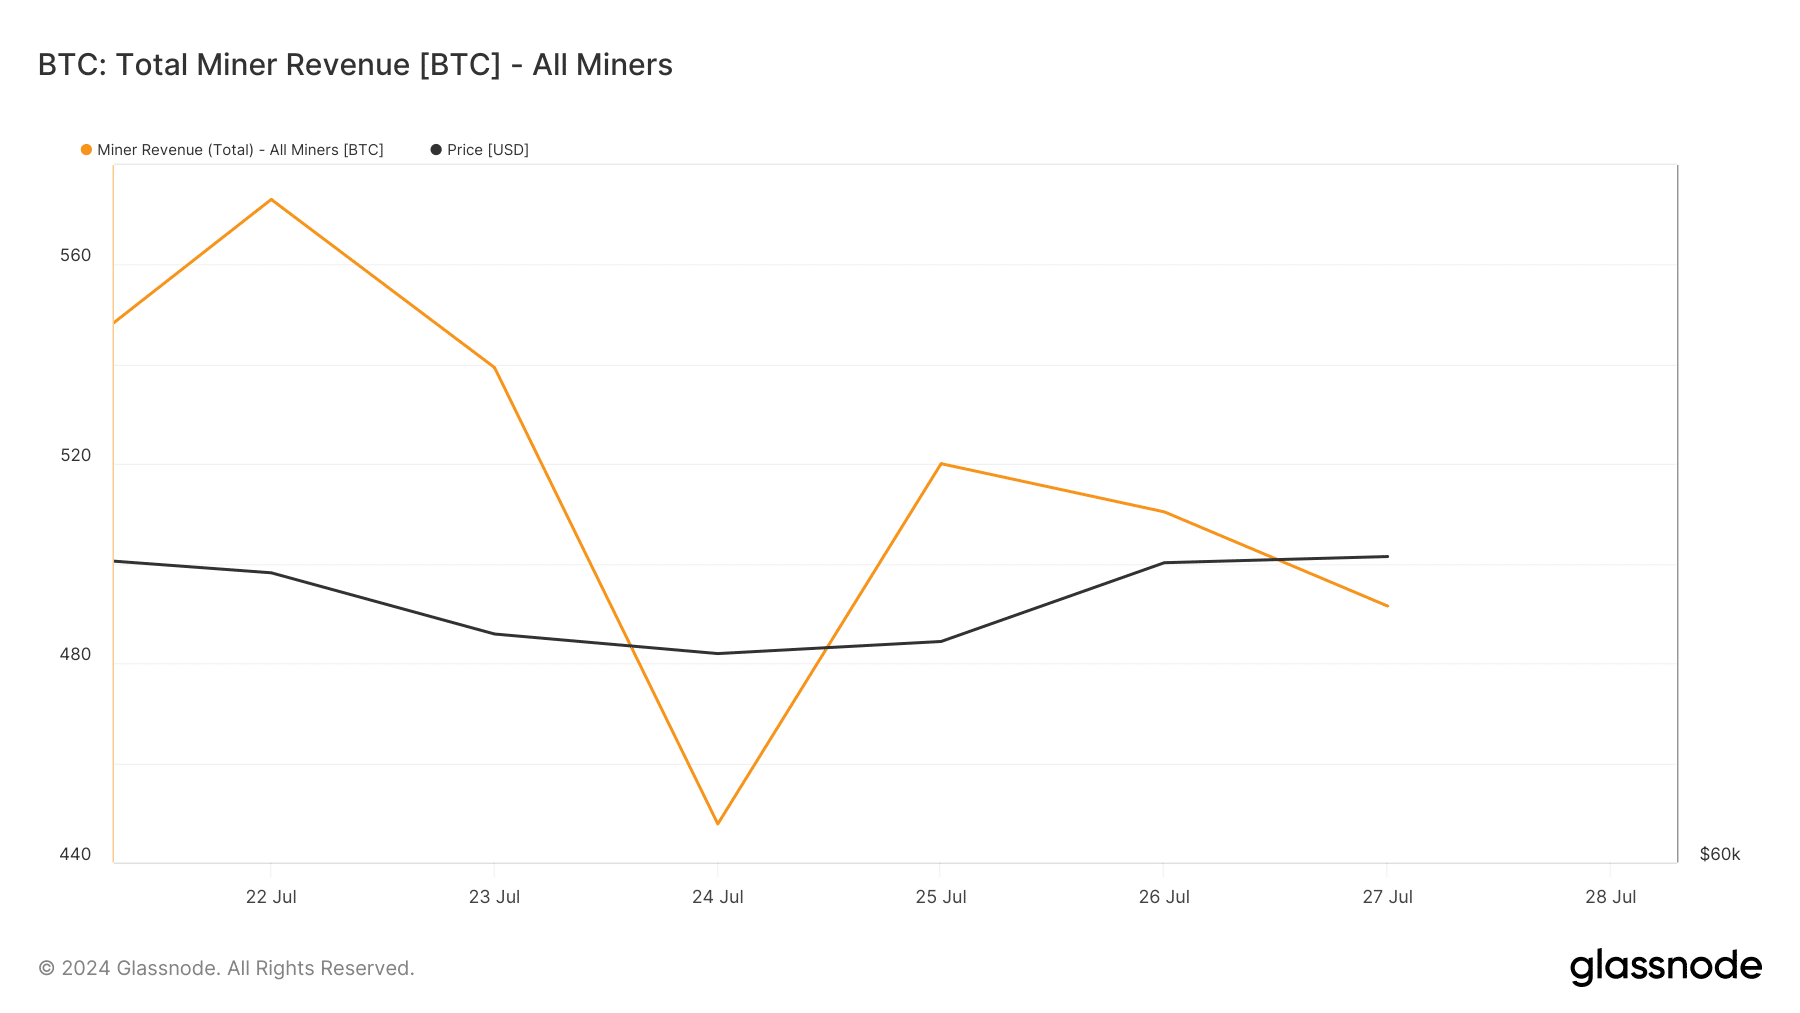
Source: Glassnode
AMBCrypto then planned to check Bitcoin’s daily chart to find out what to expect from the coin. As per our analysis, BTC’s Relative Strength Index (RSI) registered a downtick. The Money Flow Index (MFI) also followed a similar trend.
Read Bitcoin’s [BTC] Price Prediction 2024-25
Additionally, the technical indicator MACD displayed the possibility of a bearish crossover soon, hinting at a price correction.
Nonetheless, the Chaikin Money Flow (CMF) indicated that there were chances of a price increase as the indicator moved northwards.
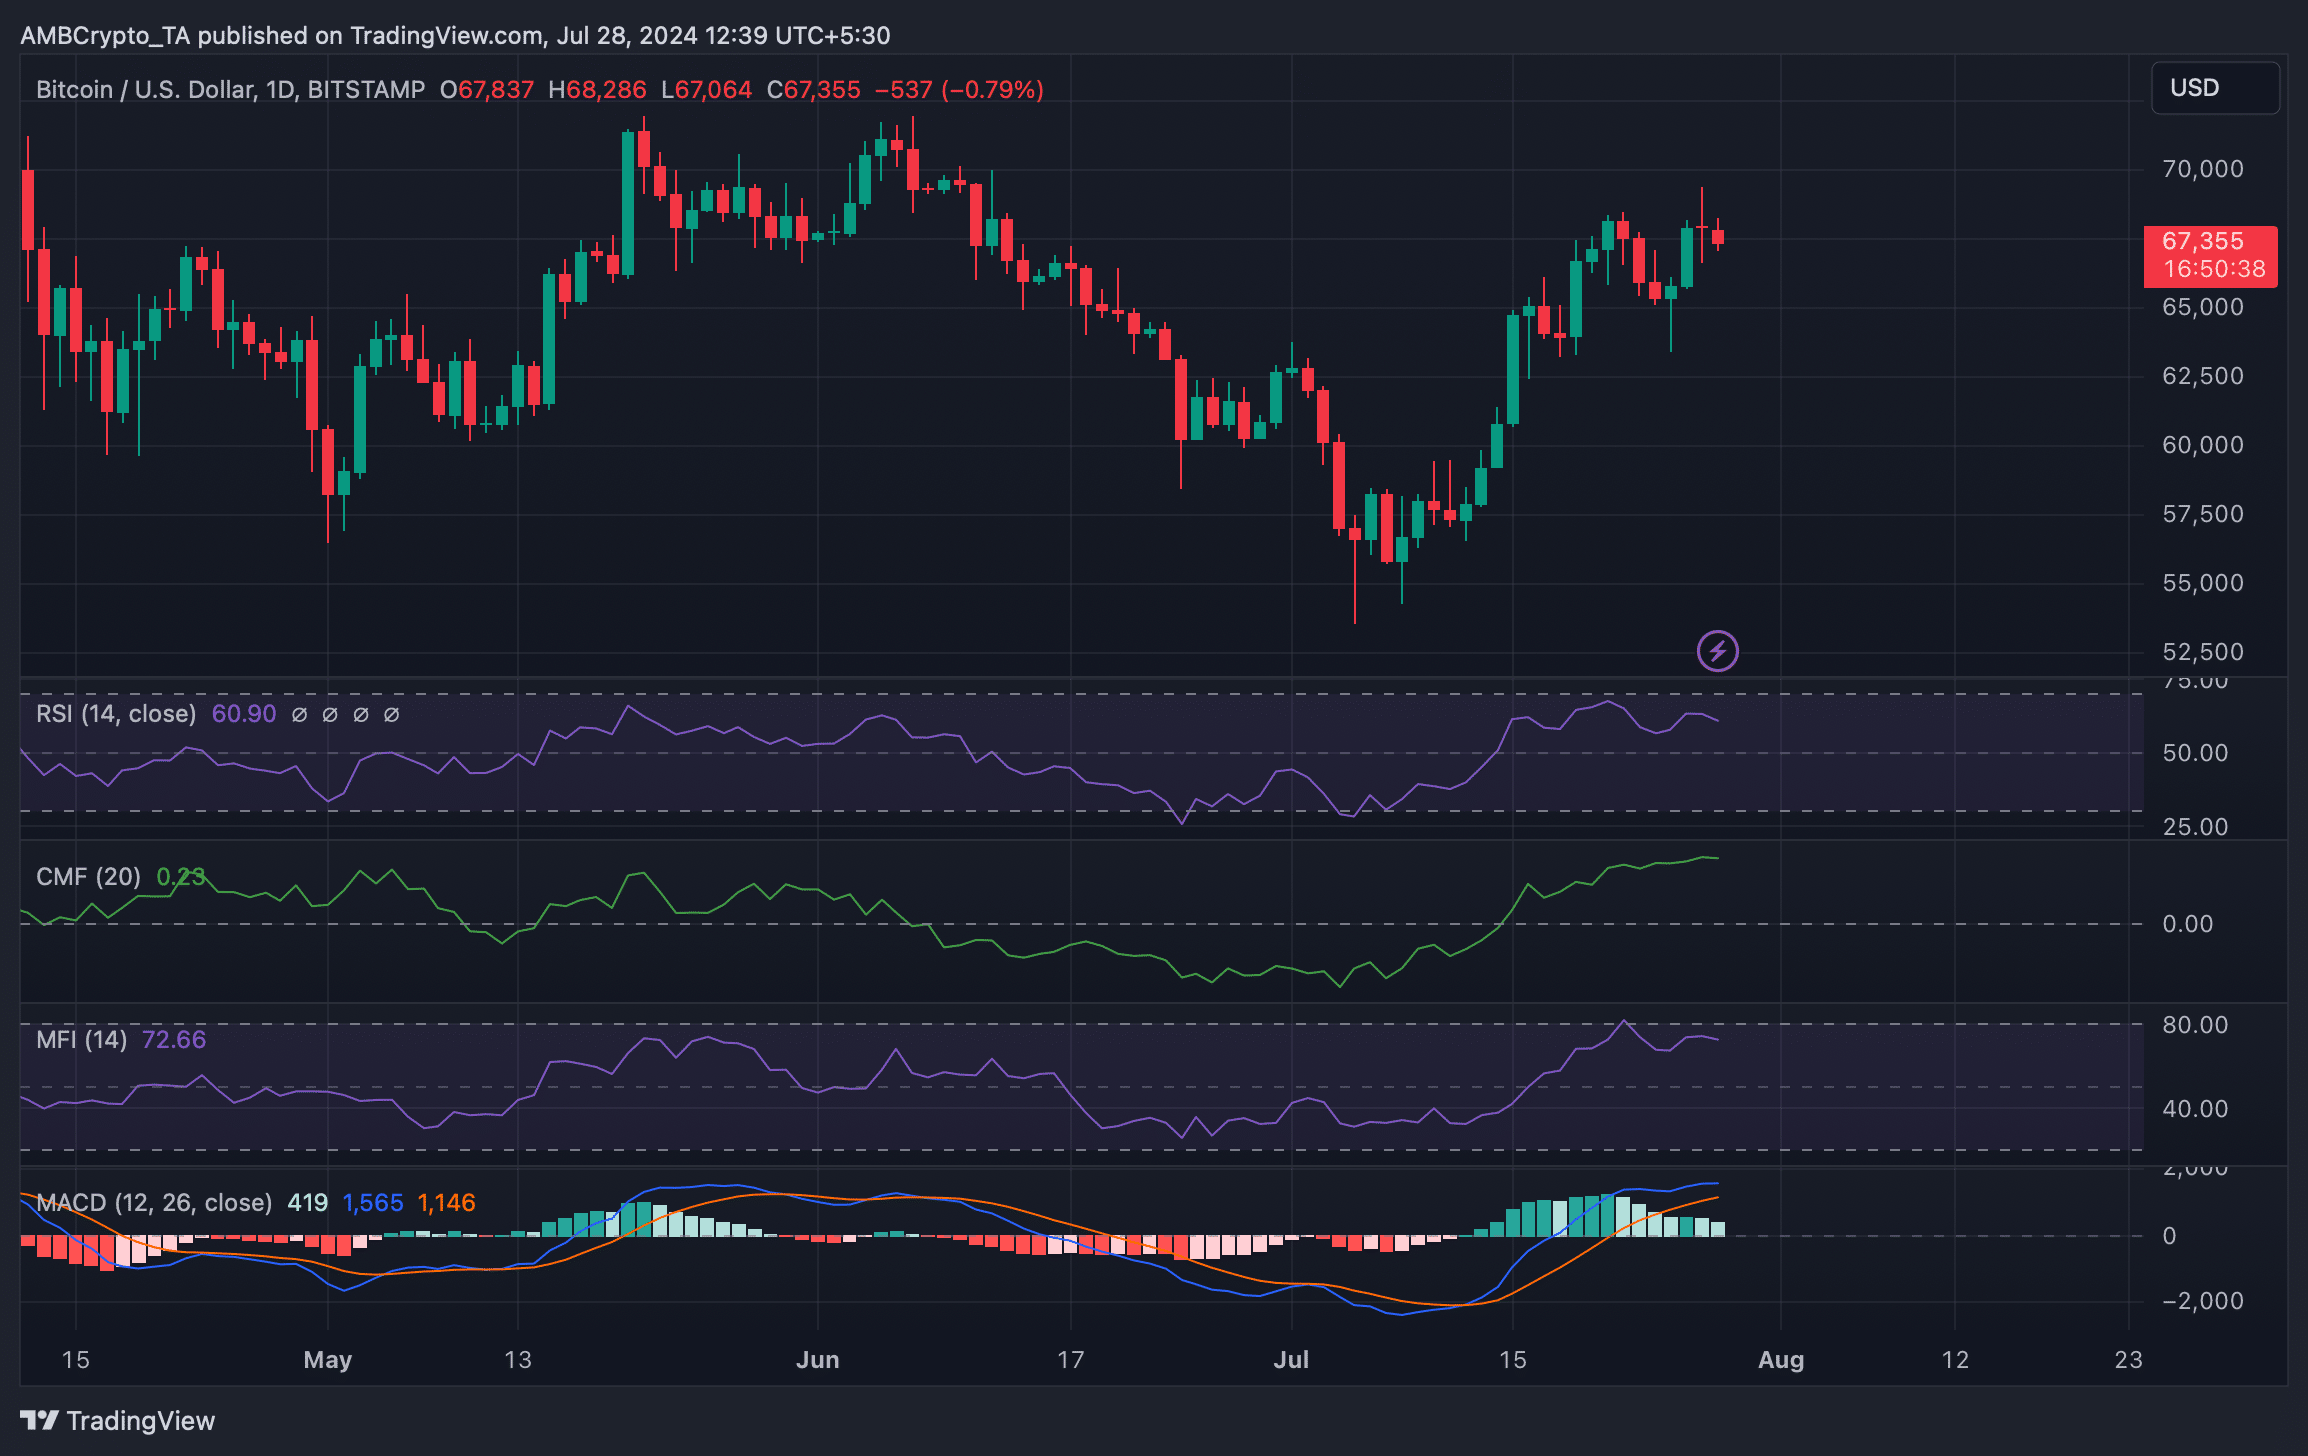
Source: TradingView