![Bitcoin [BTC]: Analyzing the highs and lows of the last 48 hours](https://ambcrypto.com/wp-content/uploads/2023/04/AMBCrypto_An_exhilarating_and_inspiring_scene_set_in_an_amuseme_9504d18d-d0c6-4726-a223-49aadfa65504-1024x683.png)
- Bitcoin experienced wild swings in the past 48 hours, hitting a high of over $30,000 and dropping to around $27,000.
- Despite the fluctuations, the Hodler and 30-day active address metrics showed positives.
In the last two days, Bitcoin (BTC) has been on a wild ride with dramatic price swings that brought it down to the $27,000 mark.
Nevertheless, it’s currently making a valiant effort to bounce back and reclaim its place in the $30,000-price region. Despite the ups and downs, some savvy holders are capitalizing on this market volatility to their advantage.
Read Bitcoin (BTC) Price Prediction 2023-24
Bitcoin’s highs and lows in the last 48 hours
In the run-up to the close of trading on 27 April, the price of Bitcoin (BTC) went on a rollercoaster ride, experiencing some dramatic swings.
Looking at its daily timeframe chart, BTC hit a high point of over $30,000, only to plummet down to approximately $27,000 in the same period. By the end of trading, BTC settled at around $28,500.
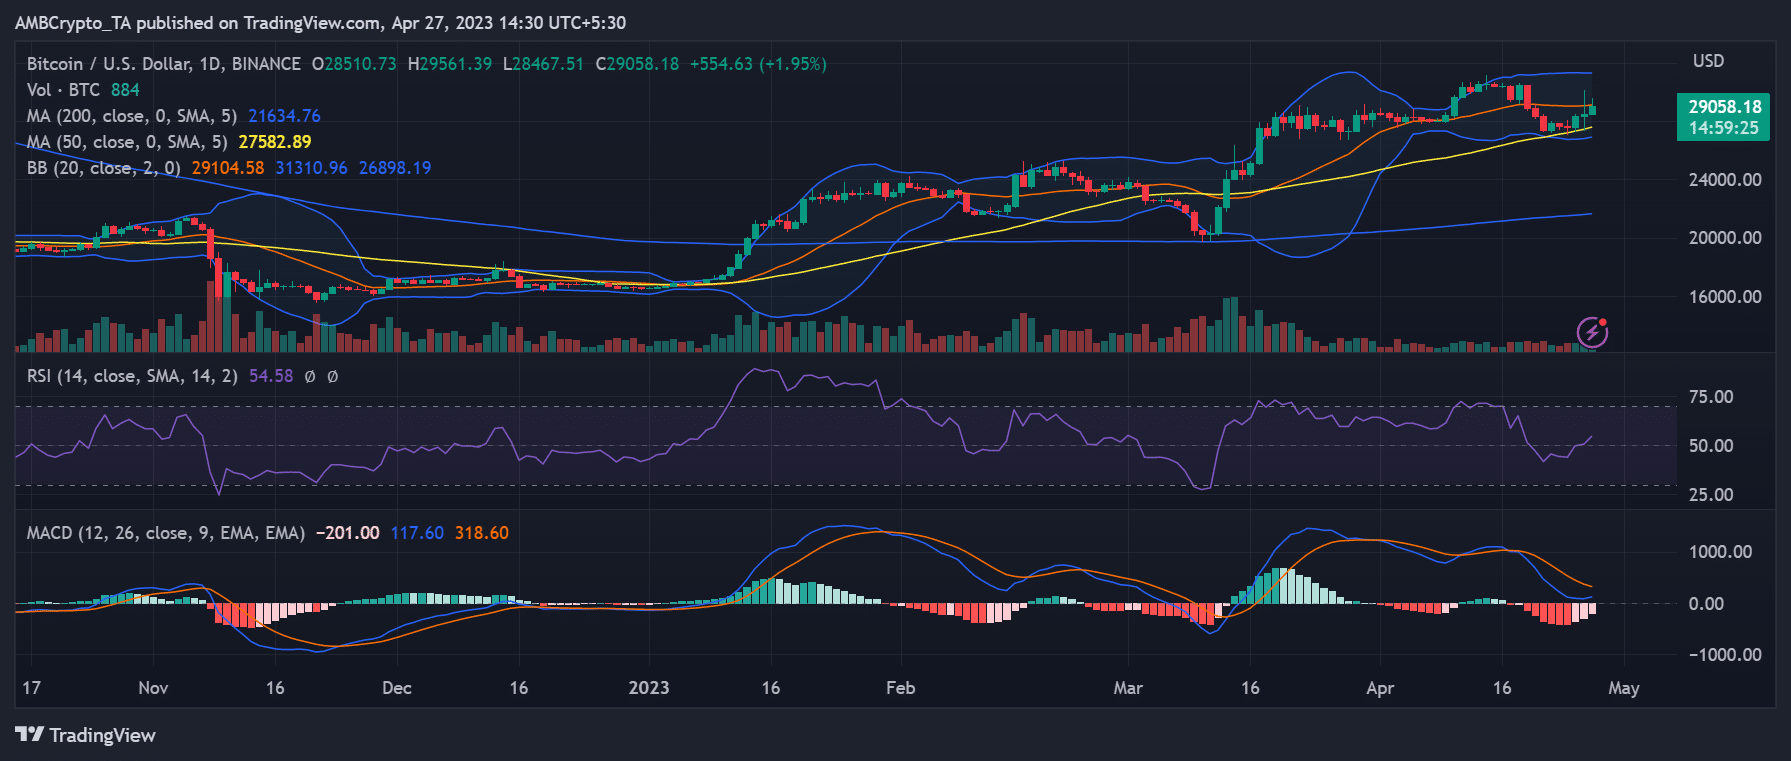
As of this writing, BTC was hovering around $29,000, showing a nearly 2% increase in value. While the Relative Strength Index (RSI) suggested a slightly bullish trend, the Moving Average Convergence Divergence (MACD) was below zero.
The position of the MACD indicated weak price movement despite the bullish flashing of the RSI.
Active addresses on different timeframes
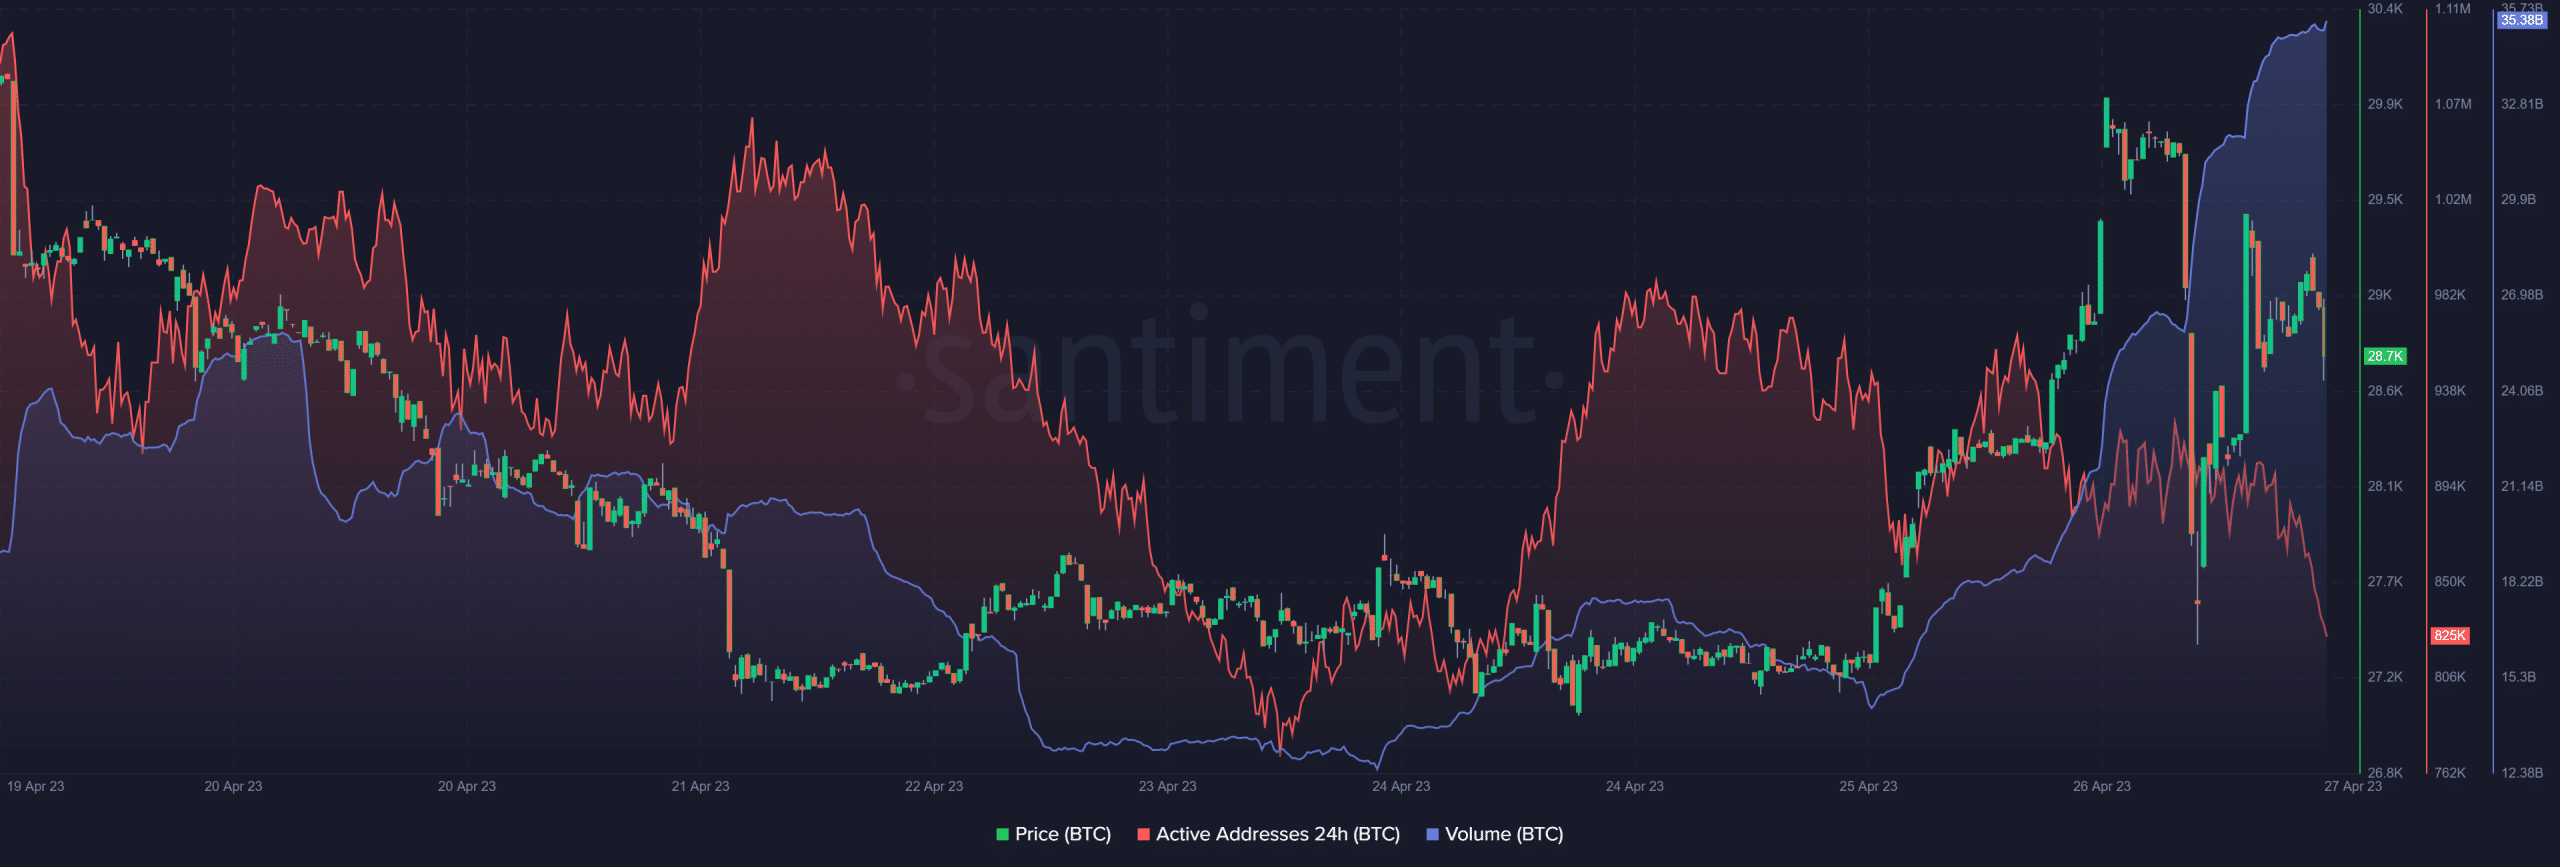
According to data from Santiment, the surge in Bitcoin’s price to the $30,000 range was accompanied by a significant increase in trading volume.
On the other hand, the sudden price drop mirrored the decline of the S&P 500. The market may have been motivated by concerns about an impending recession, with the Federal Open Market Committee (FOMC) meeting, looming the following week.
Furthermore, the data revealed a decreasing 24-hour active address metric, indicating decreased interactions with the asset.
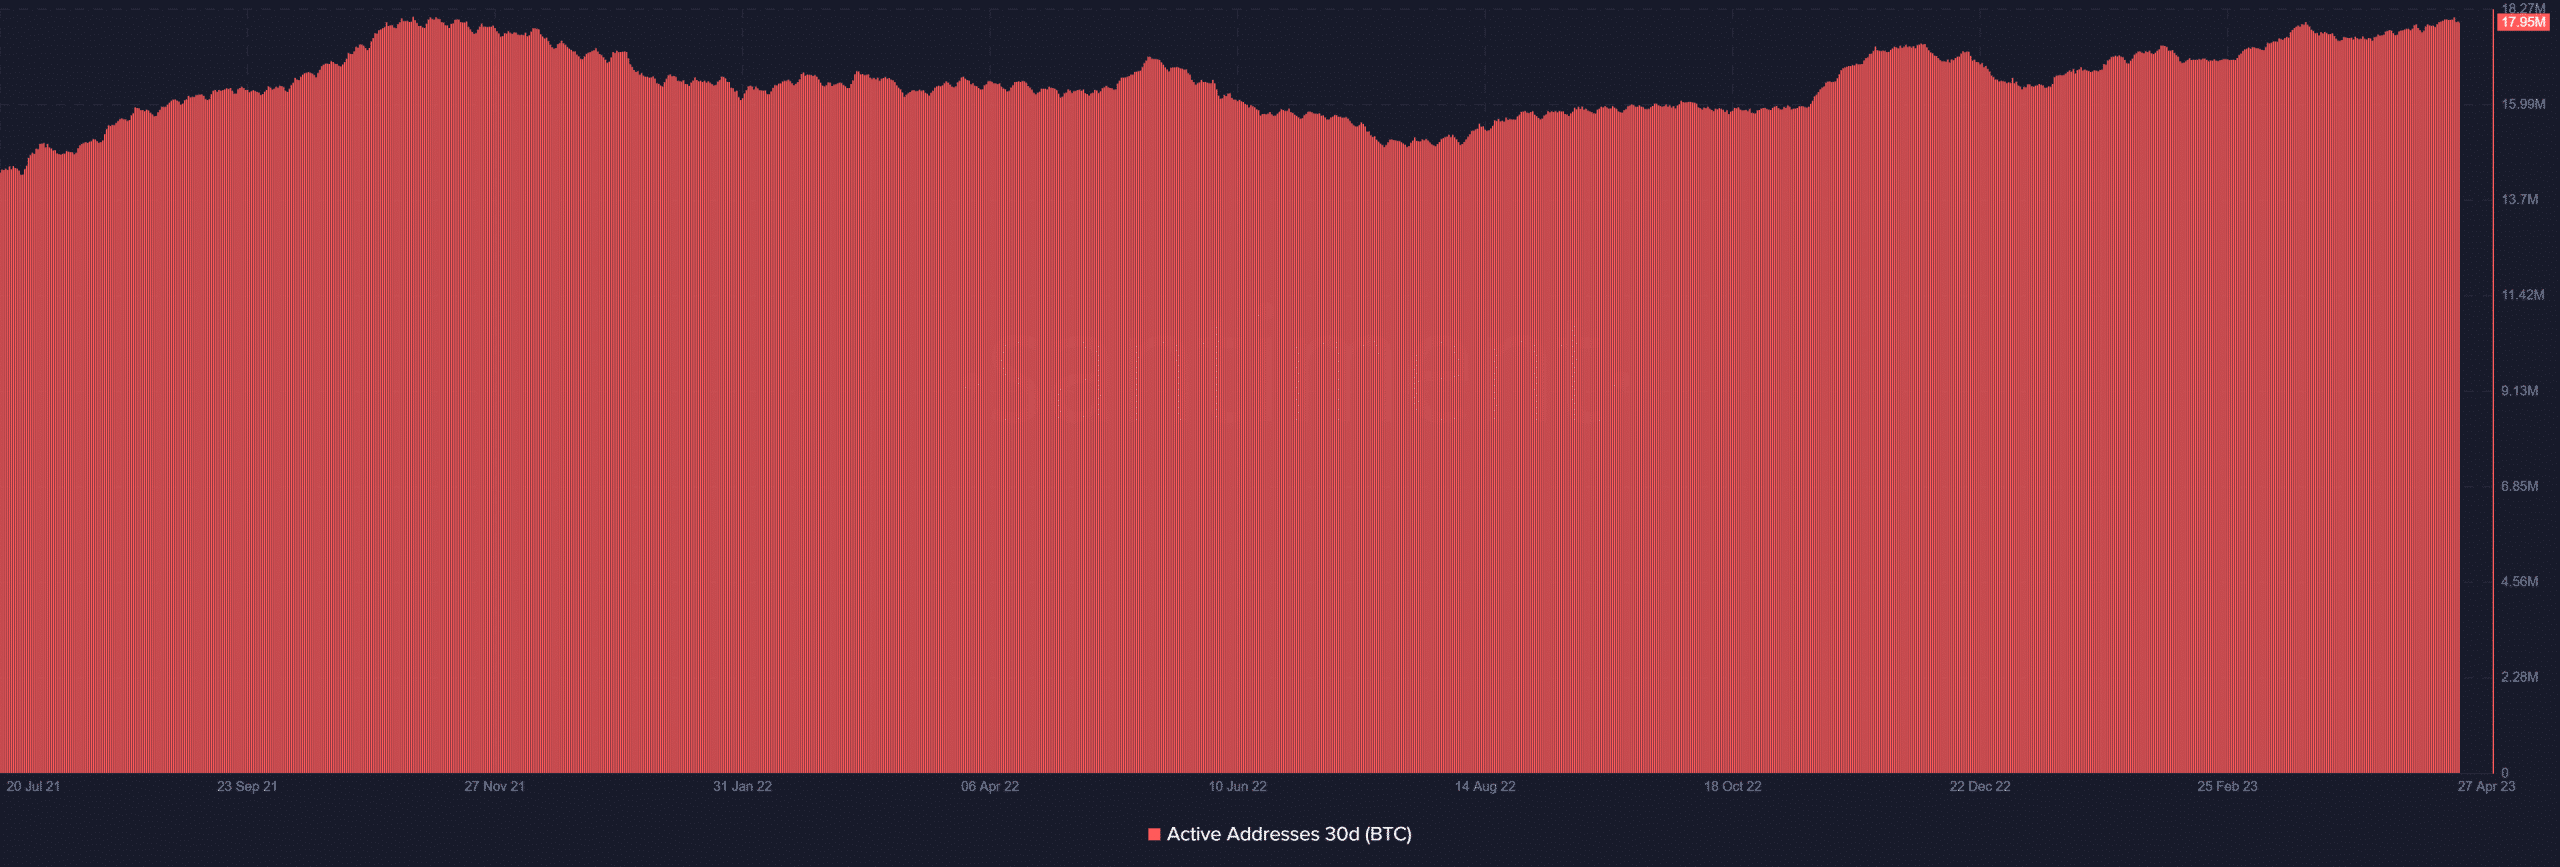
Despite the decrease in 24-hour active addresses, the 30-day version of the metric revealed a more optimistic outlook. The metric showed an upward trend in active addresses over the last 30 days.
Moreover, at its current level, the number of active addresses was higher than any other month in 2022 and parts of 2021.
The metric’s state suggested that despite the decline in daily active addresses, there was still an overall increase in active addresses over a more extended time frame.
How much are 1,10,100 BTCs worth today?
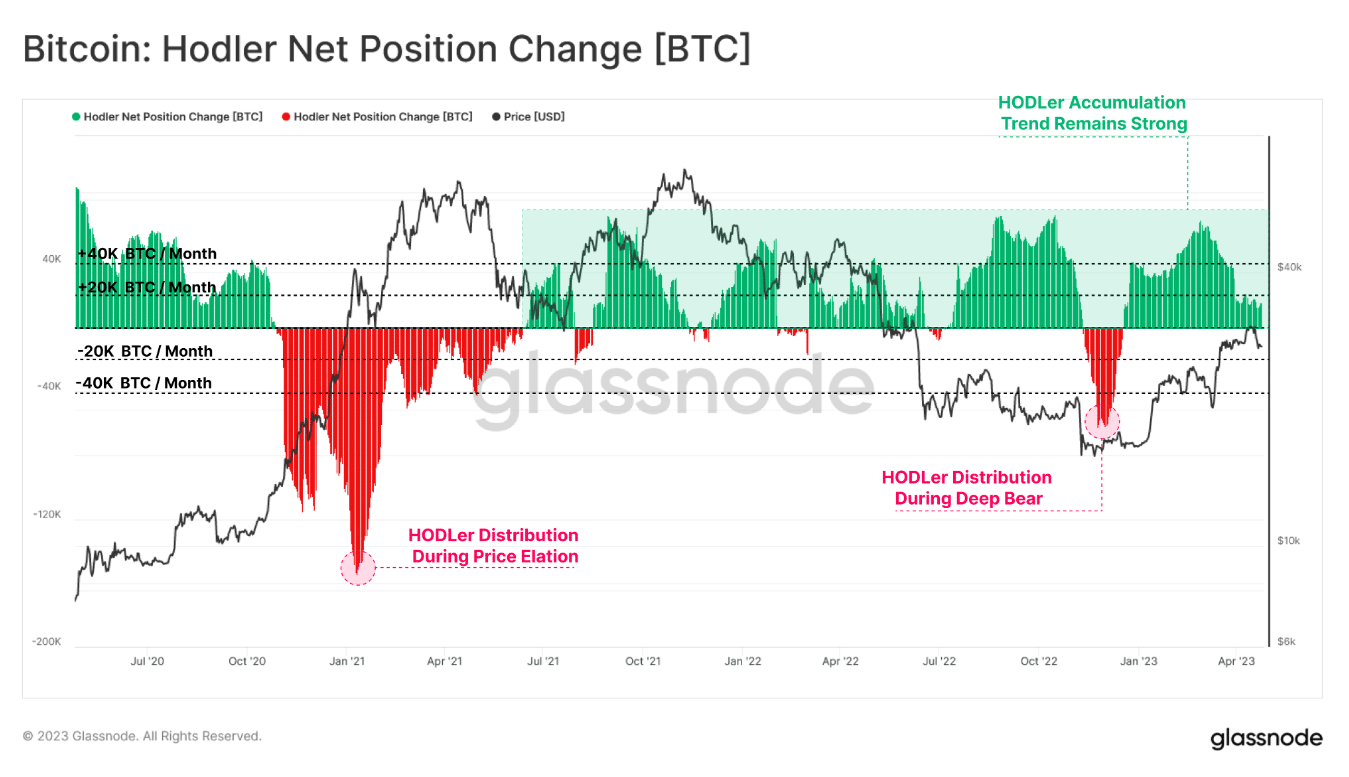
Bitcoin Hodlers continue accumulation
Furthermore, if there was ever an indication that the recent price dip presented an accumulation opportunity, the Hodler metric provides it.
Recent data from Glassnode revealed an increase in the accumulation rate by BTC Hodlers. The chart displayed a consistent net position change on the upside, despite the price dip and apparent fluctuations, reflecting a sustained accumulation phase.
Despite recent market volatility, the metric suggested that Hodlers remained optimistic about Bitcoin’s long-term potential.