Bitcoin [BTC] bears show signs of weakness as this metric slows down
![Bitcoin [BTC] long liquidations soar as price crashes below $23k, more inside](https://ambcrypto.com/wp-content/uploads/2023/02/btc-michael-1-e1677240417199.jpg)
A few days ago, it became apparent that Bitcoin [BTC] was in a price-RSI divergence pattern. This was an indication of relative trend weakness for the bears, and one that would give way to a retracement. Fast forward to the present, and that retracement is here, but the bears, too, are now showing some weakness.
Is your portfolio green? Check out the Bitcoin Profit Calculator
Bitcoin’s $23,909 press time price represented a 5.4% drop from its recent high, which was also its current 2023 high. This might not be much in the grand scheme of retracements, but it is an indication of low sell pressure. This is not surprising considering the bullish expectations in the market.
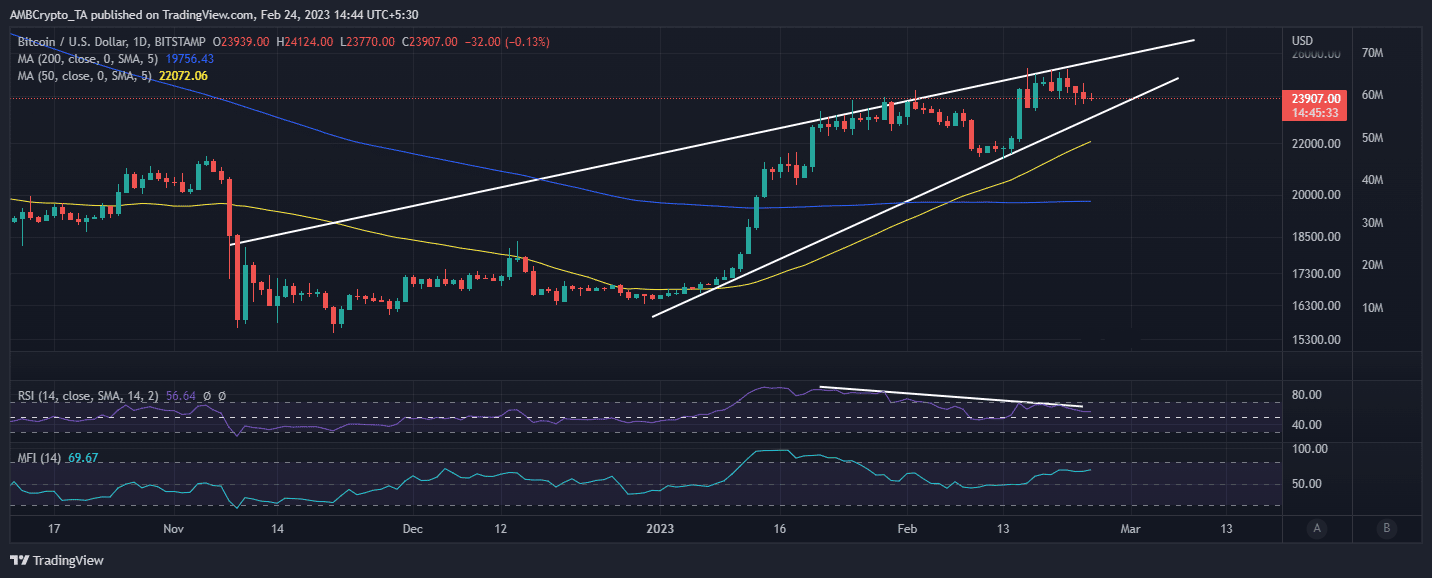
If Bitcoin maintained its press time pattern, then the next buy wall could be expected near the $23,500 price level. This was the same price range where the price bounced back on 16 February and the same level previously acted as a resistance range. There were some key observations that perfectly summed up BTC’s performance.
Exchange flow characteristics reveal this about Bitcoin
Bitcoin exchange flows have been leaning in favor of the bears for the last few days. However, the sell pressure has declined significantly each day. The latest Glassnode alerts keeping track of daily on-chain flows reveals that Bitcoin’s net flows for 24 February added up to -$29.5 million.
📊 Daily On-Chain Exchange Flow#Bitcoin $BTC
➡️ $687.8M in
⬅️ $717.3M out
📉 Net flow: -$29.5M#Ethereum $ETH
➡️ $363.8M in
⬅️ $341.2M out
📈 Net flow: +$22.6M#Tether (ERC20) $USDT
➡️ $587.7M in
⬅️ $659.8M out
📉 Net flow: -$72.0Mhttps://t.co/dk2HbGwhVw— glassnode alerts (@glassnodealerts) February 24, 2023
The same tracker revealed that Bitcoin had a net flow of -$40.1 in the previous day and +$52.9 million the day before. This confirmed a return of overall sell pressure, but it slowed down at press time. This was confirmed by the exchange inflow metric, but exchange outflows also demonstrated a similar outcome.
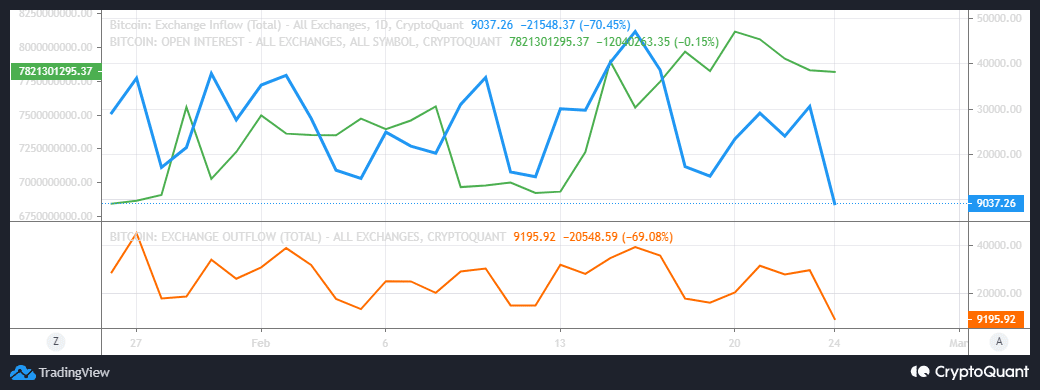
The latest exchange flow data reveals that exchange outflows were slightly higher than inflows. Also, Open Interest has been declining for the last few days, but it levelled out at the time of writing. A potential pivot in derivatives demand might be on the cards.
How many are 1,10,100 BTCs worth today?
Are bulls ready to take over?
Perhaps a look at where most purchasing power comes from may offer some useful insights. Bitcoin’s supply distribution reveals that addresses holding between 1,000 – 10,000 BTC pivoted during yesterday’s trading session and were accumulating at press time.
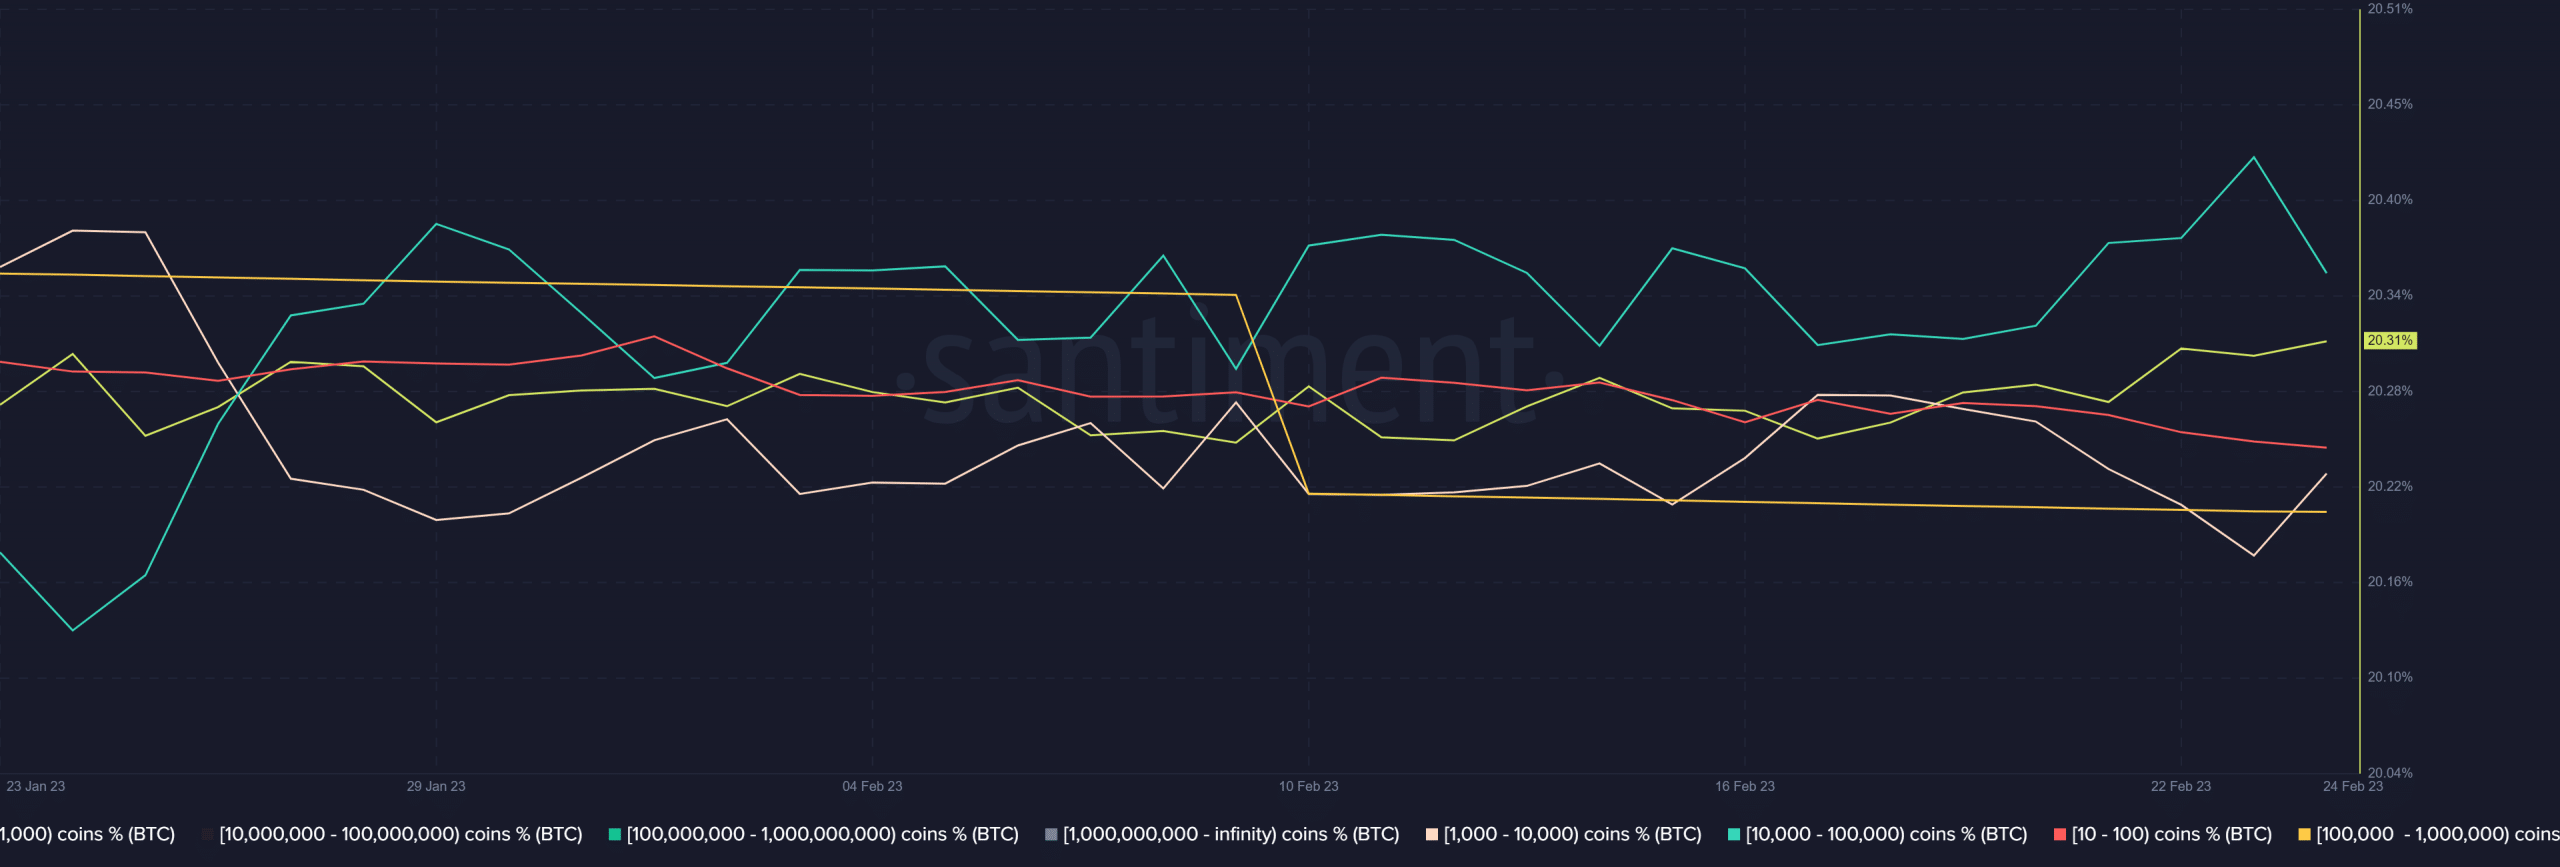
This observation was important because the same address category controlled the largest supply of BTC in circulation. The reason why a bullish move has not commenced despite this observation is that addresses holding over 10,000 BTC have been doing the opposite, thus contributing to sell pressure.