Bitcoin [BTC] forms a near-term bull flag; bids can be placed at…
![Bitcoin [BTC] forms a near-term bull flag; bids can be placed at...](https://ambcrypto.com/wp-content/uploads/2023/01/PP-1-BTC-cover-e1674630185426.jpg)
Disclaimer: The information presented does not constitute financial, investment, trading, or other types of advice and is solely the writer’s opinion.
- The bull flag indicated $24.2k as a target.
- The presence of a bullish breaker offered greater support to BTC.
Bitcoin [BTC] noted impressive gains in January 2023. During Christmas 2022 and New Year 2023, Bitcoin consolidated around the $16.5k mark. In late November 2022, the $15.4k mark was defended, and the price bounced as high as $17.8k to show some bullish impetus.
Read Bitcoin’s [BTC] Price Prediction 2023-24
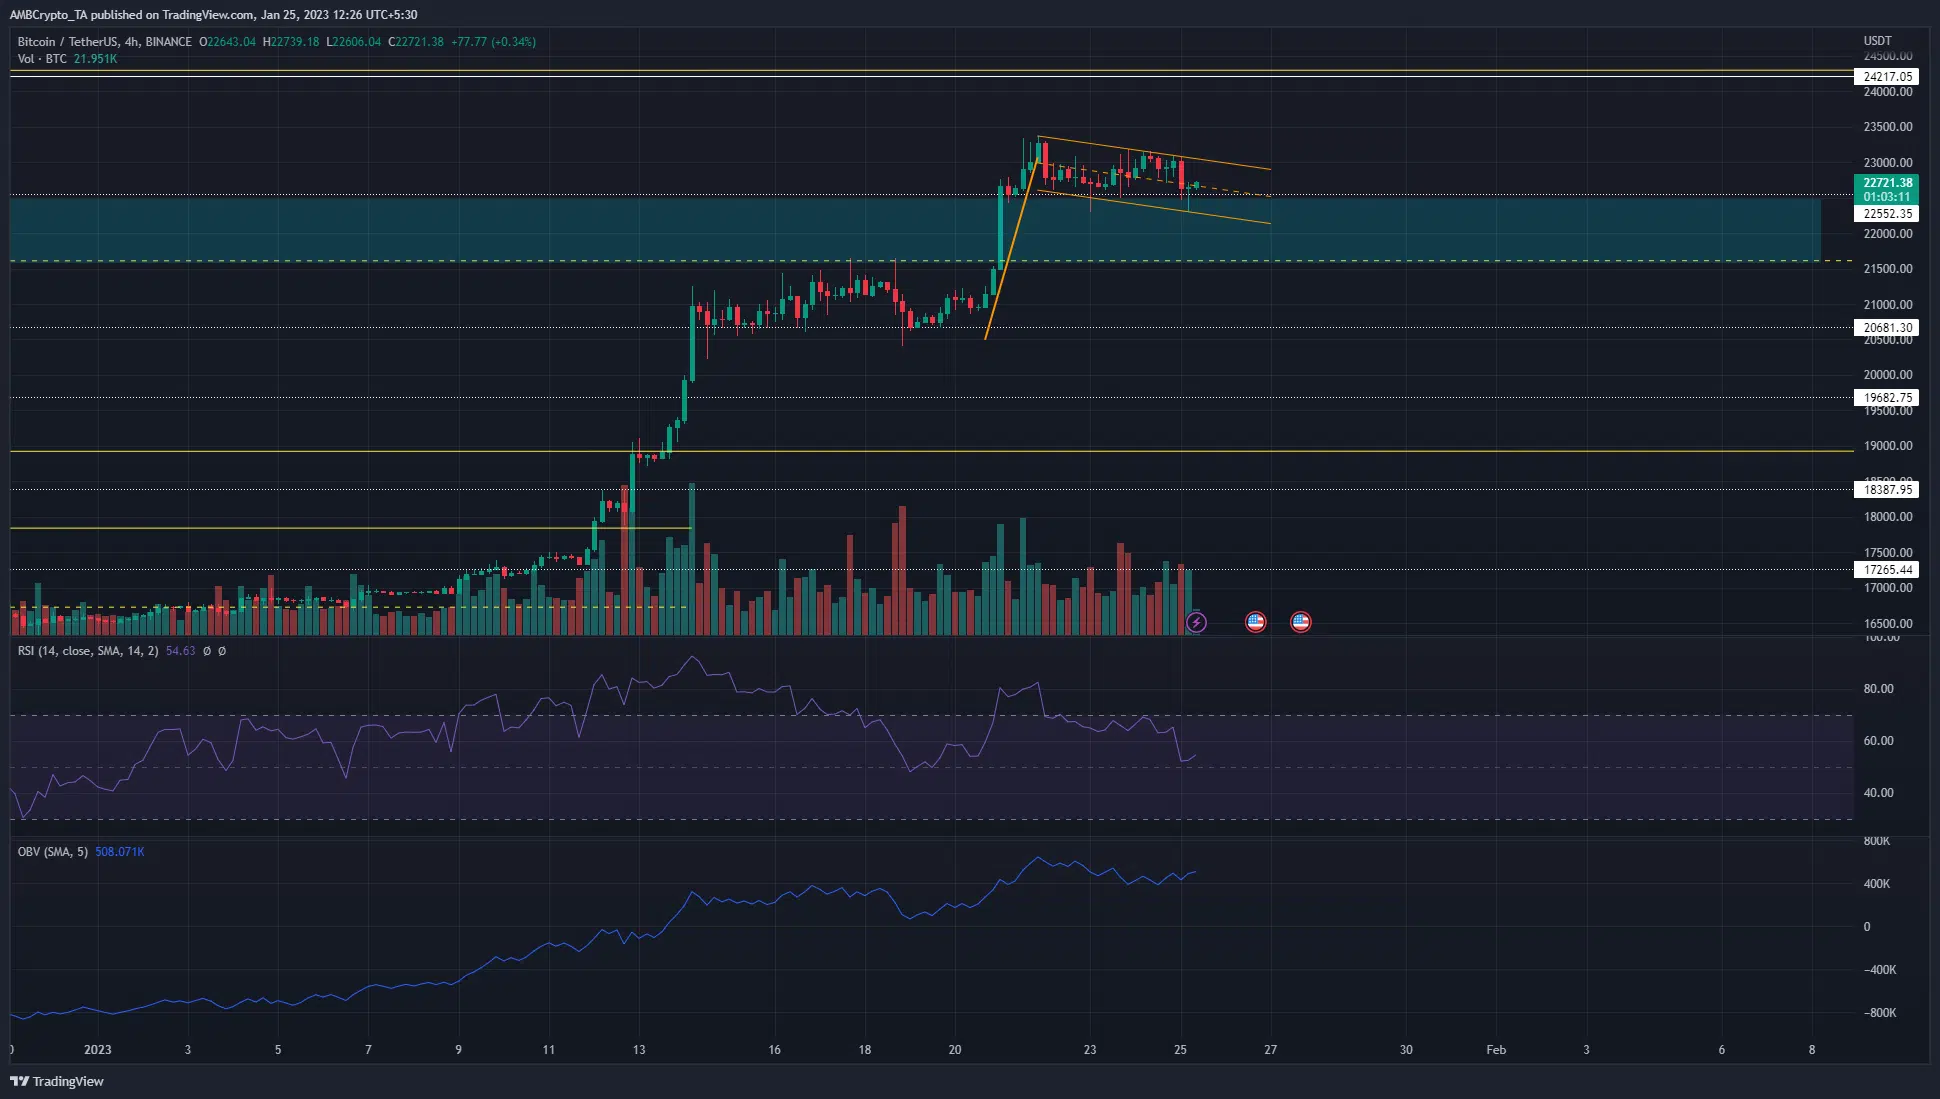
Throughout January, the technical indicators showed buying pressure has built up behind the king of crypto. The rising OBV highlighted the demand behind BTC. Continuation of this bullish pressure was expected, and a move higher to $24.3k seemed likely.
Bull flag and support indicated that further upside was likely
The bull flag formed over the past few days was highlighted in orange. A four-hour trading session close above the flag would likely see BTC breakout to reach $24.8k. To the south, the bullish breaker on the daily timeframe alongside the mid-range mark at $21.6k meant BTC had solid support.
Is your portfolio green? Check the Bitcoin Profit Calculator
The aforementioned range was one that BTC traded within from June to November. It extended from $18.9k to $24.3k and the mid-point of the range was at $21.6k. These are significant support and resistance levels for BTC in the coming weeks.
A breakout past $24.3k would indicate that BTC could rally as high as $26.7k-$29.5k over the next month. Meanwhile, a session close beneath the bull flag would likely mean that consolidation was the path for Bitcoin in the next few days.
A drop below $21.6k would break the higher timeframe market structure and the daily breaker and flip the bias to bearish. The four-hour chart’s OBV has only noted a minor pullback, and the RSI was above neutral 50. Hence, the bulls still have some fight left in them.
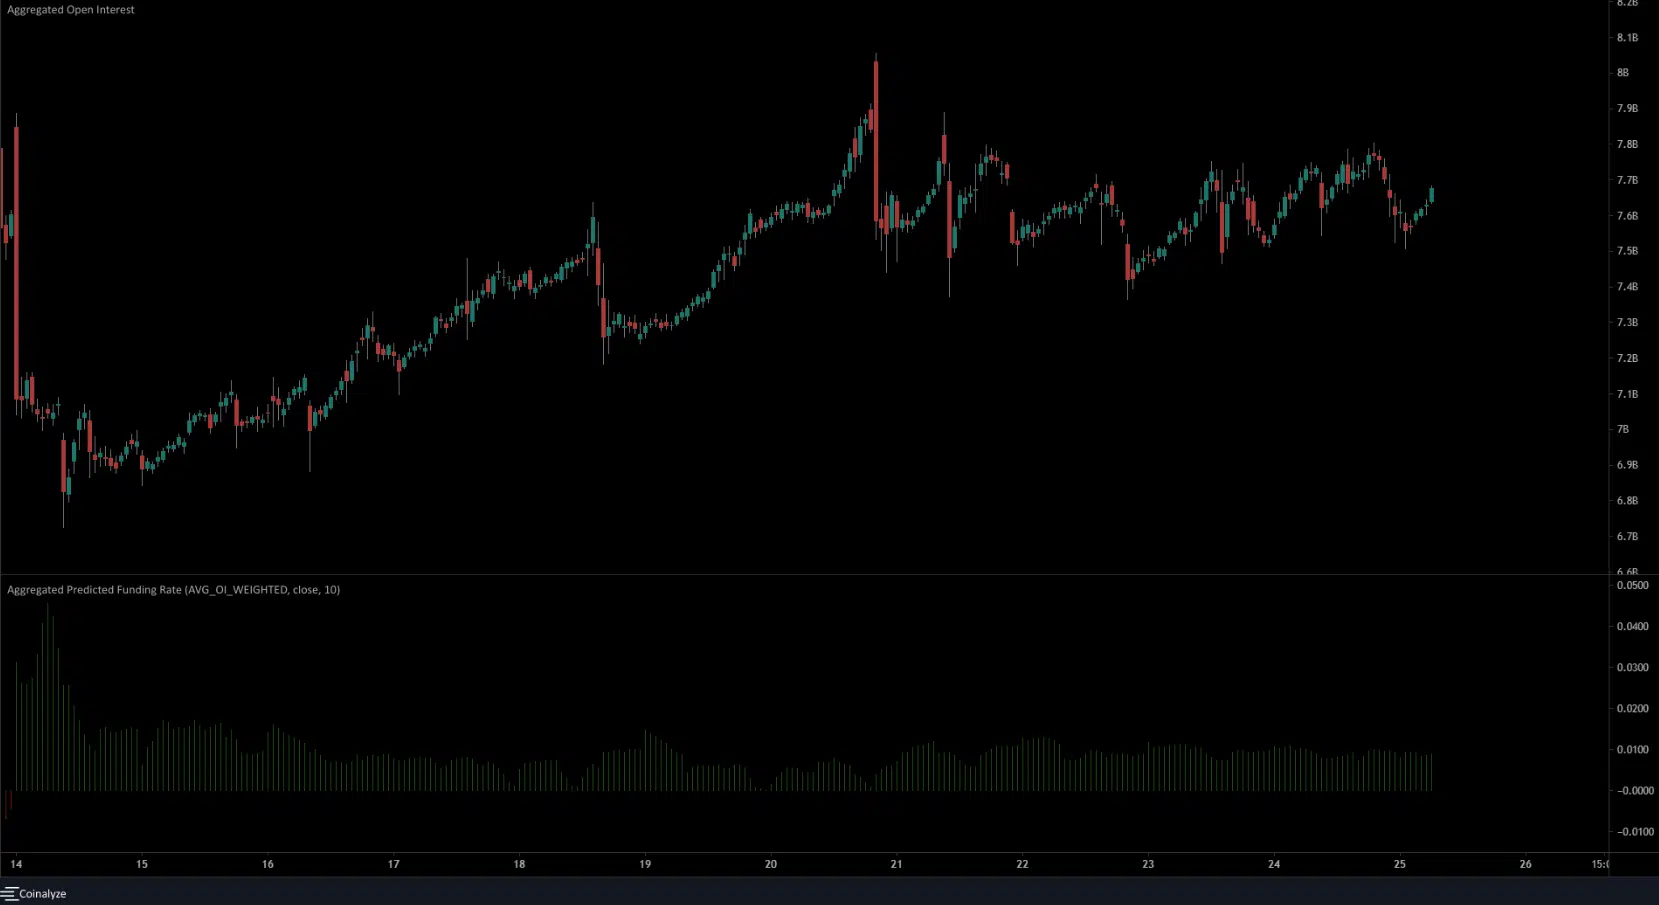
Open Interest remains flat as market participants wait for a breakout

Source: Coinalyze
The consolidation during the festive period a month earlier did not give any signs of the direction of the next move for Bitcoin. This was resolved when BTC broke the market structure on January 12 and shot past the $17.8k mark.
Although the price has consolidated on lower timeframes in the past four days, it continued to have a bullish bias. The Open Interest has been flat since January 21, and the price was also unable to ascend past $23.3k. The predicted funding rate was also positive.
A revisit to the near-term liquidity pocket at $22.2k is likely to offer a good risk-to-reward buying opportunity.


