Bitcoin [BTC] sweeps July lows; is a recovery around the corner

Disclaimer: The information presented does not constitute financial, investment, trading, or other types of advice and is solely the writer’s opinion.
In the past 24 hours, $198 million worth of positions in the crypto futures market were liquidated, according to data from Coinglass. Of this amount, $30m can be attributed to Bitcoin pairs.
With BTC unable to hold on to the $20k mark, can bulls expect some relief over the next few days? The price charts showed that a key resistance level if flipped to support, could pave the way for further gains.
BTC- 4-Hour Chart
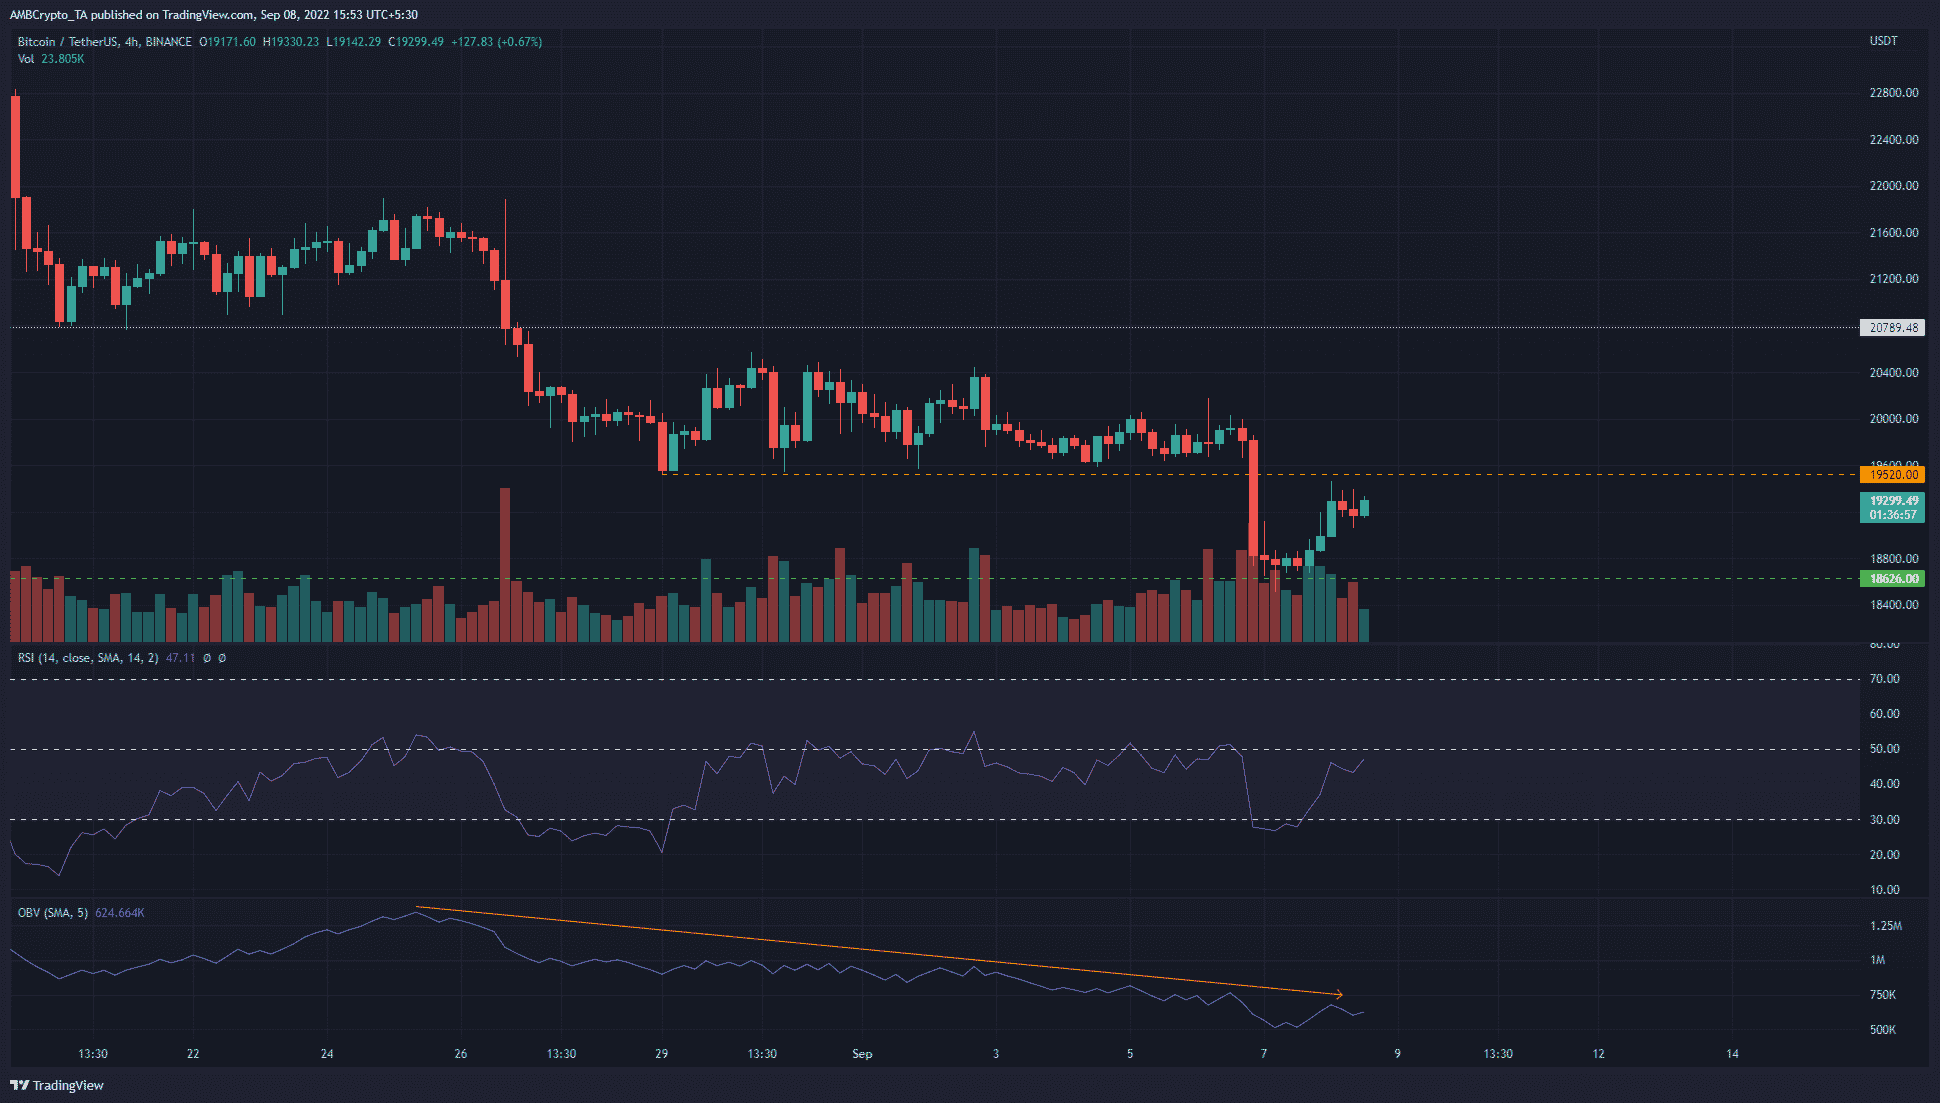
On the 4-hour chart, there were two levels of significance marked. One was support from early July at $18.6k. The other was a resistance level at $19.5k, formerly support, that had held the bears at bay in late August.
In the past few days, BTC plunged right beneath this support level, and at the time of writing, it rose toward this level once more.
The RSI was not yet above the neutral 50 mark to highlight bullish momentum. At the same time, the OBV was also on a steady downtrend. The lack of demand could likely contribute to a rejection at the $19.5k mark.
BTC- 1-Hour Chart
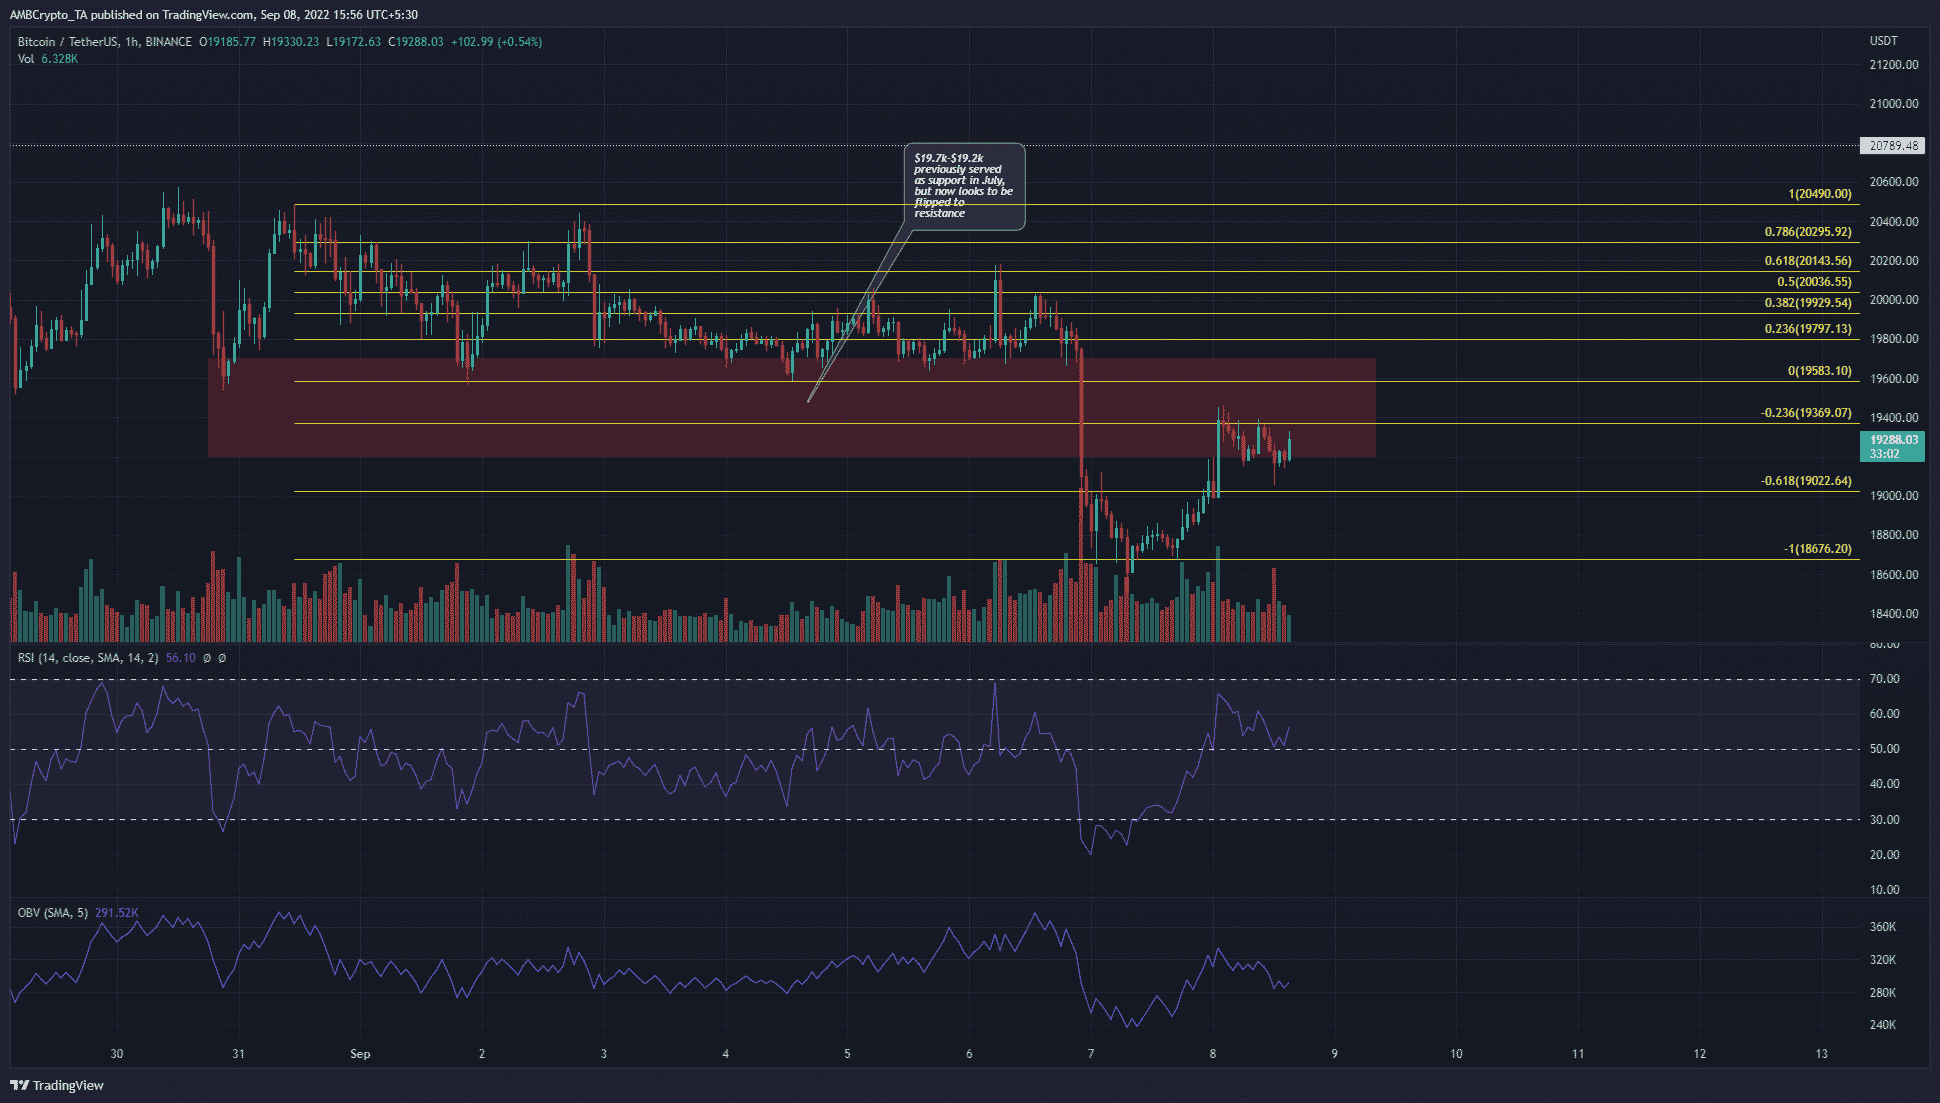
On the 1-hour chart, a set of Fibonacci retracement levels (yellow) were plotted based on the move down from $20,490 to $19,797. The tool plotted the 61.8% and 100% extension levels at $19,022 and $18,676.
In the past couple of days, both of these levels have acted as support and resistance. This highlighted their importance.
At the time of writing, BTC was trading beneath the $19,369 mark and was within the resistance zone marked in red as well. This resistance zone from $19.2k-$19.7k had served as a demand zone back in June and July.
Conclusion
Can Bitcoin traders expect a move past $19.5k or below $18.6k? Compelling arguments can be made for either scenario. From $19.2k to $19.6k, a zone of resistance can be expected. Yet, because of the bounce from the July lows in recent hours, a move toward $19.6k and $20.8k to collect liquidity could be possible.


