Bitcoin [BTC]: What history tells us about assessing bottom formation
![Bitcoin [BTC]: What history tells us about assessing bottom formation](https://ambcrypto.com/wp-content/uploads/2022/11/jievani-weerasinghe-NHRM1u4GD_A-unsplash-1.jpg)
Following a prolonged period of extremely low volatility that caused the leading coin Bitcoin [BTC], to trade in a tight range since early September, its price rallied above the $20,000 level during last week’s trading session. The king coin traded as high as $20,961, and doubts about whether the bottom had been reached re-emerged.
In a new report, Glassnode, while considering a few on-chain metrics, assessed BTC’s prior cycle lows and sought a comparison with the current bear market to determine whether the current market was “hammering out a Bitcoin bottom.”
Is the bottom in yet?
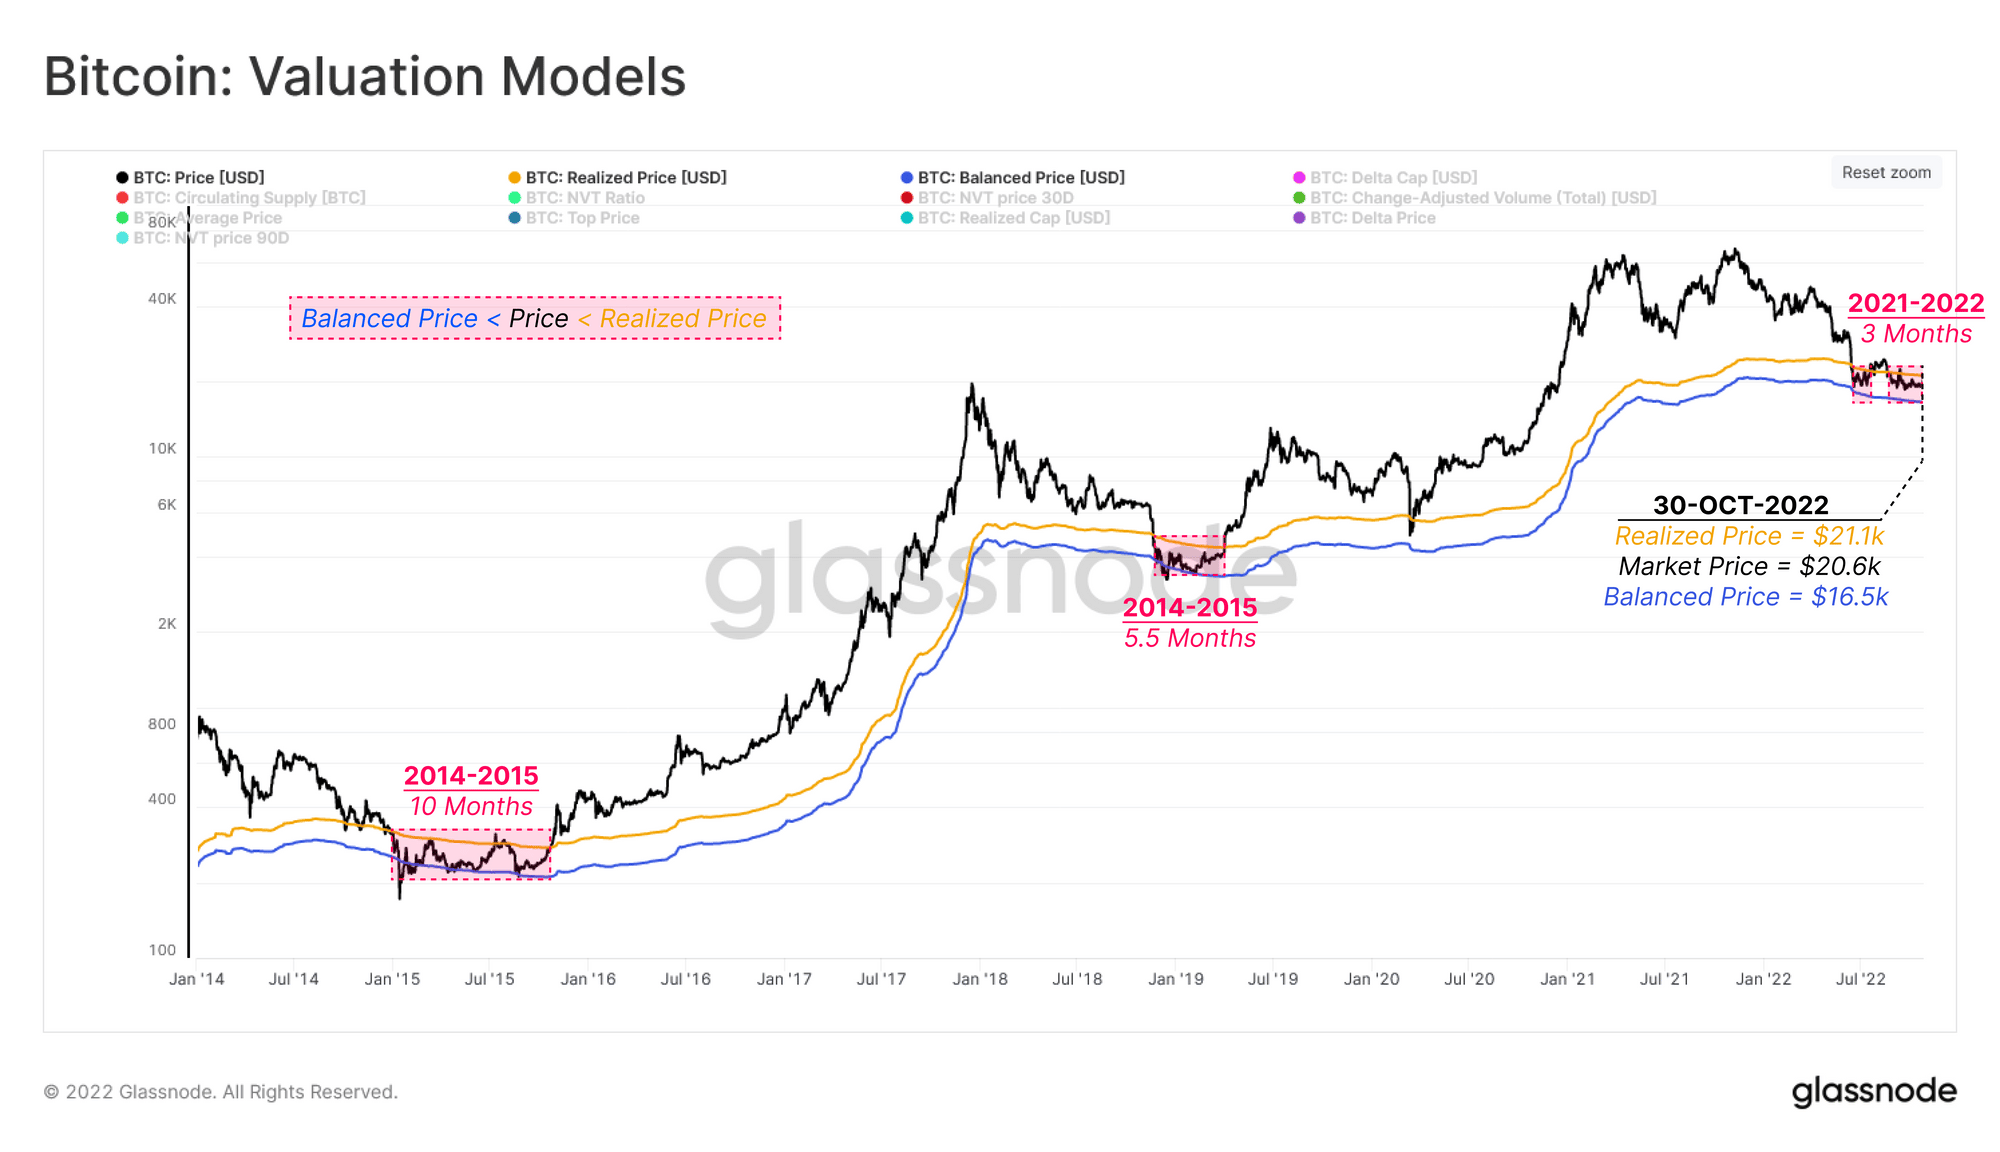
According to Glassnode, two key metrics used for approximating the range bottoming formation are the Realized Price and the Balanced Price.
An asset’s Realize Price can be described as the asset’s average acquisition price per coin. When an asset trades below this price, the aggregate market is said to be in unrealized loss. As of this writing, BTC’s Realized Price stood at $21,105.
As per the report, an asset’s Balanced Price refers to the difference between its Realized Price and Transferred Price. This, in essence, calculates the difference between how much a coin was acquired and how much it was sold. At press time, this stood at $16,513.
Glassnode found that BTC’s price has fluctuated within these ranges for about three months. However, in comparison to prior bear cycles where BTC lasted in these ranges between 5.5 and 10 months, Glassnode noted that “this suggests duration may remain a missing component from our current cycle.”
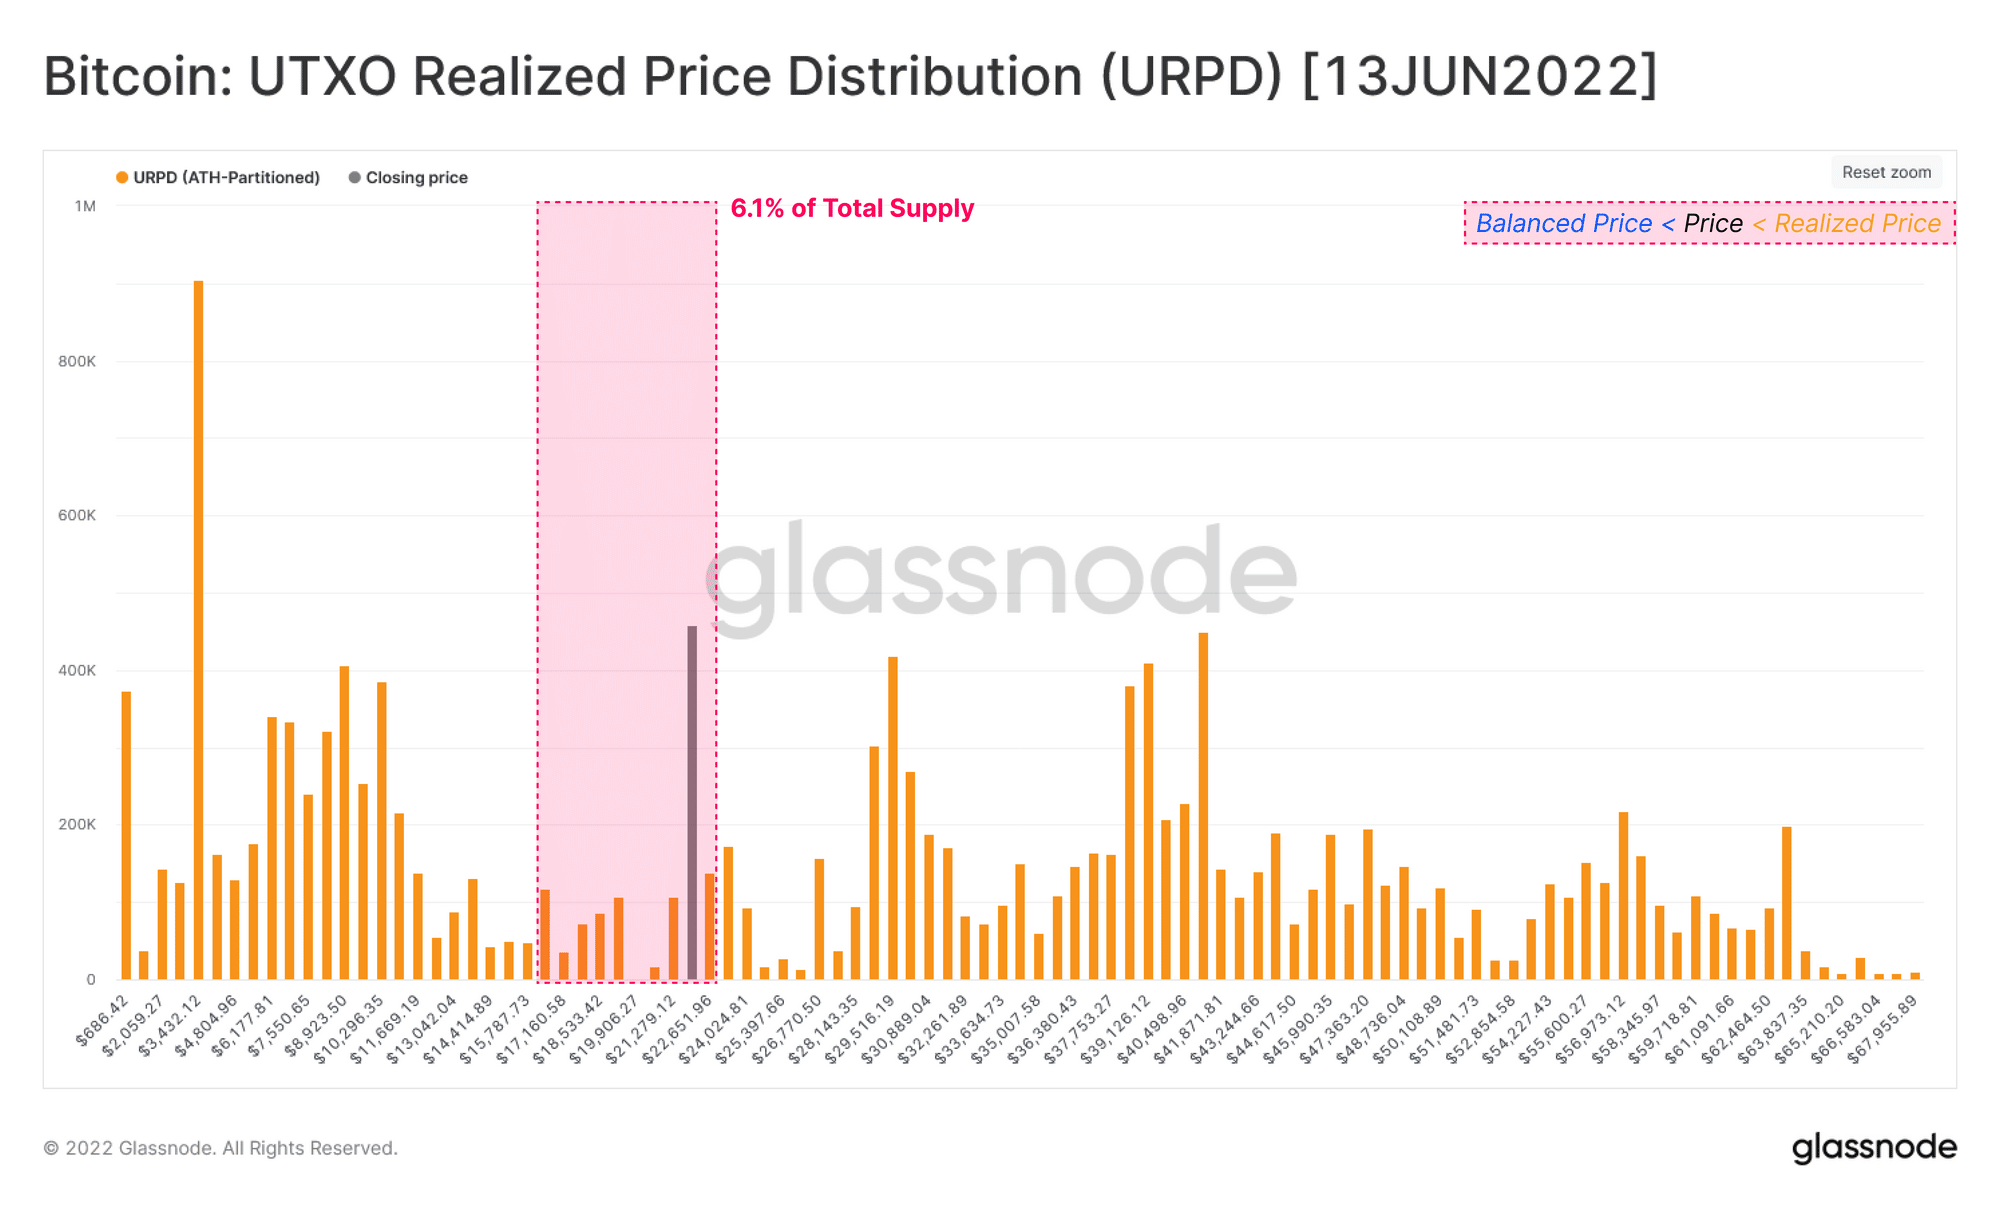
Glassnode found further that another key metric in assessing whether the bottom was in was the UTXO Realized Price Distribution (URPD). This is used to determine how BTC changes hands during the bottom discovery phase as more investors record losses on BTC holdings.
According to Glassnode, during the 2018-2019 bottom discovery phase, about 22.7% of BTC’s total supply was redistributed as spot prices. In the current market, only 14.0% of the supply has been redistributed since the price fell below the Realized Price in July, with 20.1% of the coin’s total supply that had been acquired in this price range. Comparing this to the 2018-19 cycle, Glassnode noted that,
“Both the magnitude of wealth redistribution and the final supply concentration at the bottom are somewhat lower in the 2022 cycle. This adds further evidence to the case that additional consolidation and duration may still be required to fully form a bear market floor. That said, the redistribution which has occurred to date is significant and certainly indicates that a resilient holder base is actively accumulating within this range.”
As per data from CoinMarketCap, BTC traded at $20,590.39 at the time of writing. Its price was up by 0.1% in the last 24 hours, and its trading volume was up by 37% within the same period.


