Bitcoin

Bitcoin struggles to breach $86.8k resistance – Will bears stage a comeback?
Posted:
Journalist

- Bitcoin has a bearish 1-day structure but showed chances of a price bounce toward $88k.
- The liquidation heatmap showed that bulls should be cautious of taking long positions on BTC.
Bitcoin [BTC] has traded above the $82k support level over the past week, but it did not have a bullish outlook on the 1-day timeframe.
Lower timeframes showed there was some hope for a bounce, provided the $86.8k resistance was breached.
The Fibonacci retracement levels from the August-December rally showed that the $72k support level could be the next target. However, on-chain metrics did not support this doom-and-gloom outlook.
Long-term holders preferred to HODL than sell, meaning there was some hope for recovery.
Is Bitcoin poised for another downward move?
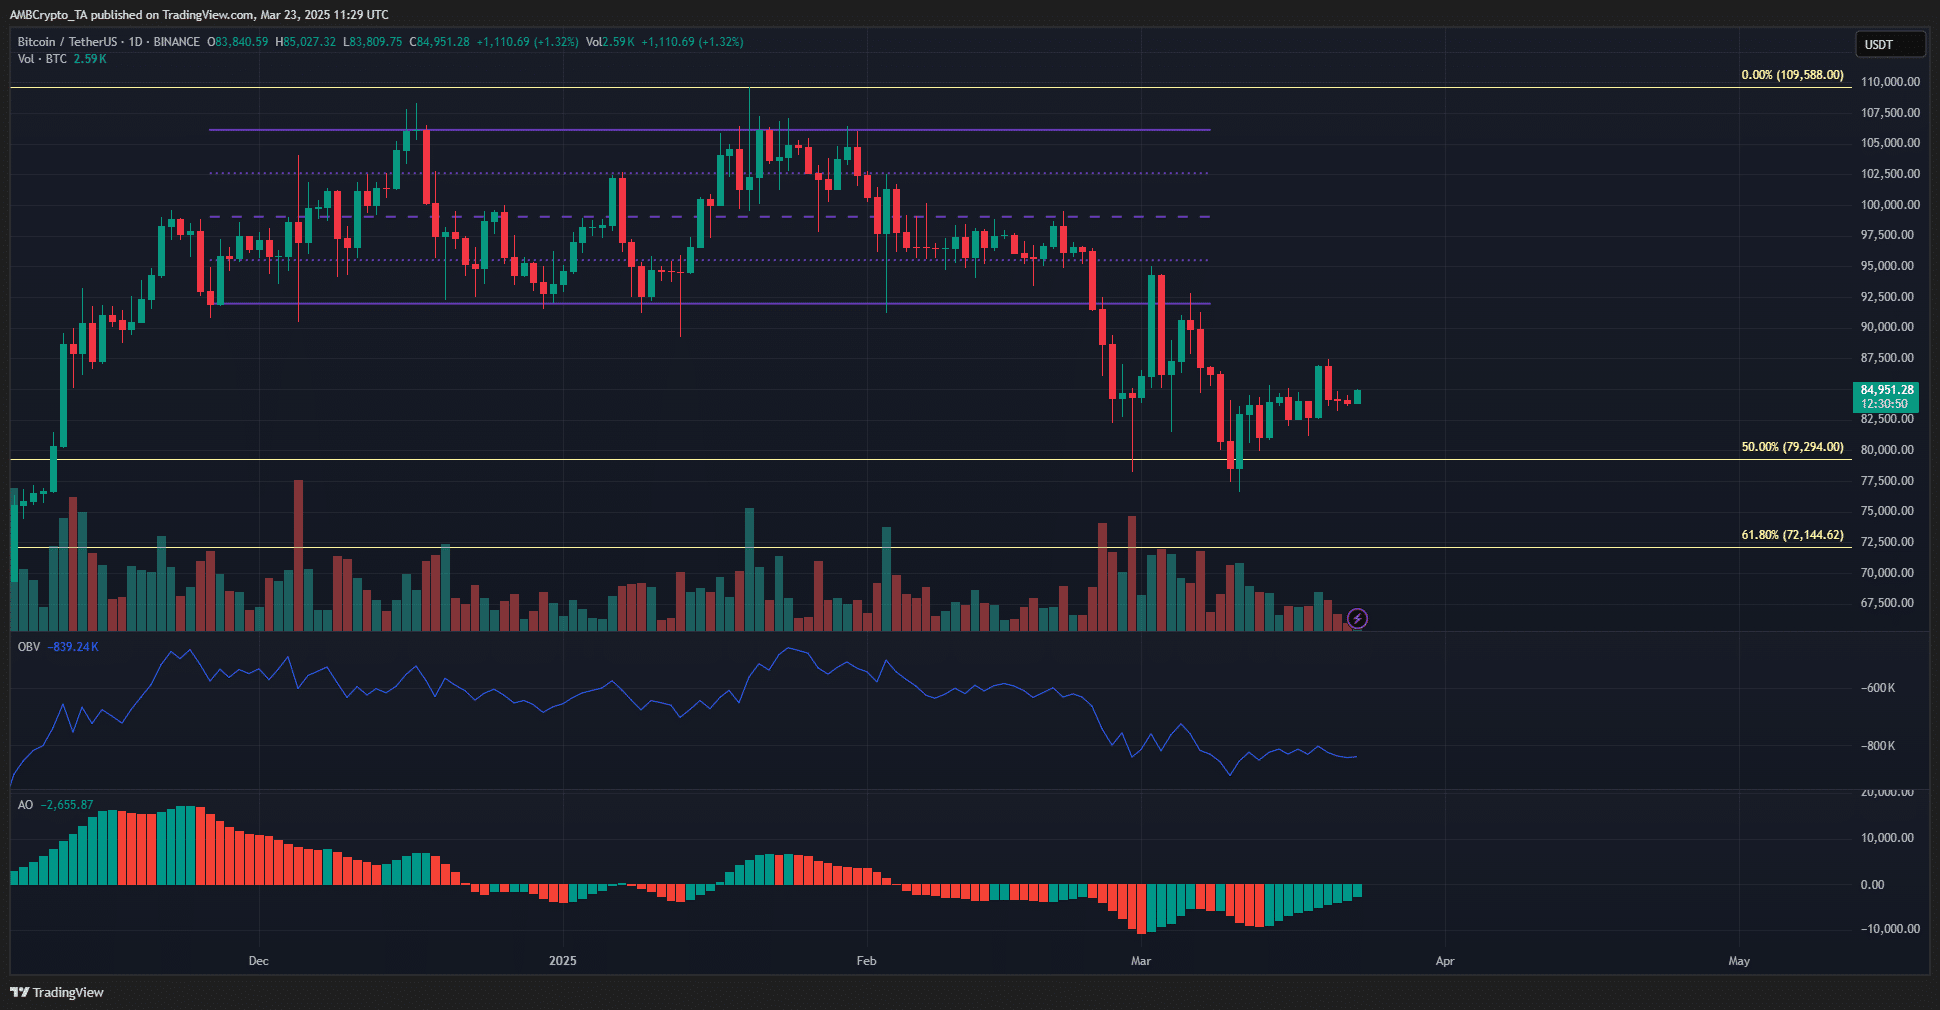
Source: BTC/USDT on TradingView
The BTC daily chart retained its bearish structure. The OBV has also been in a downtrend since February, showing selling pressure remained dominant. Together, they highlighted the chances of further losses.
The bearish momentum has waned according to the Awesome Oscillator but has not flipped bullishly.
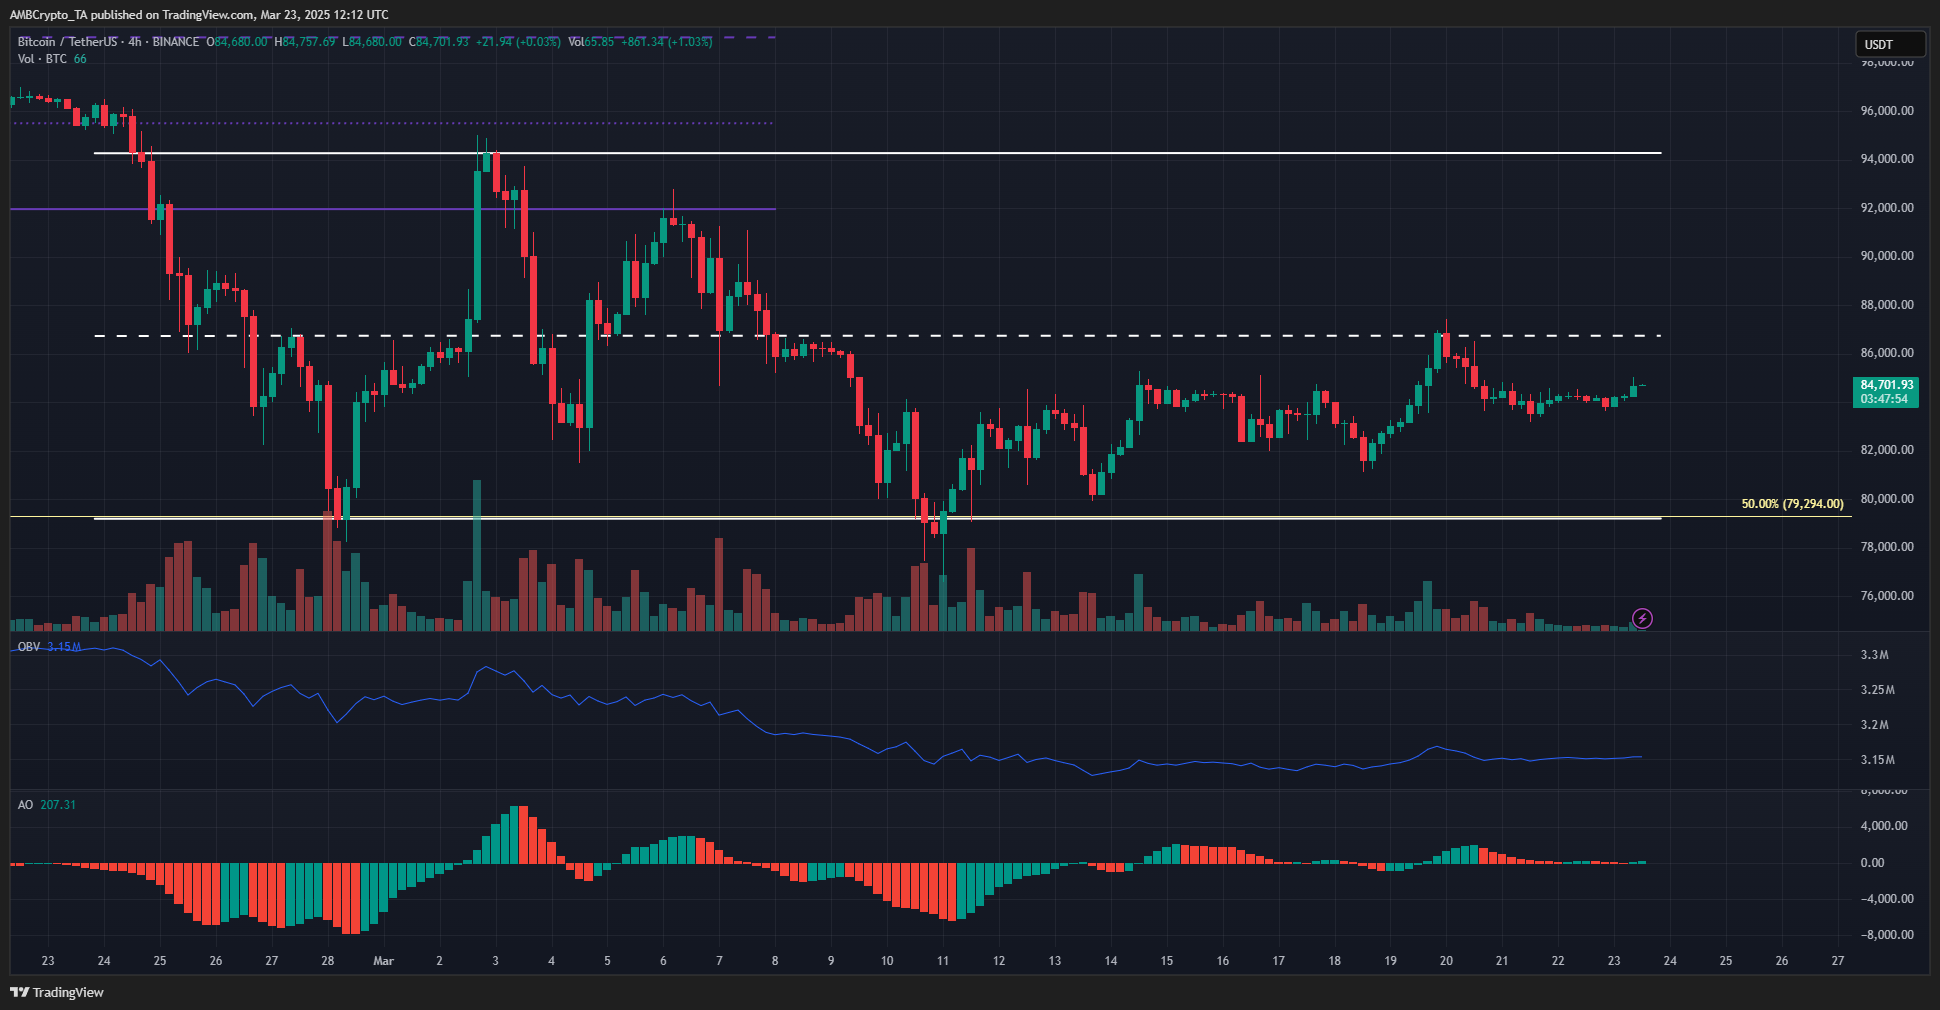
Source: BTC/USDT on TradingView
After falling below a 3-month-old range in early March, Bitcoin appeared to have formed a new range (white). The mid-range level at $86.9k has been tested as both support and resistance in the past three weeks.
As things stand, a move below $83k could initiate a bearish trend, while a breakout past $86.8k could start an uptrend.
The OBV has been making higher lows over the past ten days, but it was not evidence of strong buying. Neither was it enough demand to undo the selling pressure from February.
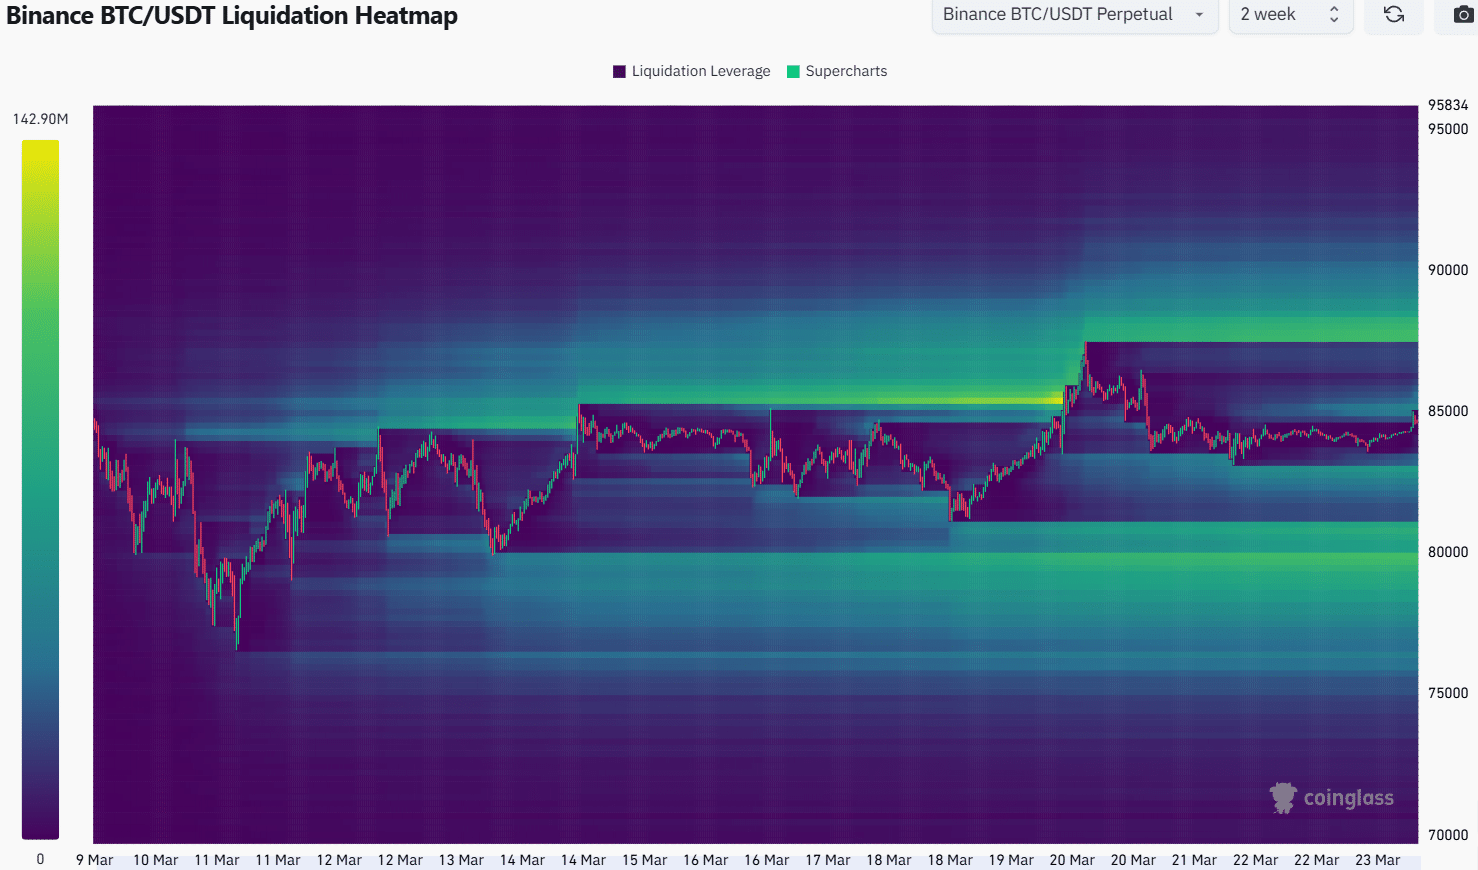
Source: Coinglass
The 2-week liquidation heatmap showed that the closest liquidity cluster was at $88k. The magnetic zone at $83k did not appear as strong as the one at $88k.
Further down, the $80k was sizeable, but further away from the price.
Therefore, traders must be prepared for the Bitcoin price to gravitate toward $88k before facing a bearish rejection.
Technical analysis showed that if $86.8k were flipped to support, it might be safe to go long. The liquidation heatmap showed that might not be true. Caution was warranted, especially for the bulls.
Traders should monitor the reaction at both resistances carefully. A rejection could present an opportunity to short-sell the asset.
Disclaimer: The information presented does not constitute financial, investment, trading, or other types of advice and is solely the writer’s opinion