Bitcoin buying pressure soars, but here’s why BTC can fall to $66K

- Sell pressure on Bitcoin remained high.
- Market indicators suggested a price correction in the coming days.
After a cruise, Bitcoin [BTC] has witnessed a correction in the last few hours. A latest report also pointed out a development that hinted at a price correction.
AMBCrypto planned to check BTC’s on-chain data to find out whether this correction will last, or if the trend will change again.
How is Bitcoin doing?
Bitcoin has lost its bullish momentum. According to CoinMarketCap, the king coin’s price increased by more than 8% in the last seven days.
However, the trend changed in the last 24 hours, as the coin’s price only moved marginally. At the time of writing, the coin was trading at $68,423.71 with a market capitalization of over $1.35 trillion.
In the meantime, Ali, a popular crypto analyst, recently posted a tweet revealing an important development. As per the tweet, Bitcoin’s key indicator, the TD sequential flagged a sell signal.
This indicated that investors might start selling the coin. Whenever selling pressure on an asset increases, it hints at a price decline.
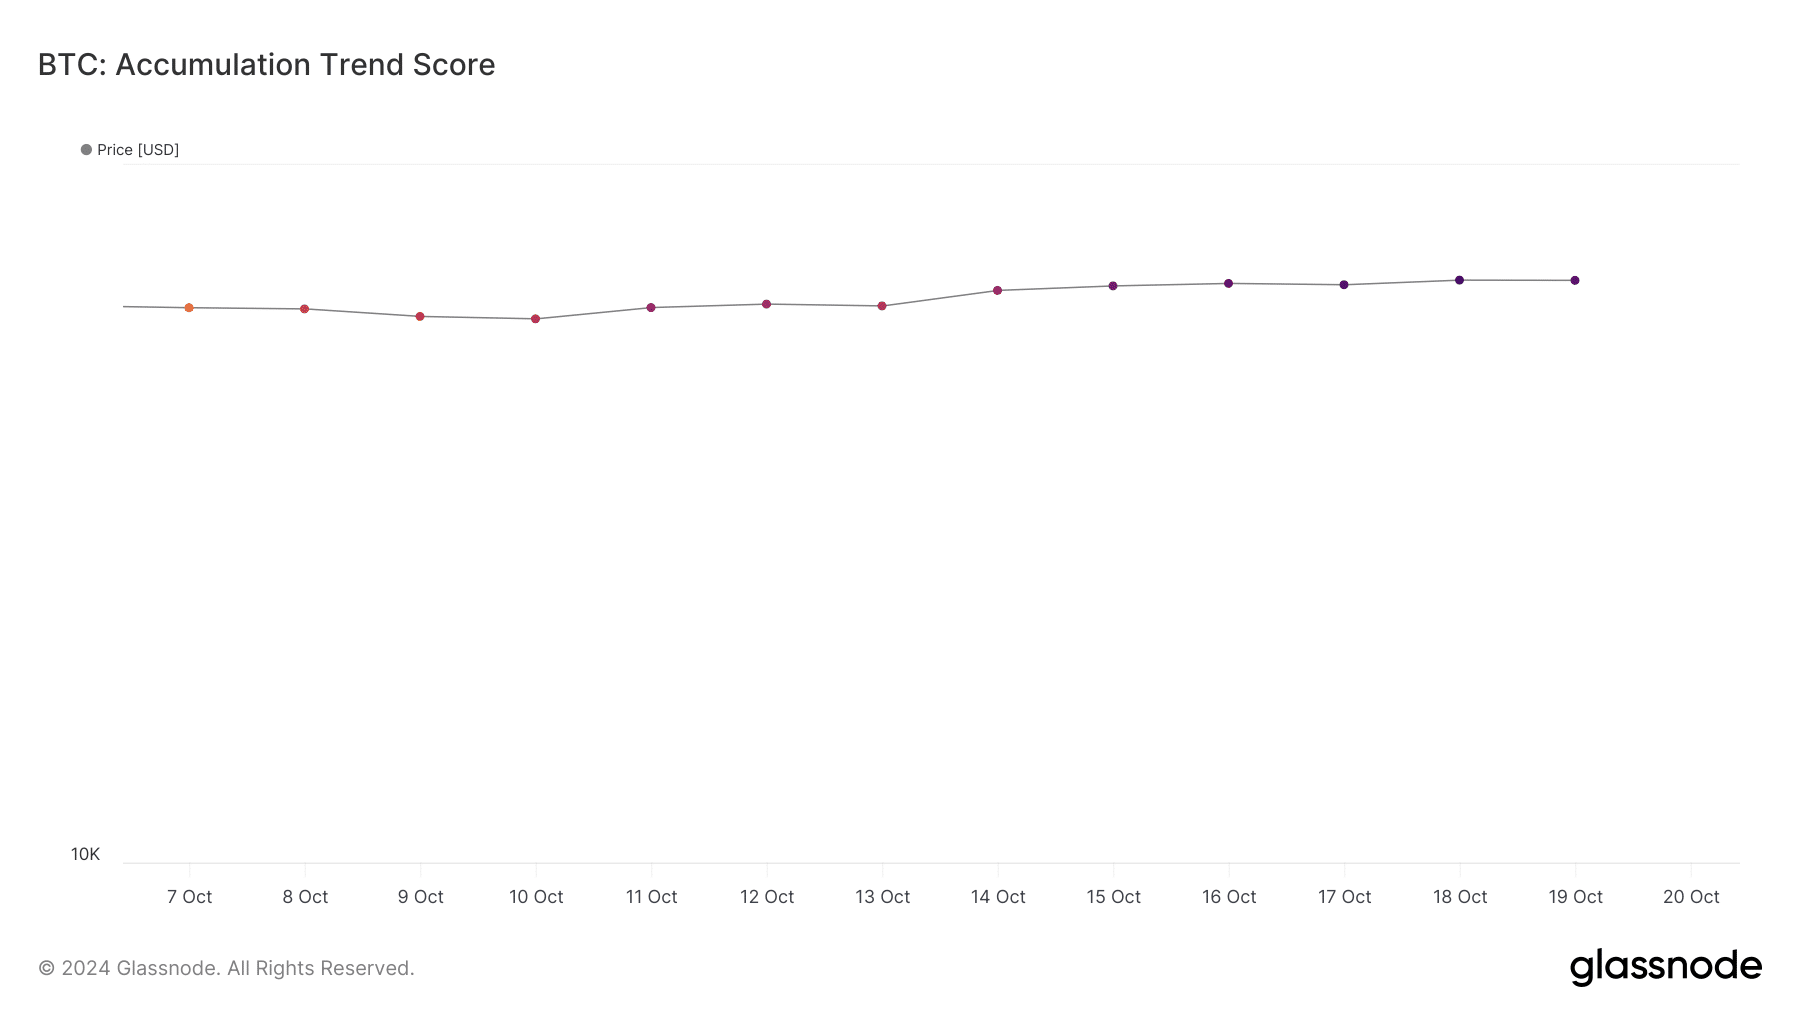
However, as per our analysis of Glassnode’s data, investors were starting to buy more BTC. It revealed that BTC’s accumulation trend score increased from 0.5 to 0.7 last week.
For starters, the Accumulation Trend Score is an indicator that reflects the relative size of entities that are actively accumulating coins on-chain in terms of their BTC holdings.
A number closer to 1 represents a rise in buying pressure.
Is BTC poised for a correction?.
AMBCrypto dug deeper to find out what to expect from the king coin in the coming days. As per our analysis, Bitcoin’s NVT ratio increased over the last few days.
Whenever the metric rises, it indicates that an asset is overvalued, hinting at a price drop in the coming days.
However, BTC’s exchange reserve was dropping, meaning that selling pressure was dripping. The fact that investors were still buying BTC was further proven by its net deposit on exchanges.
To be precise, Bitcoin’s net deposit on exchanges was low compared to the last seven-day average. Both of these metrics were bullish, as high buying pressure results in price upticks.
Read Bitcoin (BTC) Price Prediction 2024-25
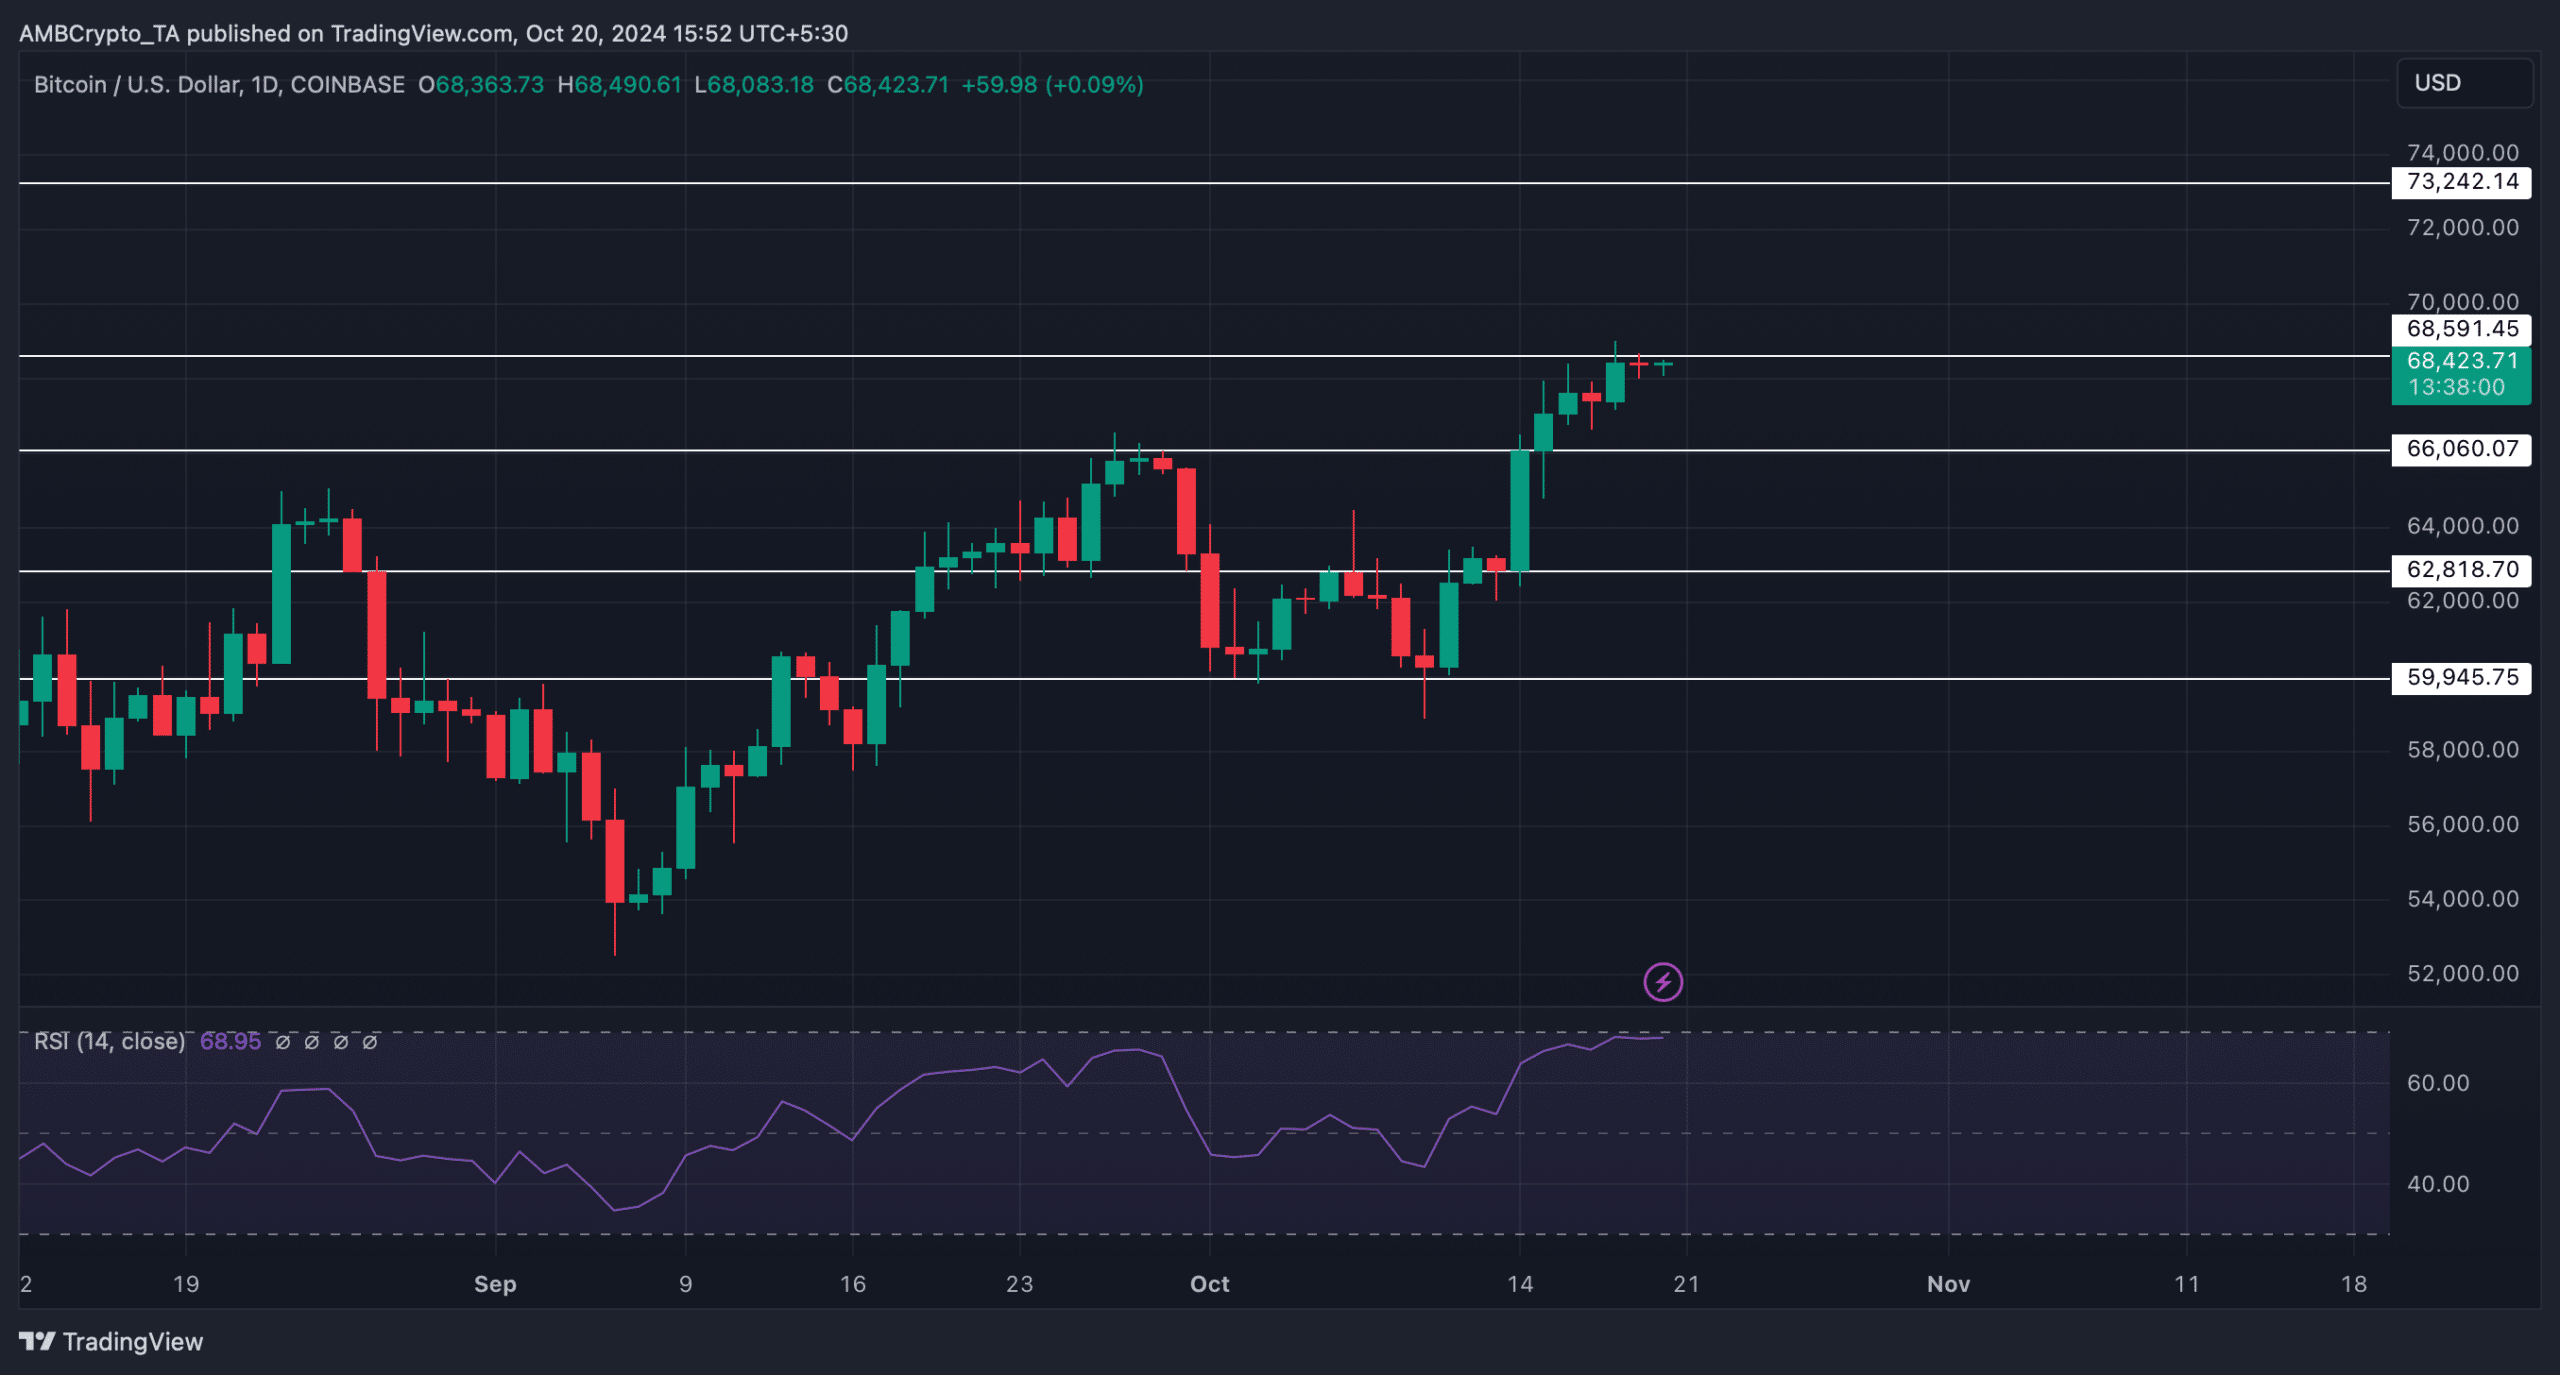
AMBCrypto then checked Bitcoin’s daily chart to find out what to expect from it. We found that BTC was getting rejected at its resistance. Notably, its Relative Strength Index (RSI) was entering the overbought zone.
If that happens, then Bitcoin might witness a price correction, causing BTC to drop to $66k again. In case of a continued bull run, BTC might touch $73k.


