Bitcoin Cash: A potential breakout would mean this for traders

Disclaimer: The findings of the following analysis are the sole opinions of the writer and should not be taken as investment advice
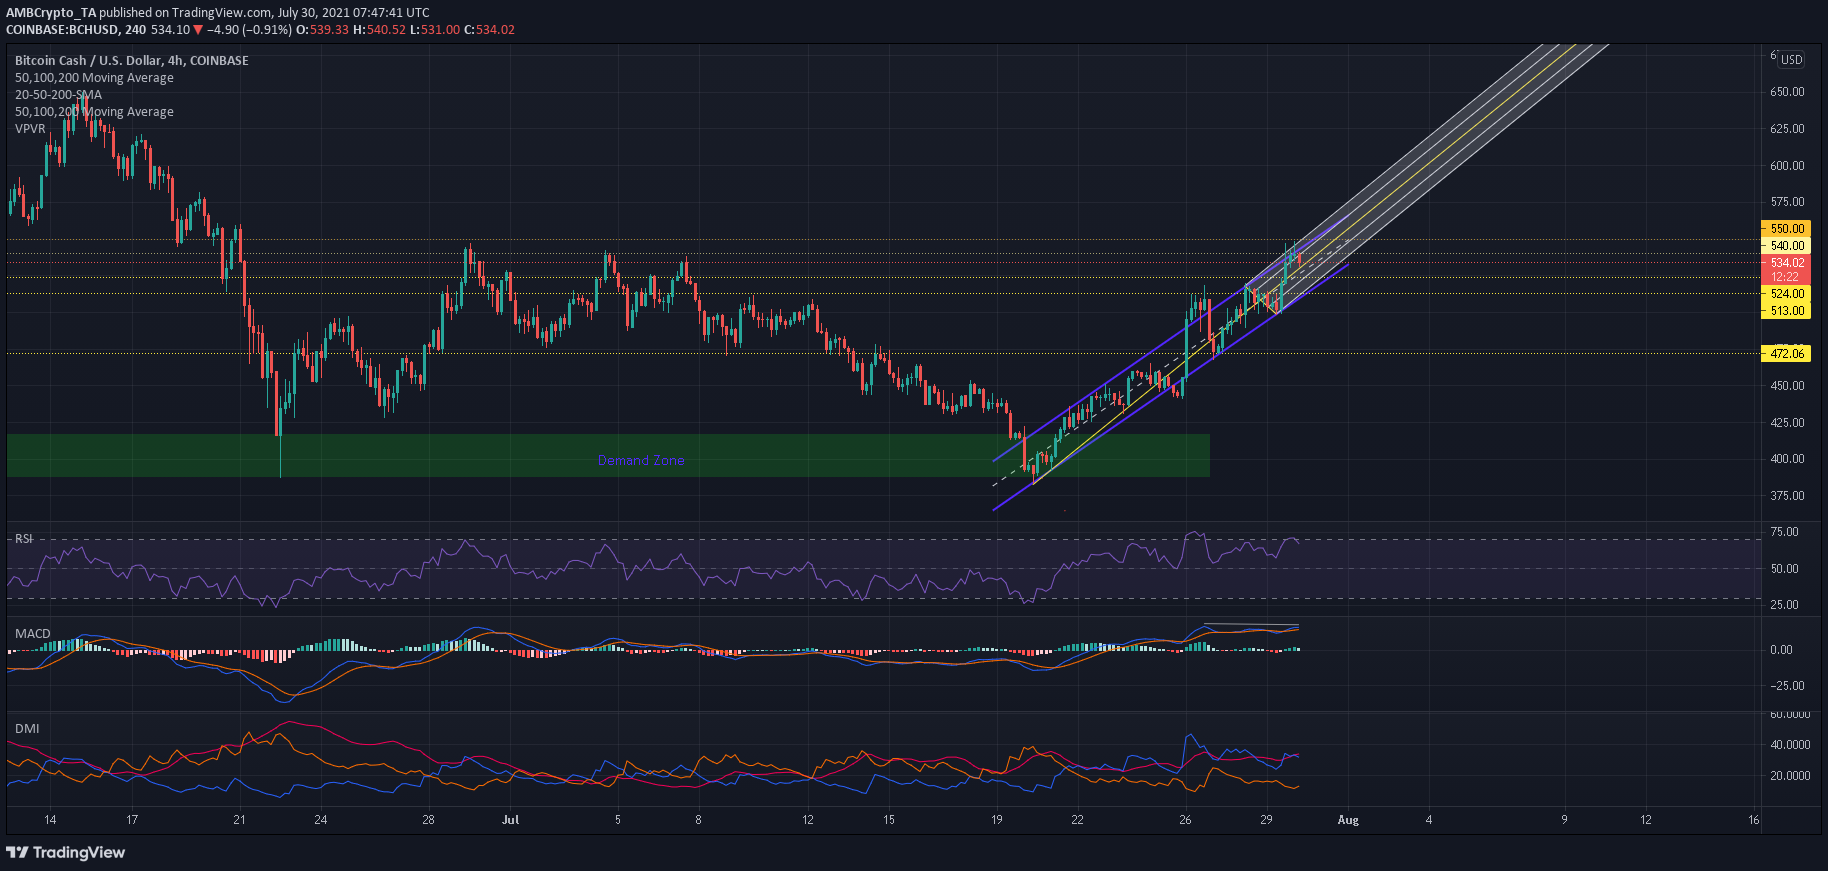
An immediate rejection at the $513-resistance saw Bitcoin Cash move back within the confines of its ascending channel. However, it continued to climb higher on the charts. Now, some difficulties may lie ahead for the world’s 12th-largest cryptocurrency but a more significant bullish advantage can be seen too.
At the time of writing, Bitcoin Cash was being traded at $537.45, up by 5% over the last 24 hours.
Bitcoin Cash 4-hour Chart

Source: BCH/USD, TradingView
BCH’s charts highlighted an early breakout from its ascending channel on 26 July. However, failing to clear the resistance channel of $513-$515 resulted in 6% corrections. The lower trendline of the channel, which coincided with the $472 support, triggered a bounceback as BCH resumed movement within its pattern.
The northbound push allowed BCH to eventually topple the $513-$515 price ceiling. Following the same, the focus shifted to another potential breakout. BCH’s next target lay at $540-$550 and a close above this zone can potentially trigger the next upswing in the market.
This region also coincided with BCH’s upper sloping trendline and Pitchfork’s outline line. A best-case outcome would see BCH snap $600 on the back of an upwards breakout.
Corrections before an upswing?
The Relative Strength Index was trading within the overbought territory and projected a possible reversal over the next few sessions. This would work against an immediate breakout prediction.
The MACD, despite trading above its half-line, noted a slight bearish divergence with BCH’s price action.
The Directional Movement Index’s -DI and +DI converged as a bullish trend slightly receded. While the bulls did maintain an uptrend, these signs suggested that BCH could dip slightly before making a push north. Such a move can be expected within the $524-$528 support zone, although a sharper retracement would drag the price back towards $513.
Conclusion
As opposed to an immediate breakout, BCH might take a slight dip before its next upswing. However, losses are not expected to be steep and the alt is likely to hold between $524-$528. In case BCH falls all the way towards its lower trendline at $513, traders can choose to long BCH and exit their trades once the price touches $600.


