Bitcoin Cash: A short position entry can be taken at $190 with stop-loss above…

Disclaimer: The information presented does not constitute financial, investment, trading, or other types of advice and is solely the opinion of the writer.
In 2022, Bitcoin Cash formed a range and in May, the price plunged beneath the range lows as the crypto market experienced wave after wave of fear. The market structure was bearish, and the downtrend remained unbroken as we entered June. Technical indicators also pointed toward further losses for Bitcoin Cash.
A potential shorting opportunity was identified, and risk management would be just as important as technical analysis in entering and managing such a trade.
BCH- 12 Hour Chart
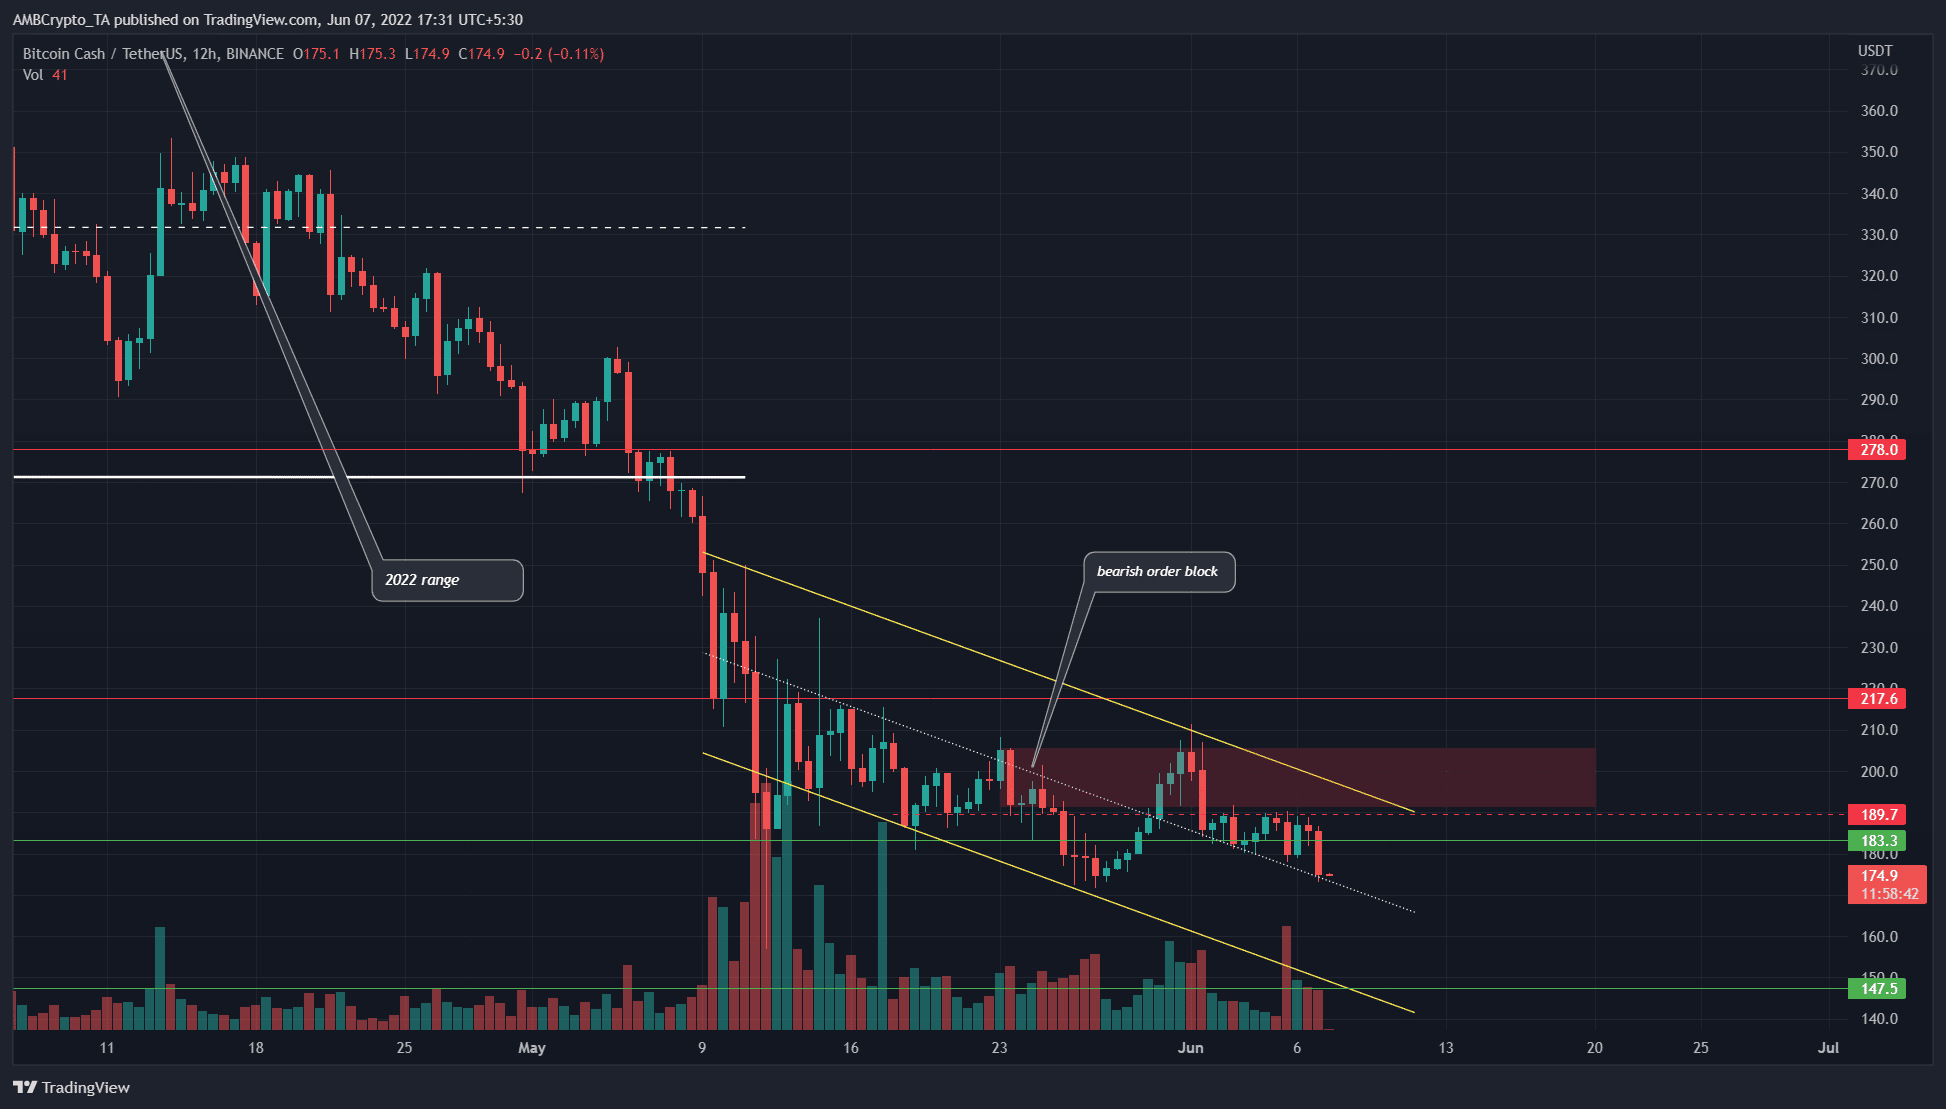
On the H12 chart, it can be seen that the price slipped beneath the 2022 range (white) that BCH formed, with the lows and highs at $270 and $392 respectively.
BCH has formed a series of lower highs and lower lows since then, as the intense selling pressure of May saw BCH crash rapidly beneath the $200 mark. Moreover, the $200 mark is an important psychological level of significance, and the price has dropped beneath both the $200 as well as the $183 support level.
BCH- 4 Hour Chart
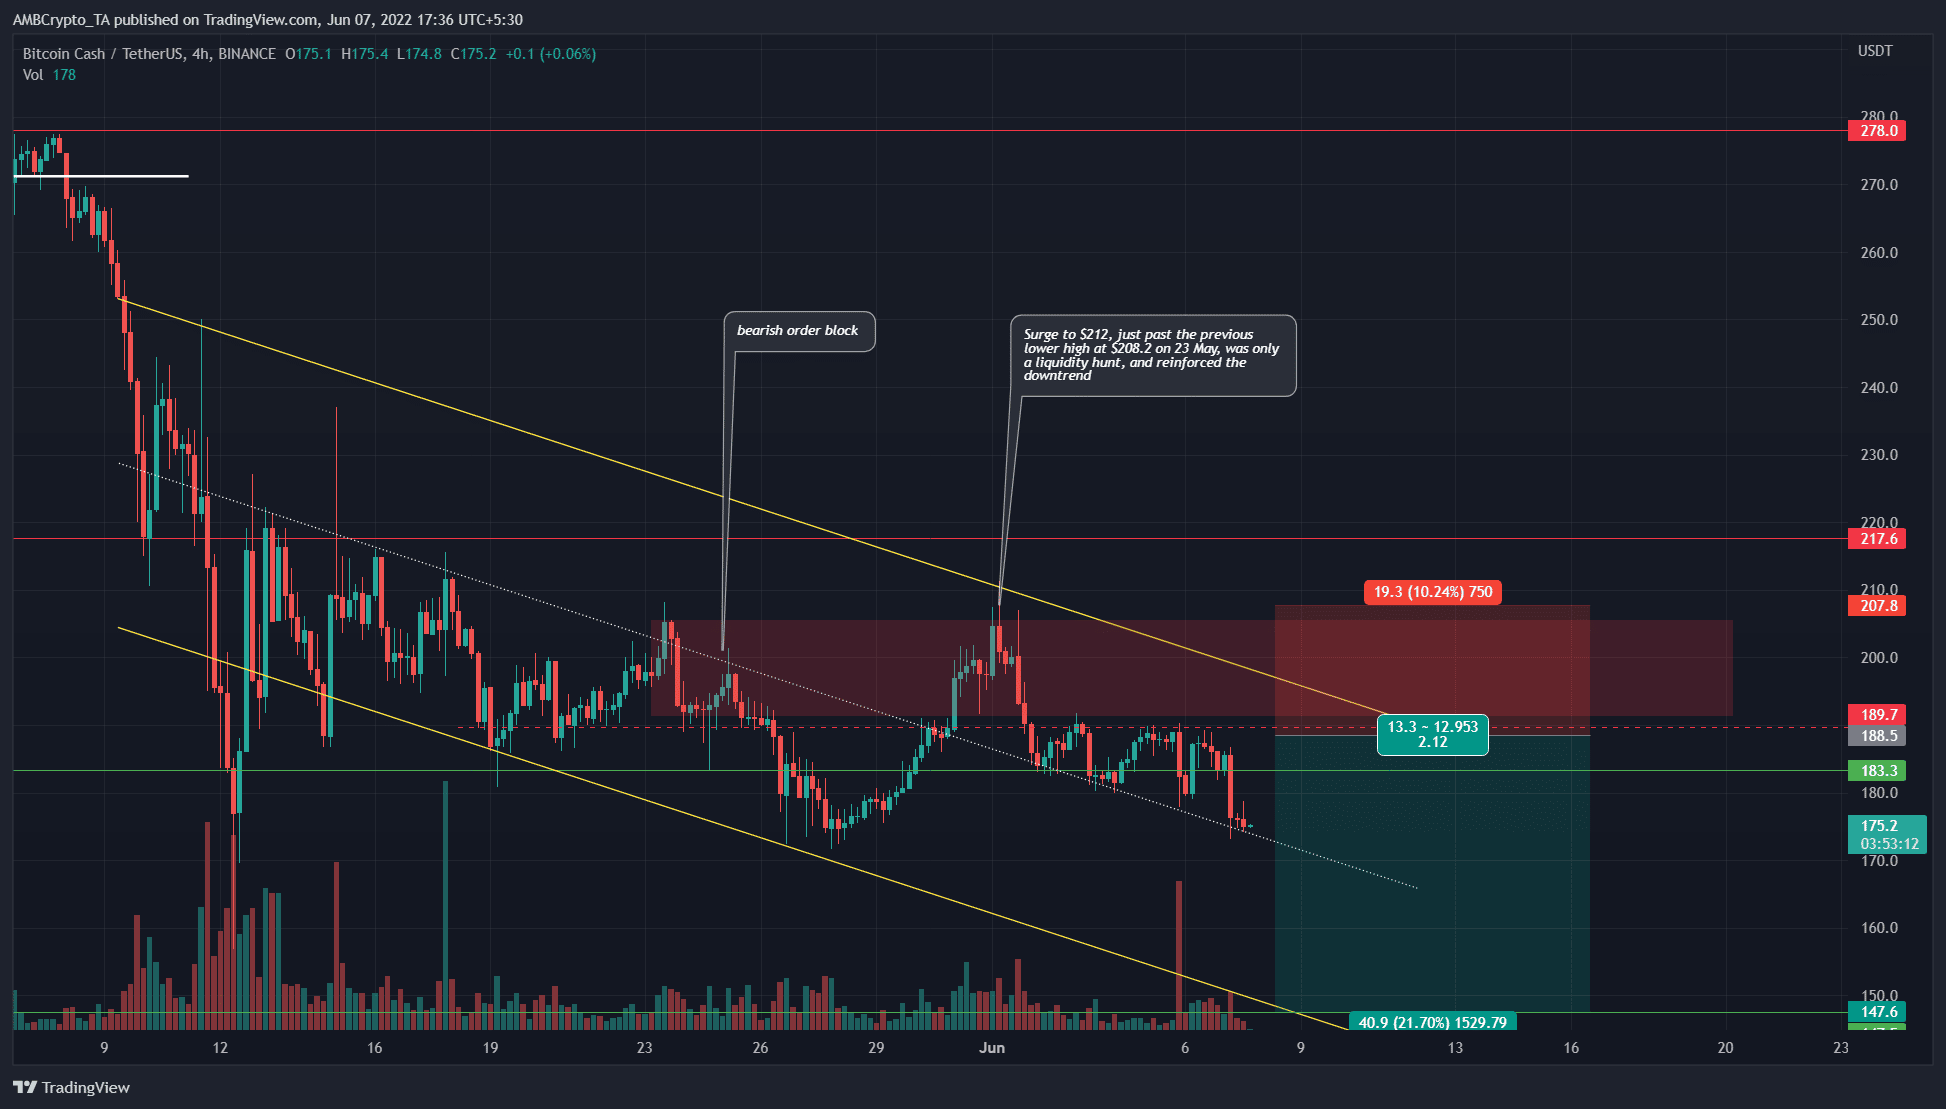
On the H4 chart, it can be seen that the trend is indeed downward, with one of the latest lower highs being at the $208.5 mark. As June was born, BCH appeared to break above the previous lower high, but the surge to $212 was short-lived and appeared only to be a liquidity hunt.
The $189-$190 area has served as support and then resistance over the past two weeks, and hence a retest of this level could be a good entry for a short position. The trend was downward, and the descending channel’s upper boundary has a confluence with a higher timeframe bearish order block.
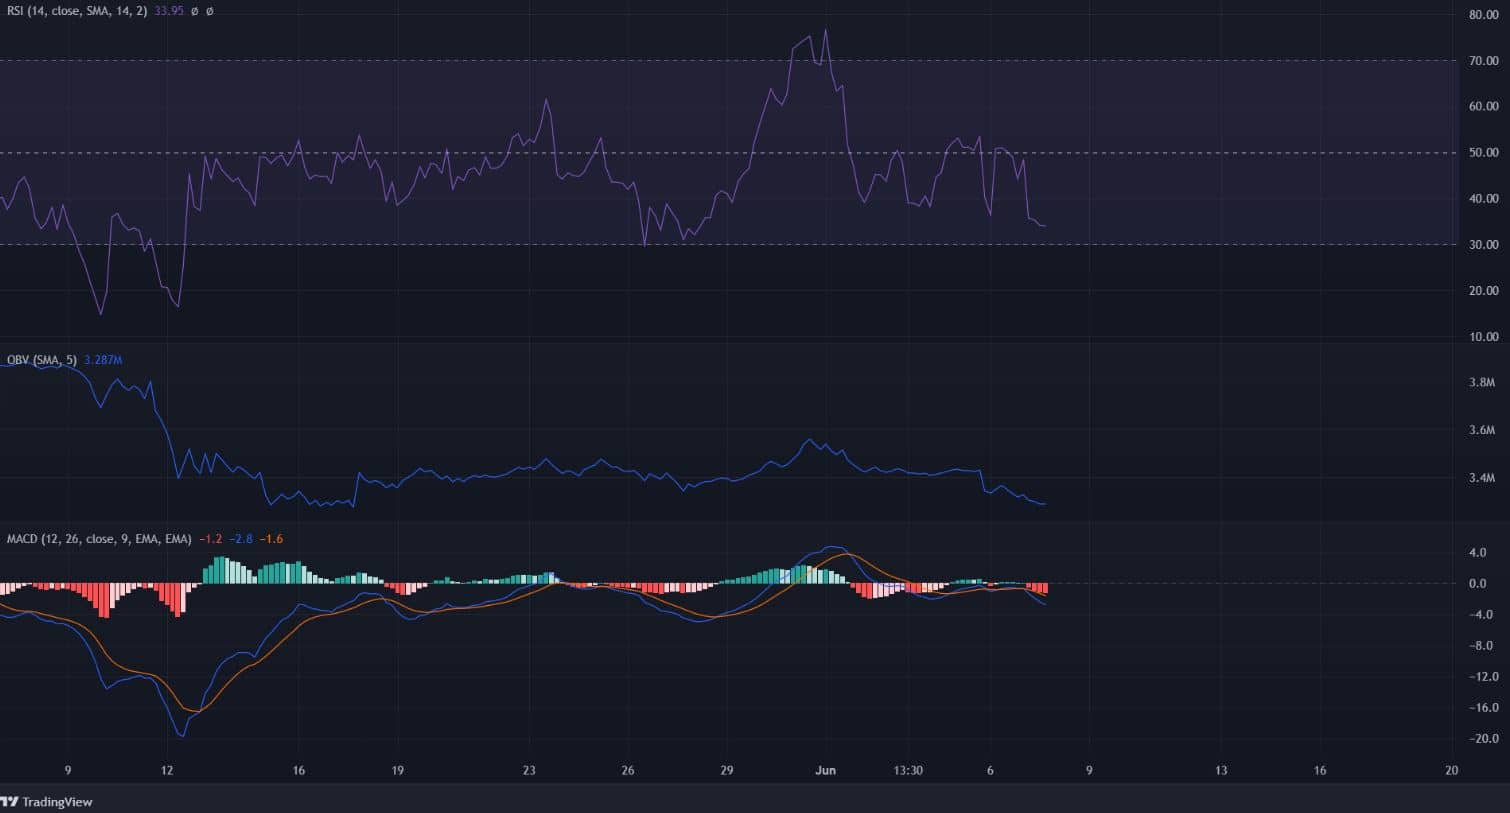
The H4 RSI has been below neutral 50 over the past few days and reinforced the notion of bearish momentum behind BCH. The OBV has also been forming lower highs and lower lows since the turn of the month.
At the same time, the MACD also formed a bearish crossover beneath the zero line, to further strengthen the argument of the bears.
The selling volume, combined with the momentum behind BCH, meant that further lows were likely the way forward for BCH.
Conclusion
A short position entry can be taken at $190 on a bearish retest if it presents itself. A stop-loss above the bearish order block, in the vicinity of the $210 mark, could provide a sufficient margin for error for such a short position.
Beneath the $183 support level, the next higher timeframe support is at $147. This level has confluence with the channel lows as well, making it an ideal take-profit target.


