Bitcoin Cash, Axie Infinity, GALA Price Analysis: 24 February

The crypto market saw a significant plunge in the last few hours as the friction between Russia and Ukraine worsened. As a result, a broader sell-off followed. As a result, Bitcoin Cash hovered around its 15-month support after a 10.87% 24-hour loss.
Further, Axie infinity flipped its six month-support to resistance after the downslide. Also, GALA substantially discounted as it challenged the lower band of its Bollinger Bands.
Bitcoin Cash (BCH)
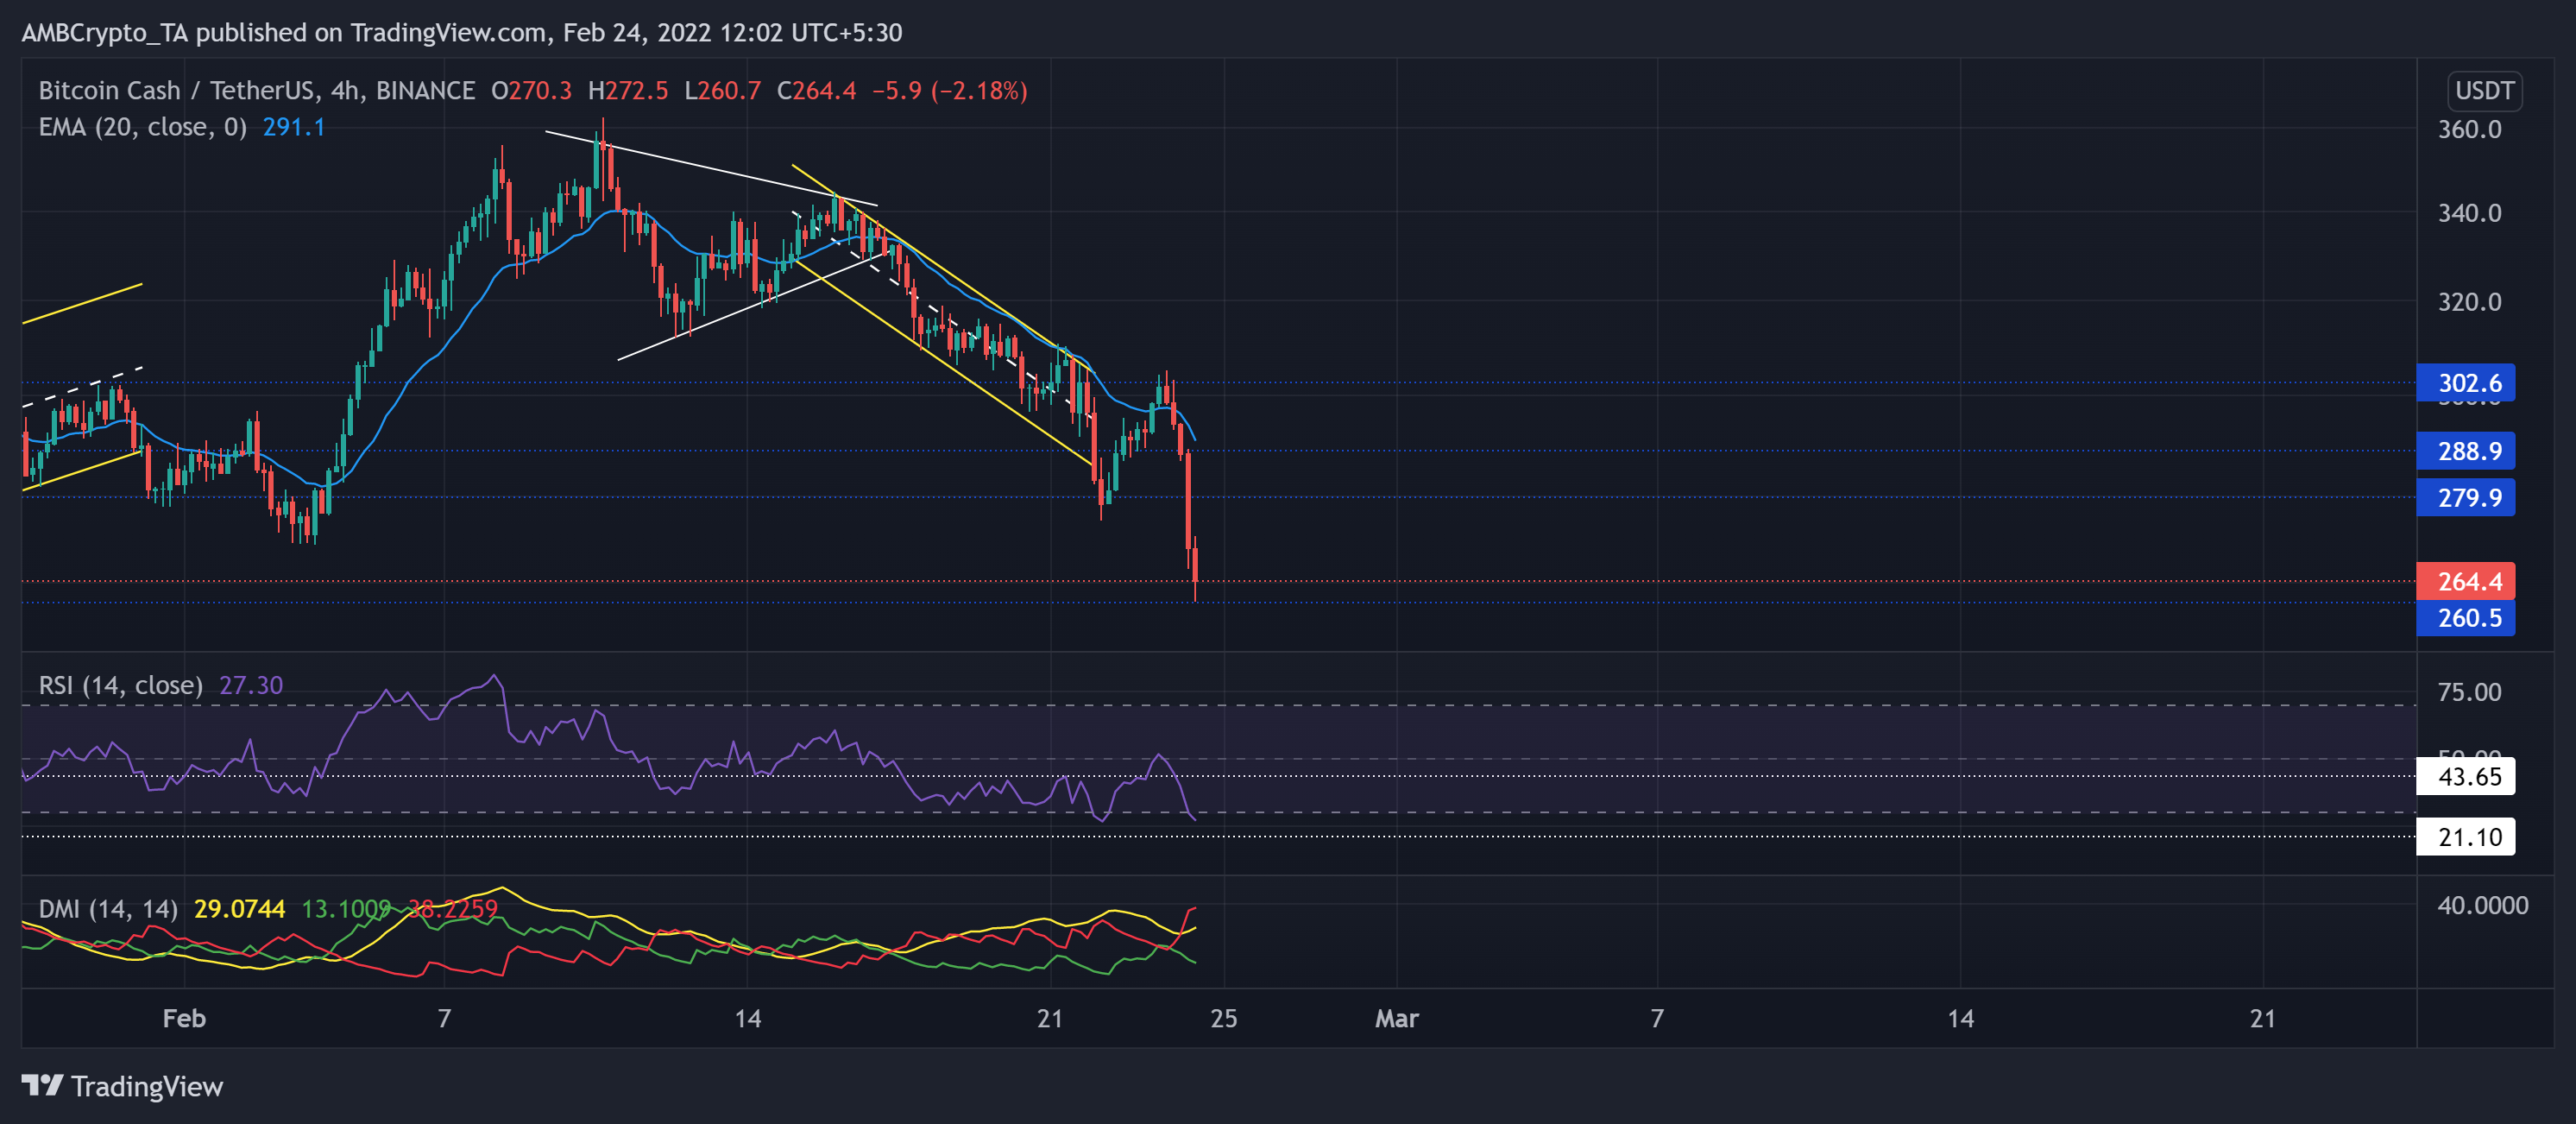
As the bearish phase initiated, BCH steeply declined and lost its one-year support (now resistance) at the $387-mark. After a nearly 38% retracement (from 5 January), it hit its 13-month low on 24 January.
Since then, the alt oscillated between the $387-$260 range for the past one month. The latest retracement saw a down-channel (yellow) that yet again tested its 15-month support at the $260-floor. To initiate a recovery phase, the $279-mark would be crucial for the bulls to reclaim.
At press time, BCH traded at $264.4. The RSI downturned deep into the oversold region. Any further retracements would find support near the 21-point. With the +DI line looking south, the fear sentiment visibly heightened. This reading justified the near-term bearish movements.
Axie Infinity (AXS)
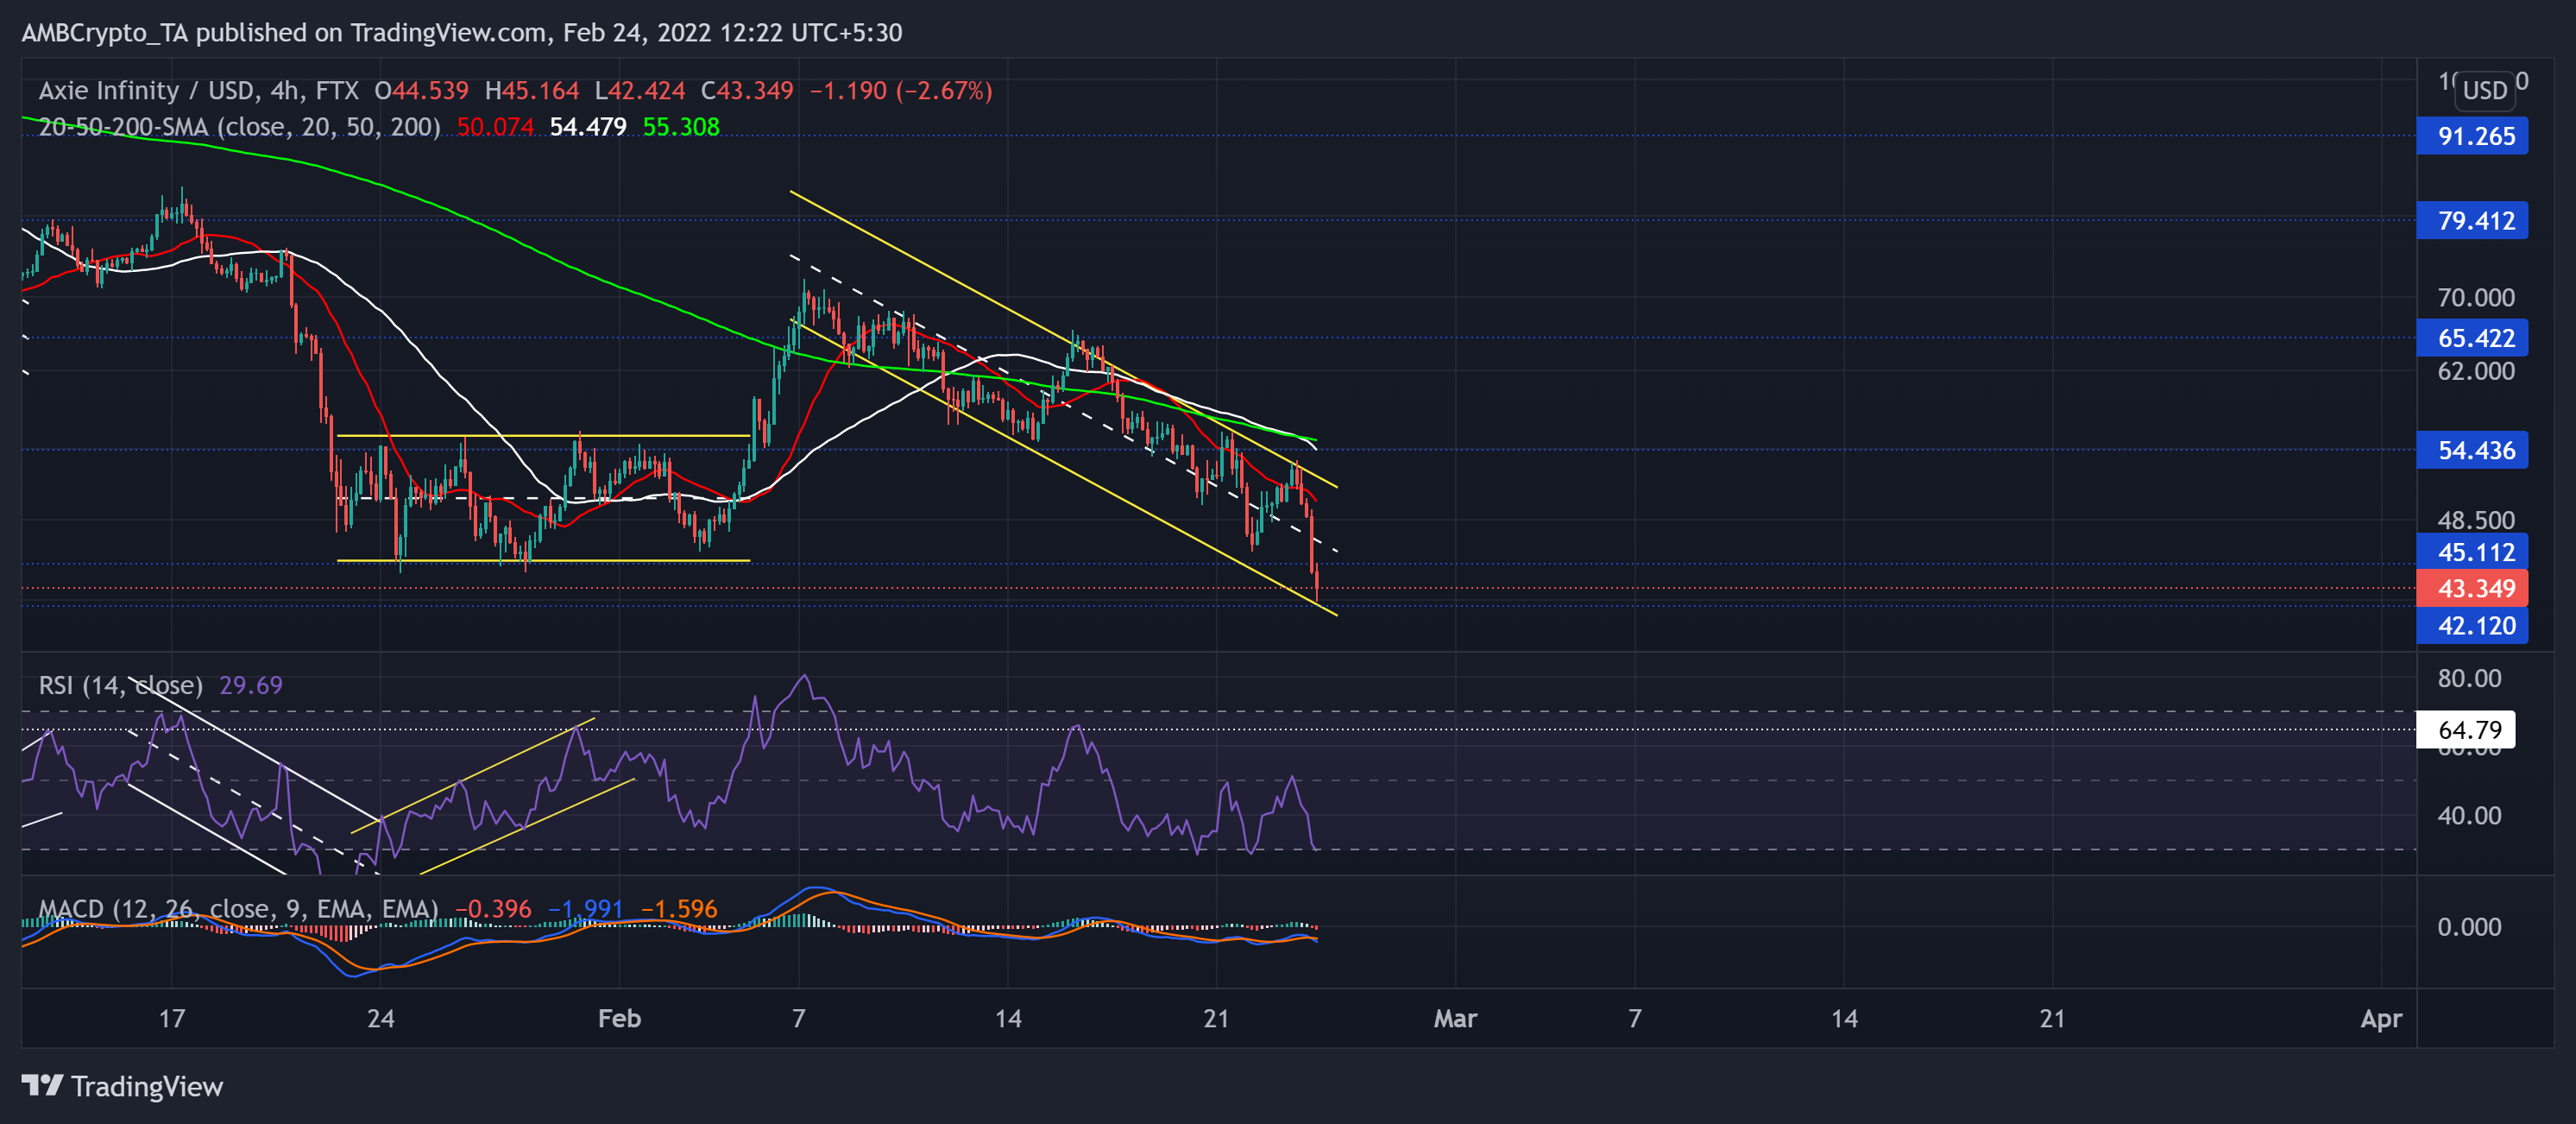
After a steep downtrend, AXS lost multiple resistance (previous support) levels in the last two weeks. The alt lost over 40% of its value (since 7 February) as it rushed south to touch its six-month low on 24 February.
As a result, the 20 SMA (red) rapidly fell below the 50 SMA (white) and the 200 SMA (green), reaffirming the enormous sell-off during the last few days. Any retracements from here would continue to find testing grounds at the $42-mark.
At press time, AXS traded at $43.349. The RSI saw a 22 point plunge over the last day as it swayed into the oversold territory. Furthermore, MACD lines undertook a bearish crossover and confirmed the previous analysis.
GALA
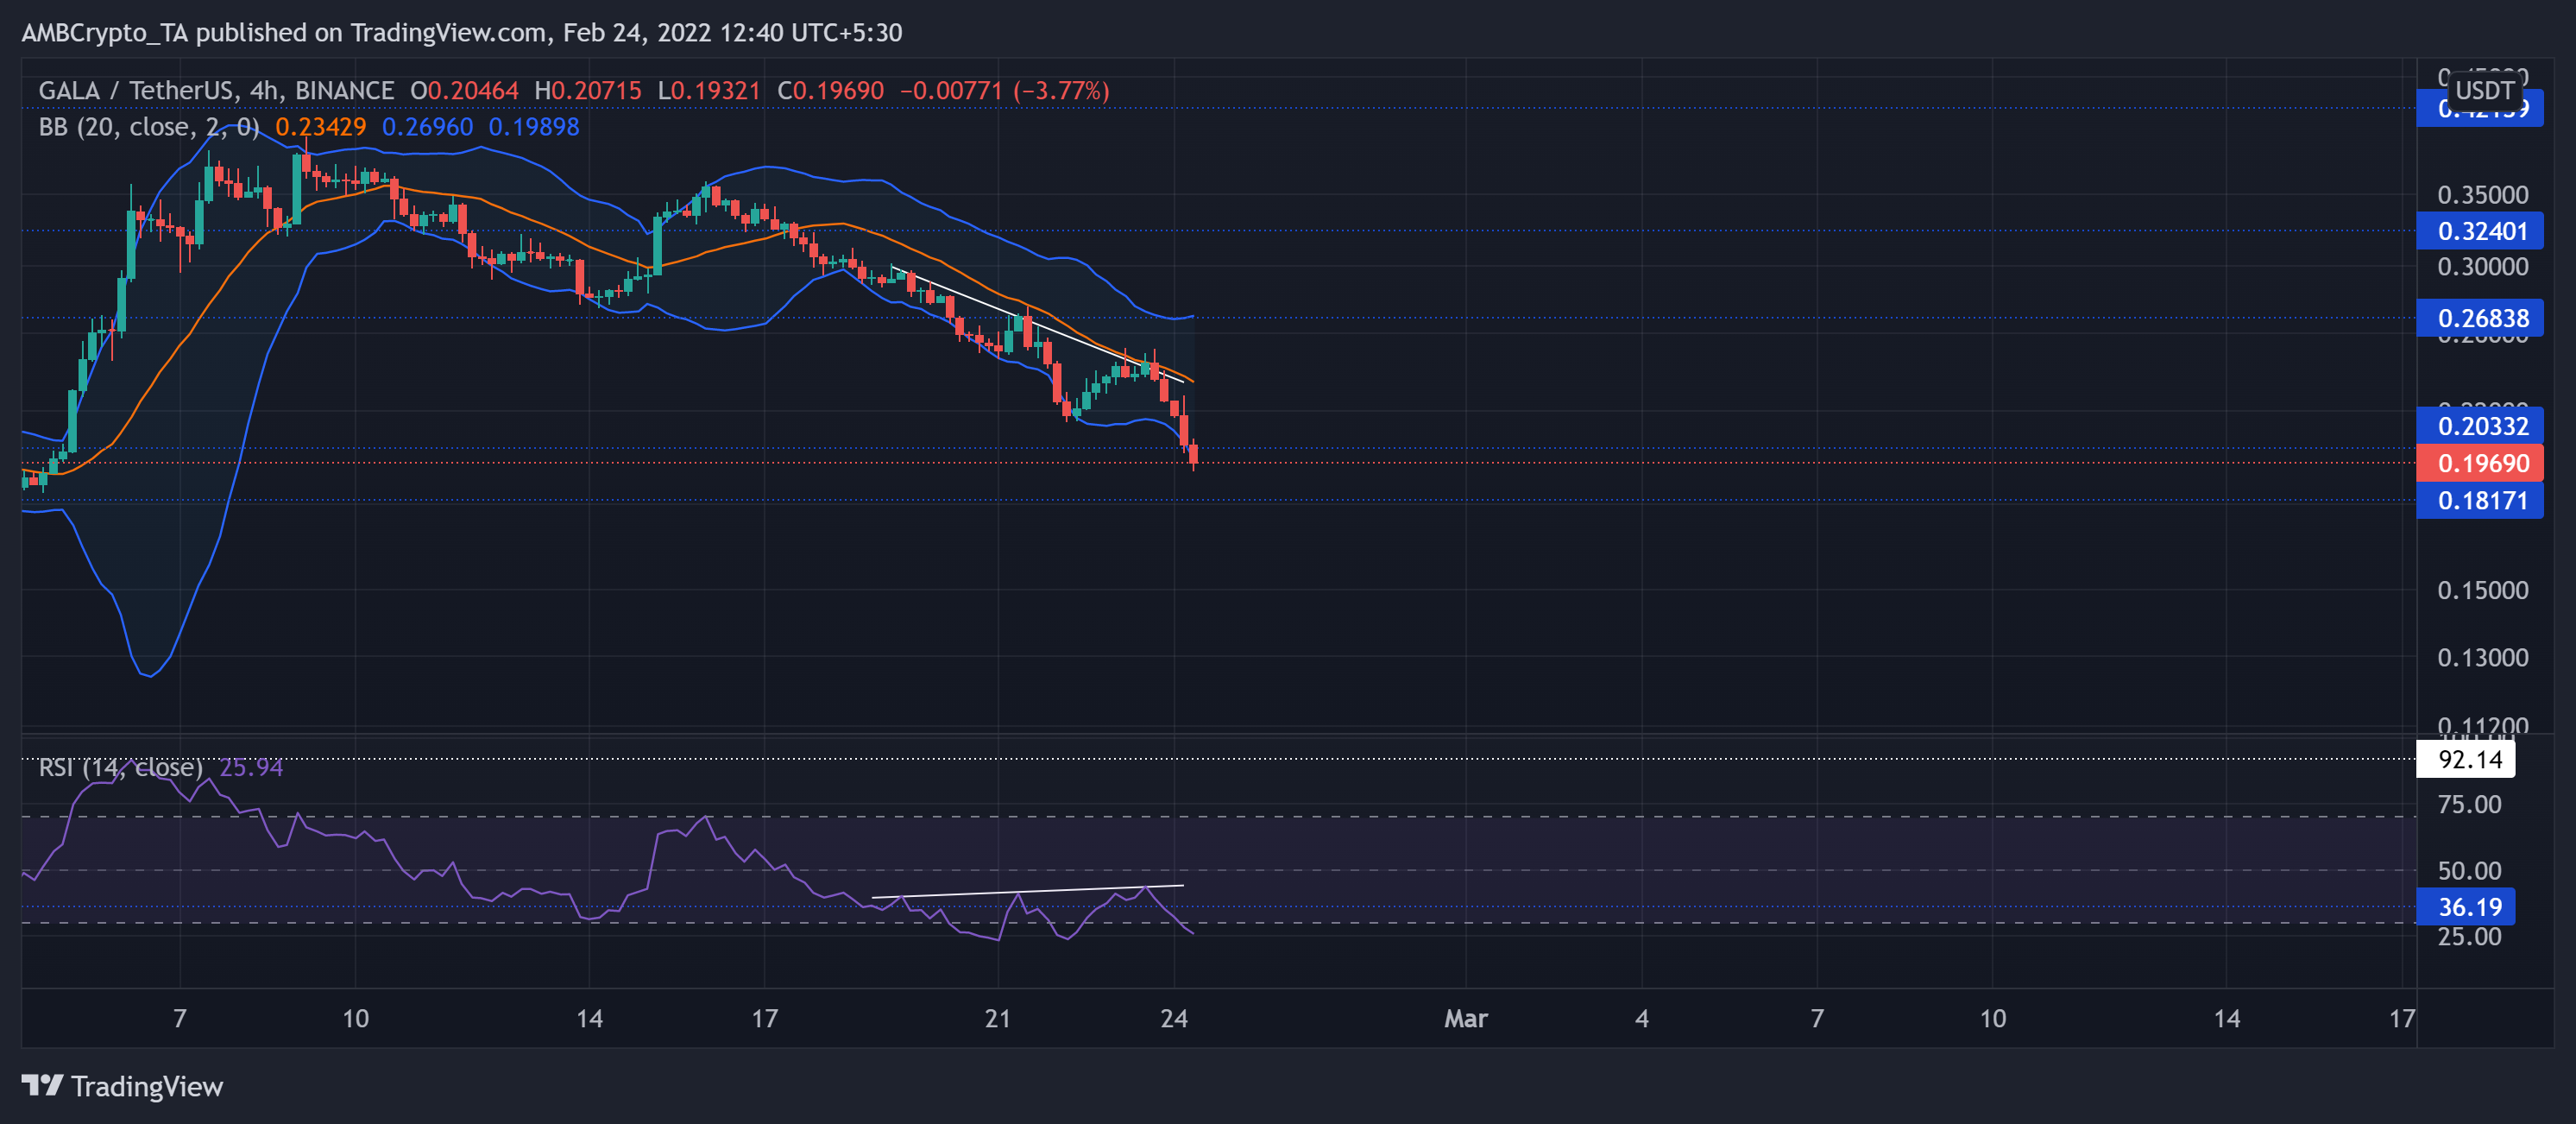
GALA lost its bullish vigor after it failed to uphold the $0.421-level. Since losing this mark, it has been rangebound between the above level and the $0.181-mark.
The recent sell-off phase pushed GALA below the mean (red) of Bollinger Bands (BB). The alt lost over 44% of its value in the last eight days. Post which, it kept testing the lower band of BB as the bears kept exerting pressure. Any reversals from here would continue to find resistance near the $0.23-zone (near its 20 SMA / mean of BB).
At press time, GALA traded at $0.1969. The RSI witnessed a substantial fall into its oversold mark after a hidden bearish divergence. A close above this level would open up possibilities to topple the 36-resistance.


