Bitcoin Cash, BAT, Zcash Price Analysis: 07 November

Over the past day, the altcoins flashed mixed trading signals. Many altcoins continued to project monthly bullish price trajectories, but the near-term technical indicators hinted a preference for the bears.
Altcoins like Bitcoin Cash, BAT, Zcash were no exceptions as the indicators slightly preferred the sellers and hinted at possible ease in bearish influence. Moreover, the aforementioned coins depicted a weak directional trend.
Bitcoin Cash (BCH)
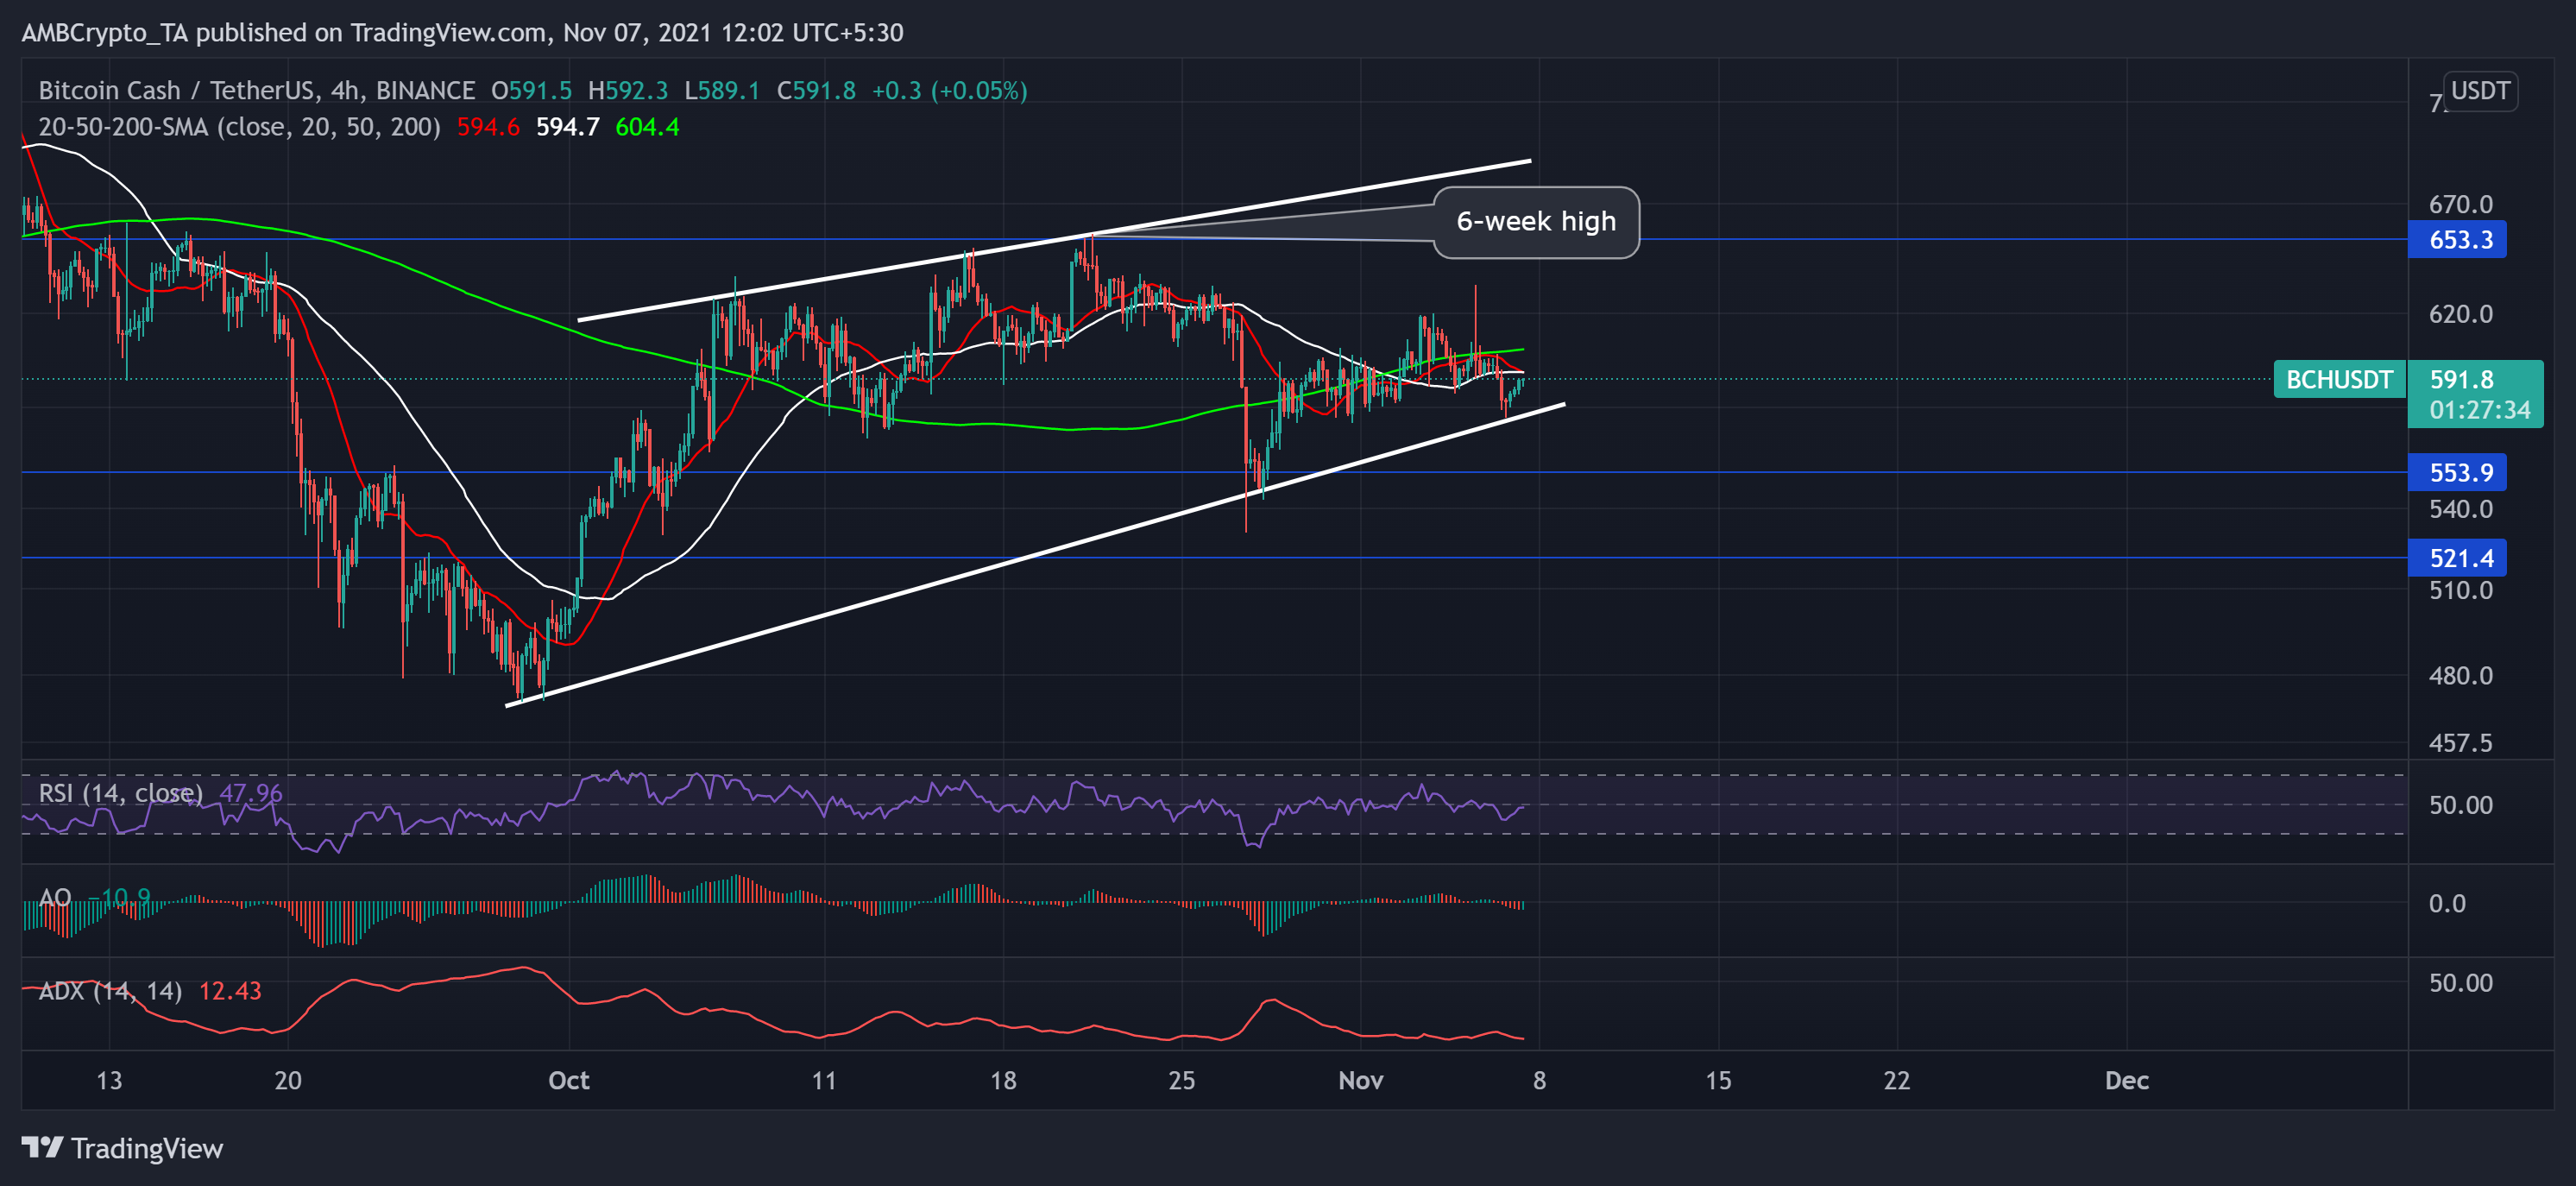
BCH’s price oscillated laterally within the bounds of its immediate resistance and support points at $653.3 and $553.9, respectively. Over the past 38 days, the altcoin has noted higher lows on its trendline after registering a 23.94% ROI (38-day). Since September’s end, the bulls displayed their vigor as the price hit its six-week high on 21 October.
However, since 22 October, the bears countered the pressure and ensured a pullback ever since. Consequently, the altcoin faced resistance at the upper trendline and then turned southbound.
BCH saw a 1.84% decline in 24 hours as near-term technical indicators slightly preferred the bears but hinted at possible ease in bearish momentum. At press time, BCH traded at $591.8, which was below the 4-hour 20-50-200 SMA.
The Relative Strength Index (RSI) stood slightly below the midline and corresponded with SMA readings. However, the Awesome Oscillator (AO) flashed a green sign while the ADX outlined a weak directional trend.
Basic Attention Token (BAT)
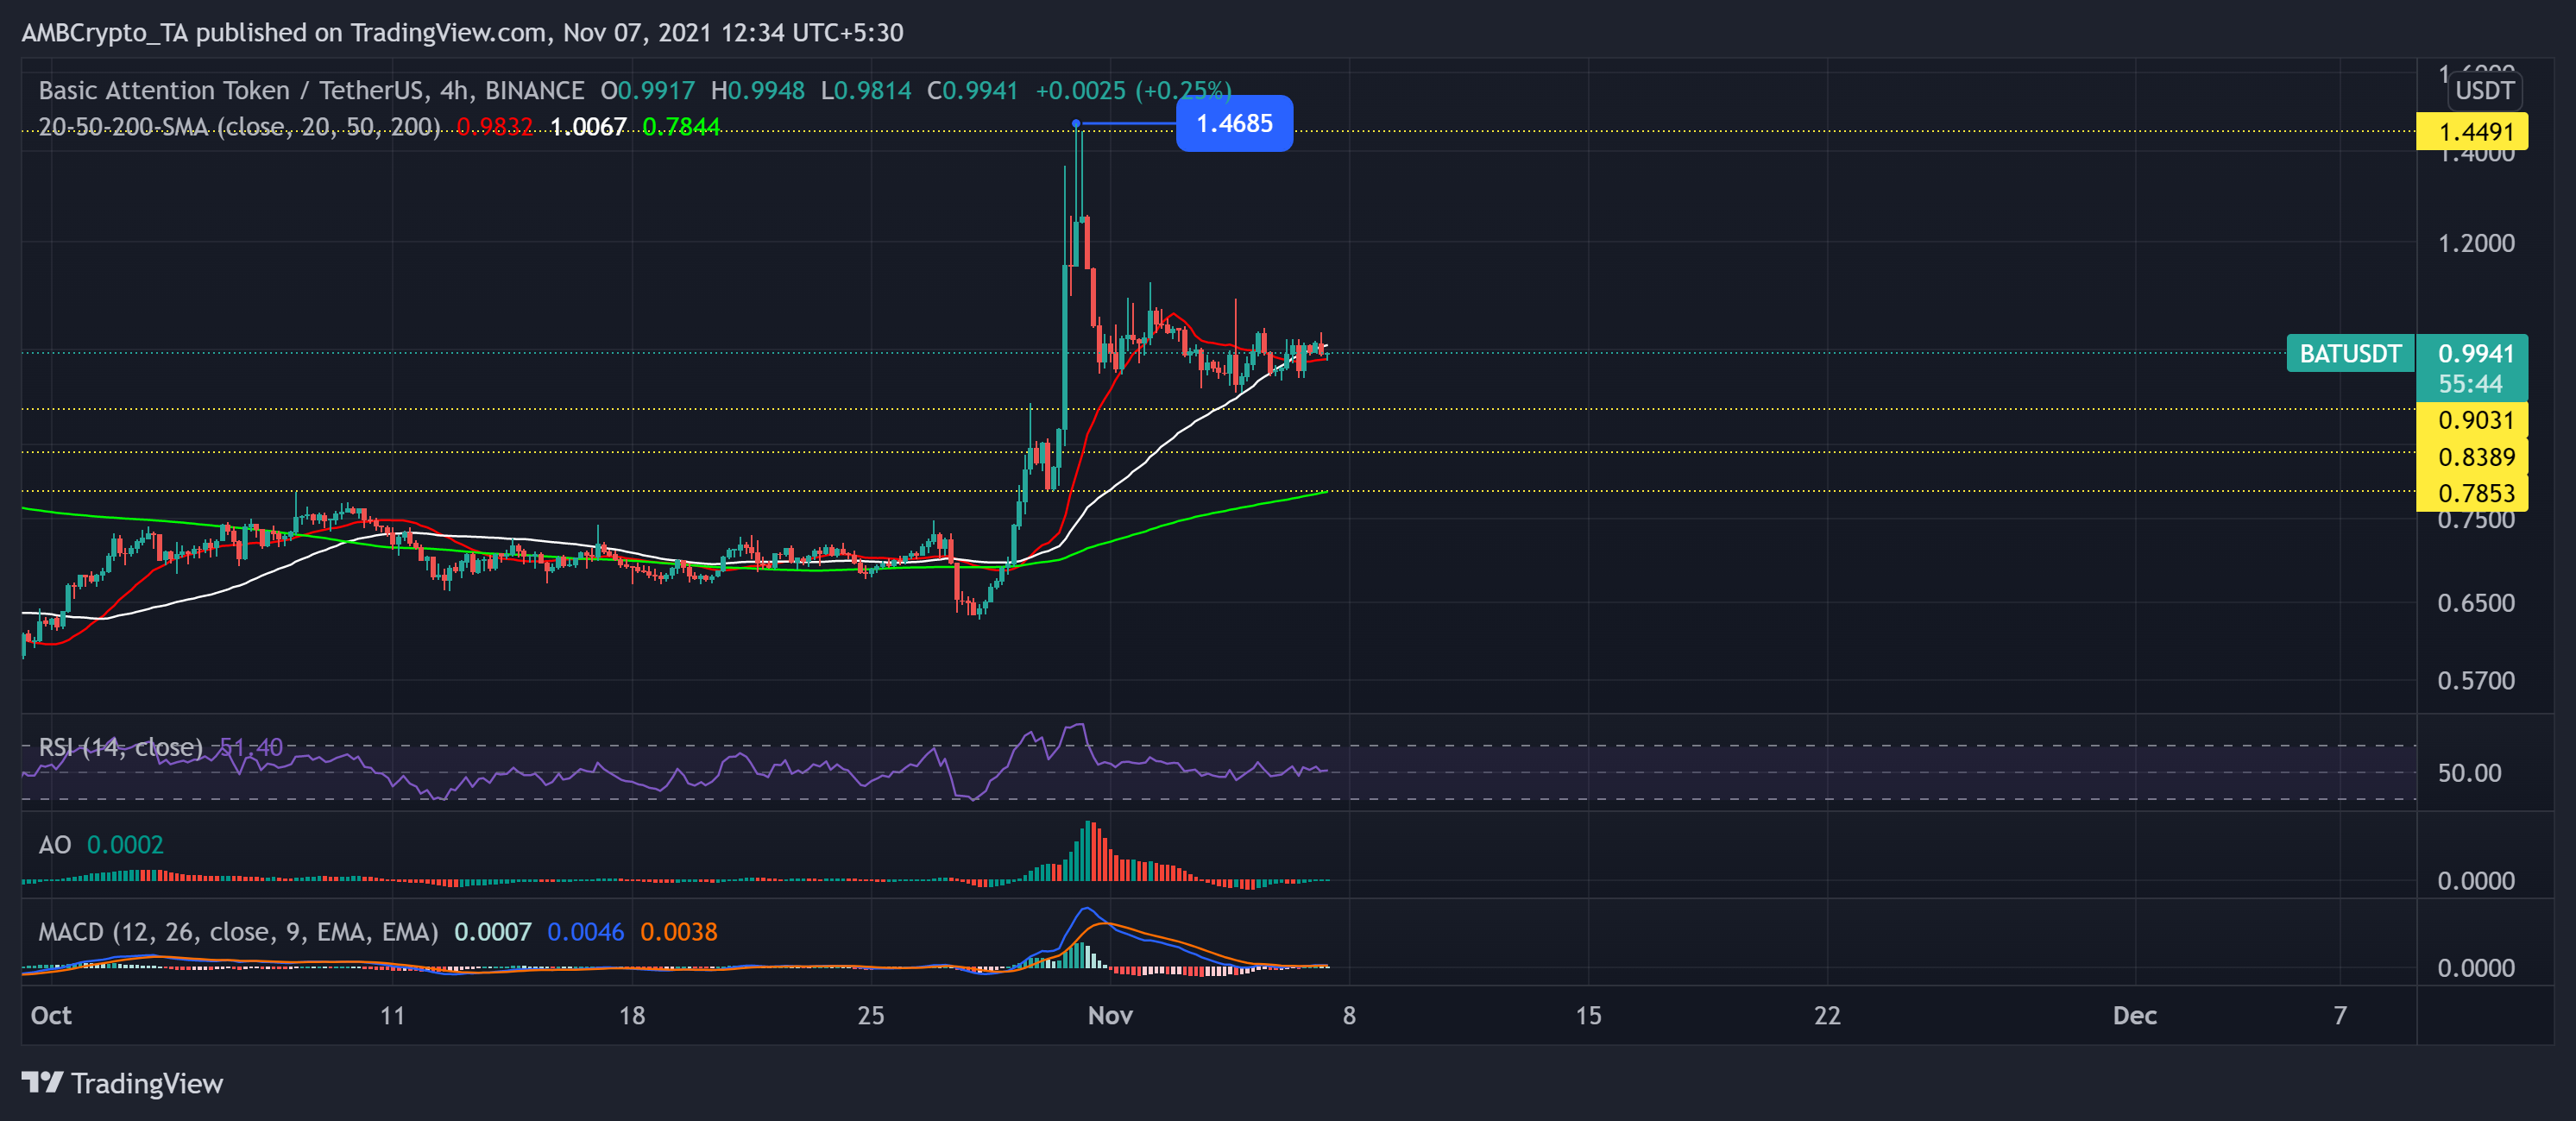
BAT witnessed an aggressive growth over the past month by noting a 31.75% ROI (monthly). Since 28 October, the bulls triggered an uptrend as the price quickly breached the immediate support at $0.9031. Consequently, it rallied to poke its 24-week high on 31 October at $1.4685.
However, since 31 October, the bears displayed vigor as the alt noted a 20.3% decline on its weekly charts. At press time, BAT traded at $0.9941. Now, Near term technicals hint at decreasing bearish influence.
The RSI stood close to the half-line and did not indicate a strong preference for either side. Further, MACD and AO readings depicted a slight decrease in selling strength as the buyers tried to gather momentum.
Zcash (ZEC)
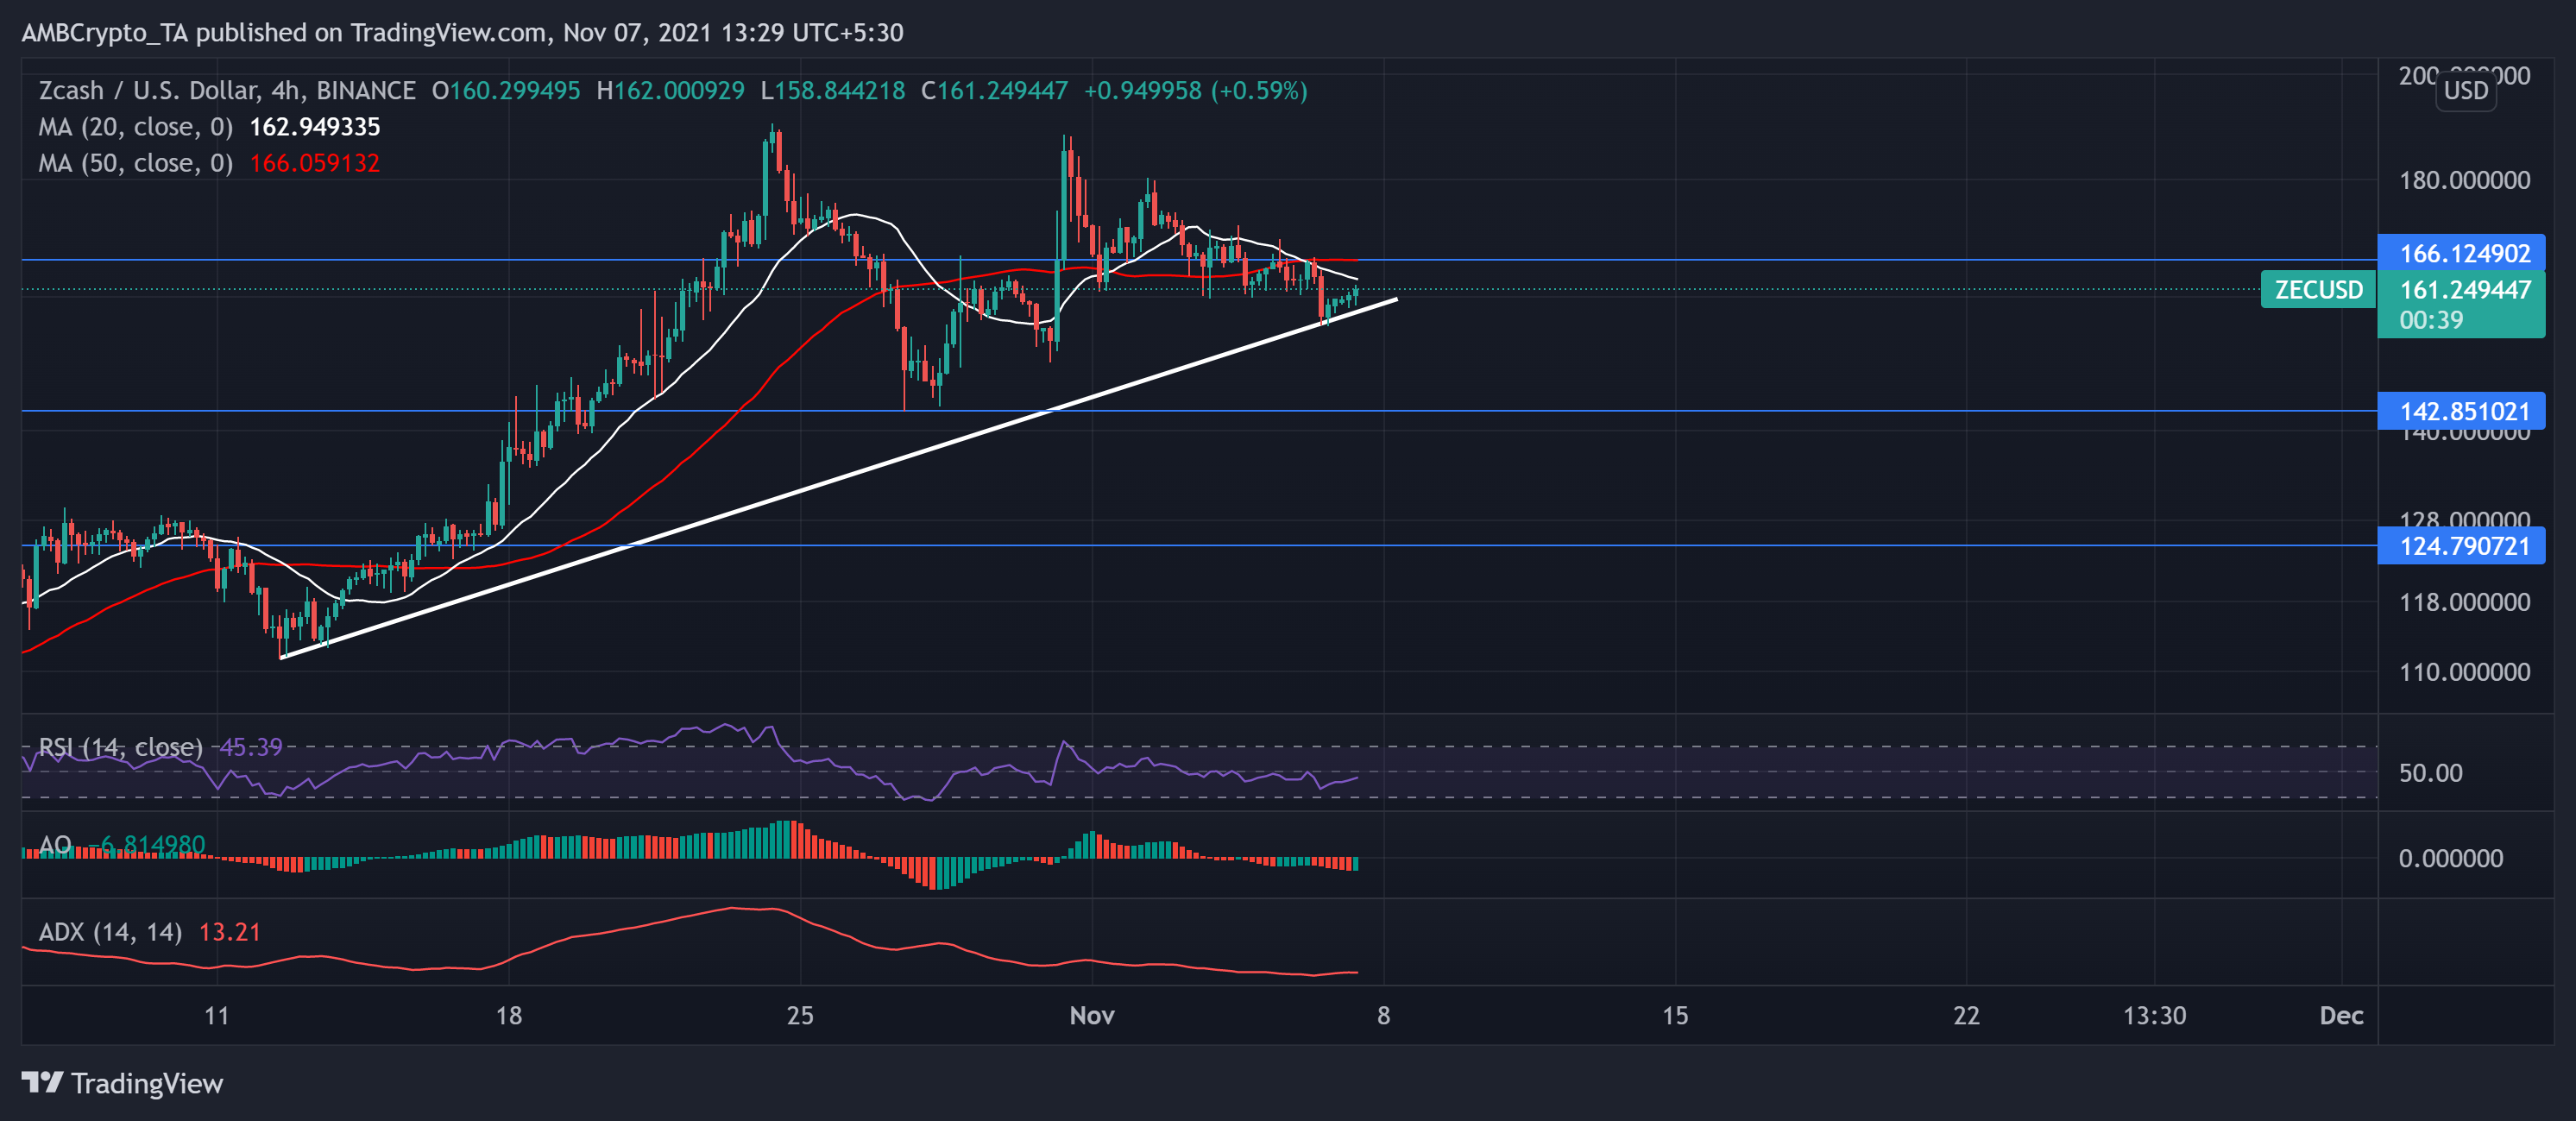
Since 13 October, ZEC’s price action assumed an uptrend as the bulls displayed their potential. The trendline marked higher lows over the past 25 days, visibly affirming the bullish vigor. The privacy-protecting digital currency registered a 29.06% monthly ROI. Consequently, ZEC reached its five-month high on 24 October.
However, the altcoin saw a 2.11% decline in 24 hours as the near-term indications slightly preferred the bears. At press time, ZEC traded at $161.25.
The trading price was below the 4-hour 20-50 SMA while the RSI stood at the 45-mark. These readings indicated a marginal preference for sellers. However, the RSI surged by nearly 10 points over the last day, hinting at increasing buying momentum. Additionally, the AO was below the zero line preferring the bears but flashed a green sign. Nevertheless, the ADX described a weak directional trend.


