Bitcoin Cash, Bitcoin, Binance Coin Price Analysis: 02 May

Bitcoin was projected to bounce back from $55,888-support and break north of the $58,480 upper ceiling. Bitcoin Cash could see some buying at the 38.2% fib level ($895) in case of a breakdown from the 50% Fibonacci retracement level. Lastly, Binance Coin presented upsides at $720 and $770 if the price broke north of the $640-mark.
Bitcoin Cash [BCH]
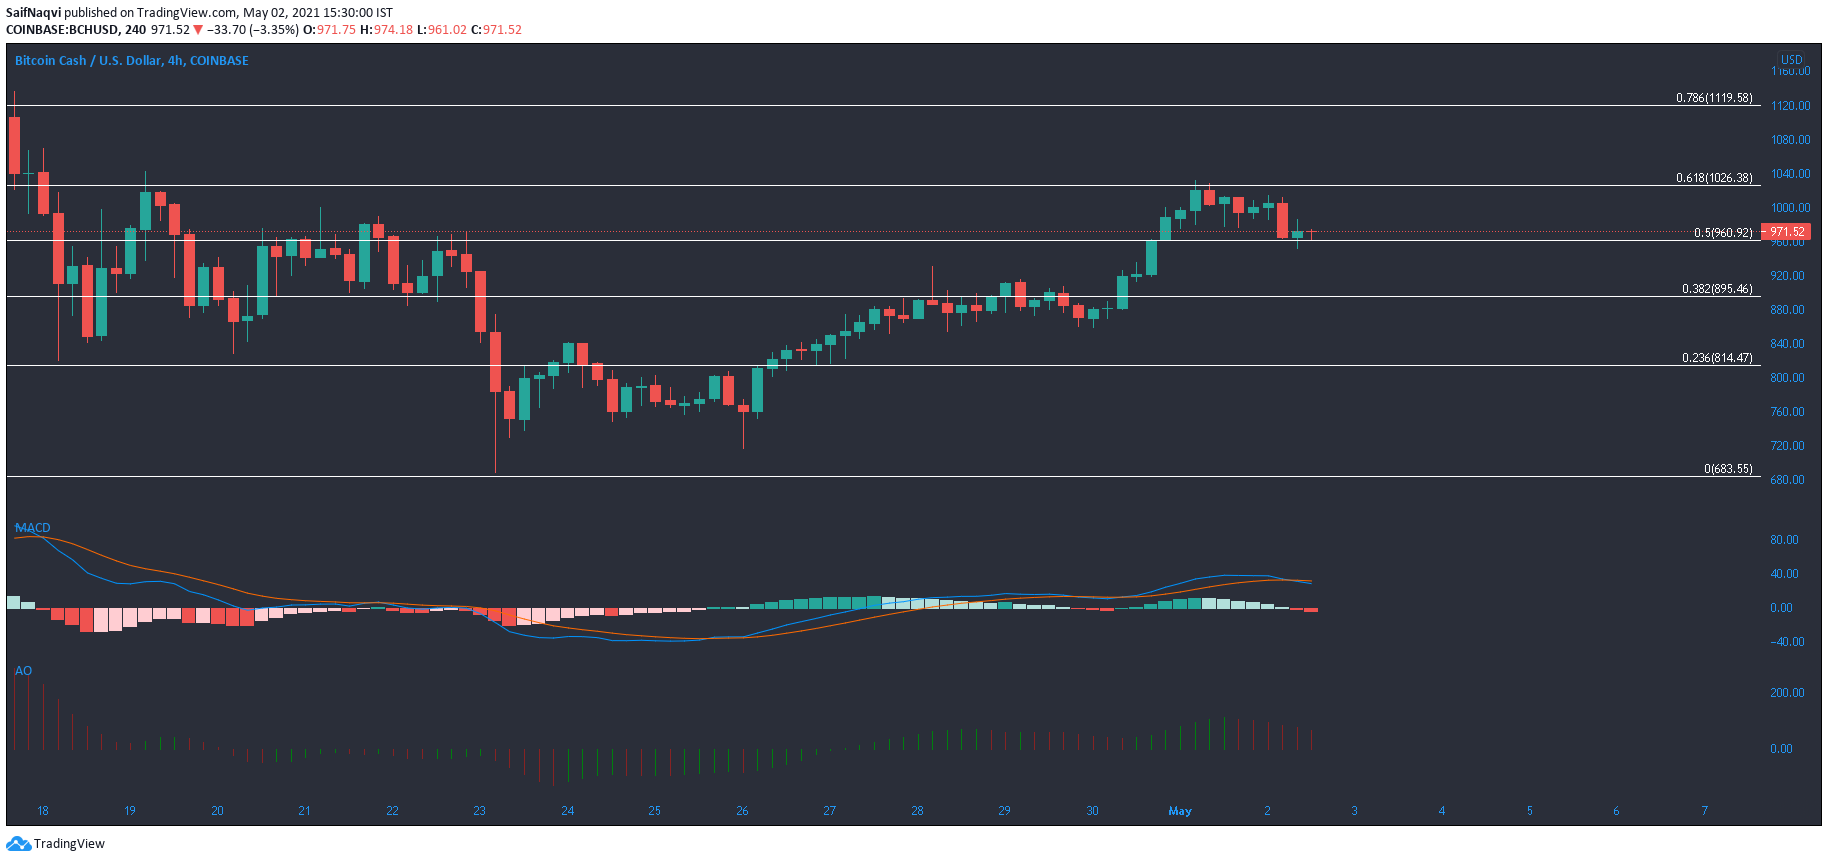
Using Bitcoin Cash’s drop from $1,216 to $689, some important Fibonacci Retracement levels were highlighted on the 4-hour timeframe. The chart showed that gains made over the past couple of days were restricted below the 61.8% Fibonacci level at a little over $1,000. Rejection at this upper ceiling pushed BCH south and toward the 50% retracement level present at $964.2, but this area was yet to establish itself as a strong support zone.
With MACD showing a bearish crossover between the fast-moving line and the signal line, a breakdown was possible over the coming sessions. Bearish momentum was also on the buildup according to Awesome Oscillator. The 38.2% fib level has been maintained by the bulls in the past and a dip towards this point would spur some buying in the market.
Bitcoin [BTC]
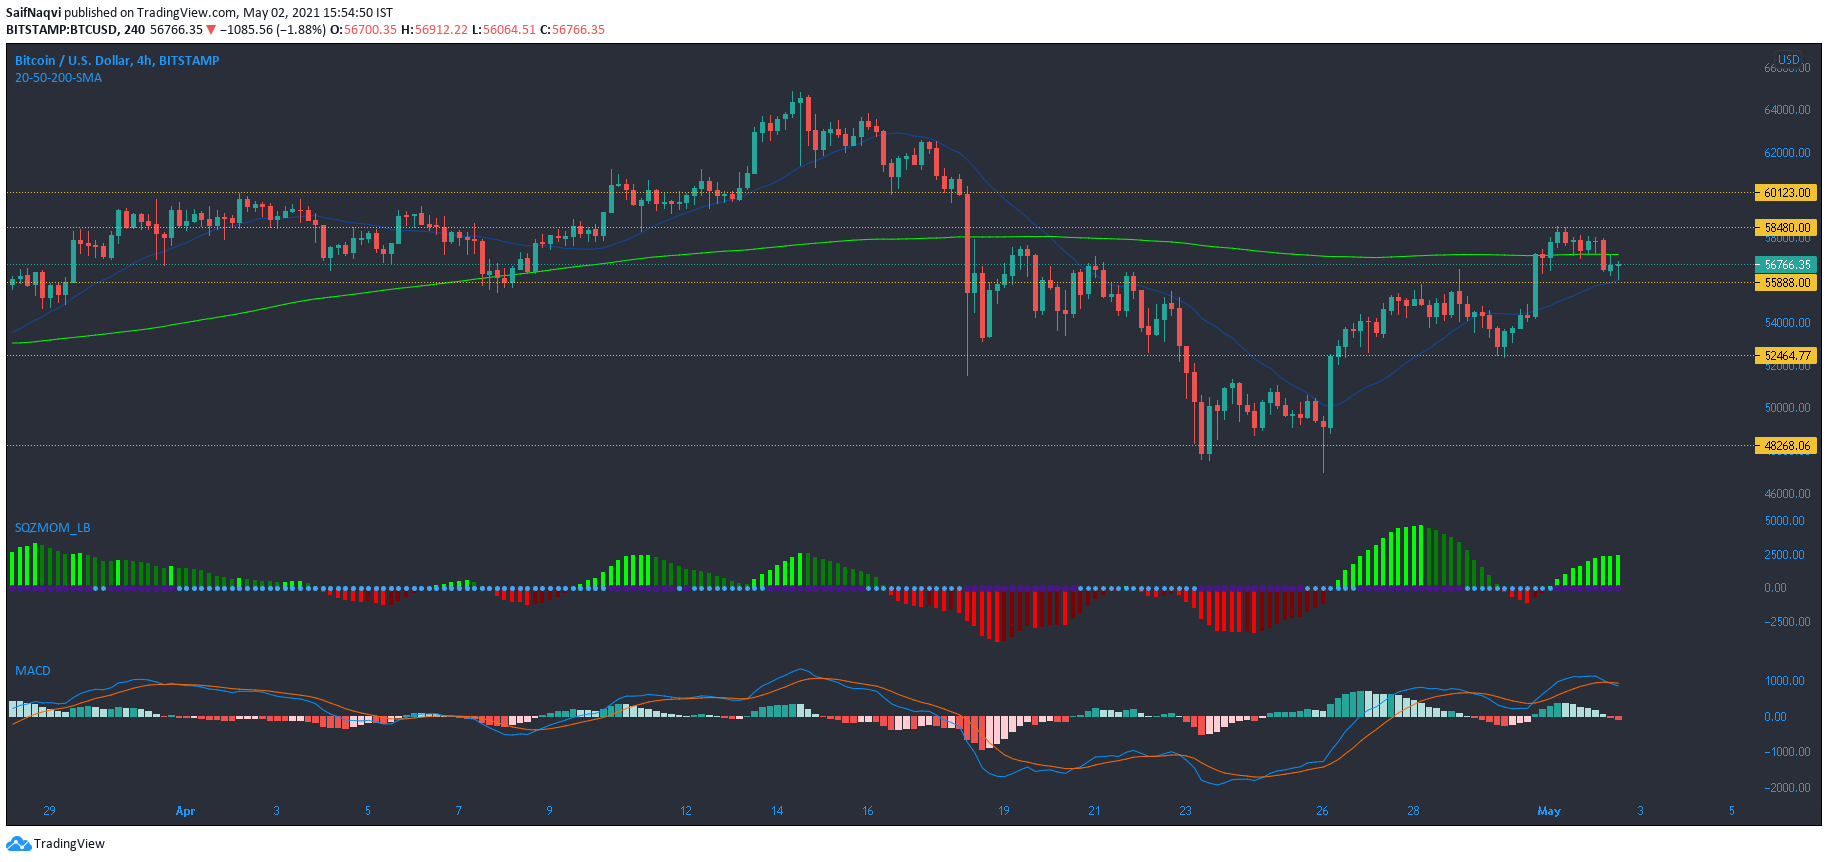
Bitcoin’s fall from an ATH of over $64,000 to below $55,000 showed a bearish crossover between the 50-SMA (blue) and the 200-SMA (green). As BTC continued its descent to a low of $47,000, the candlesticks remained well below their long-term moving average. However, a recovery in the market was underway as the king coin recaptured key levels over the past few days. Judging by its recent price behavior, a bounce back from the present support mark at $55,888 would see the price break above the $58,480 upper ceiling. This movement would also see the 50-SMA move back to the 200-SMA- a bullish development.
Squeeze Momentum Indicator showed rising momentum on the bullish side. The purple dots also indicated that a squeeze was not currently in effect. On the downside, MACD highlighted a bearish crossover but this was likely to be negated by the bulls.
Binance Coin [BNB]
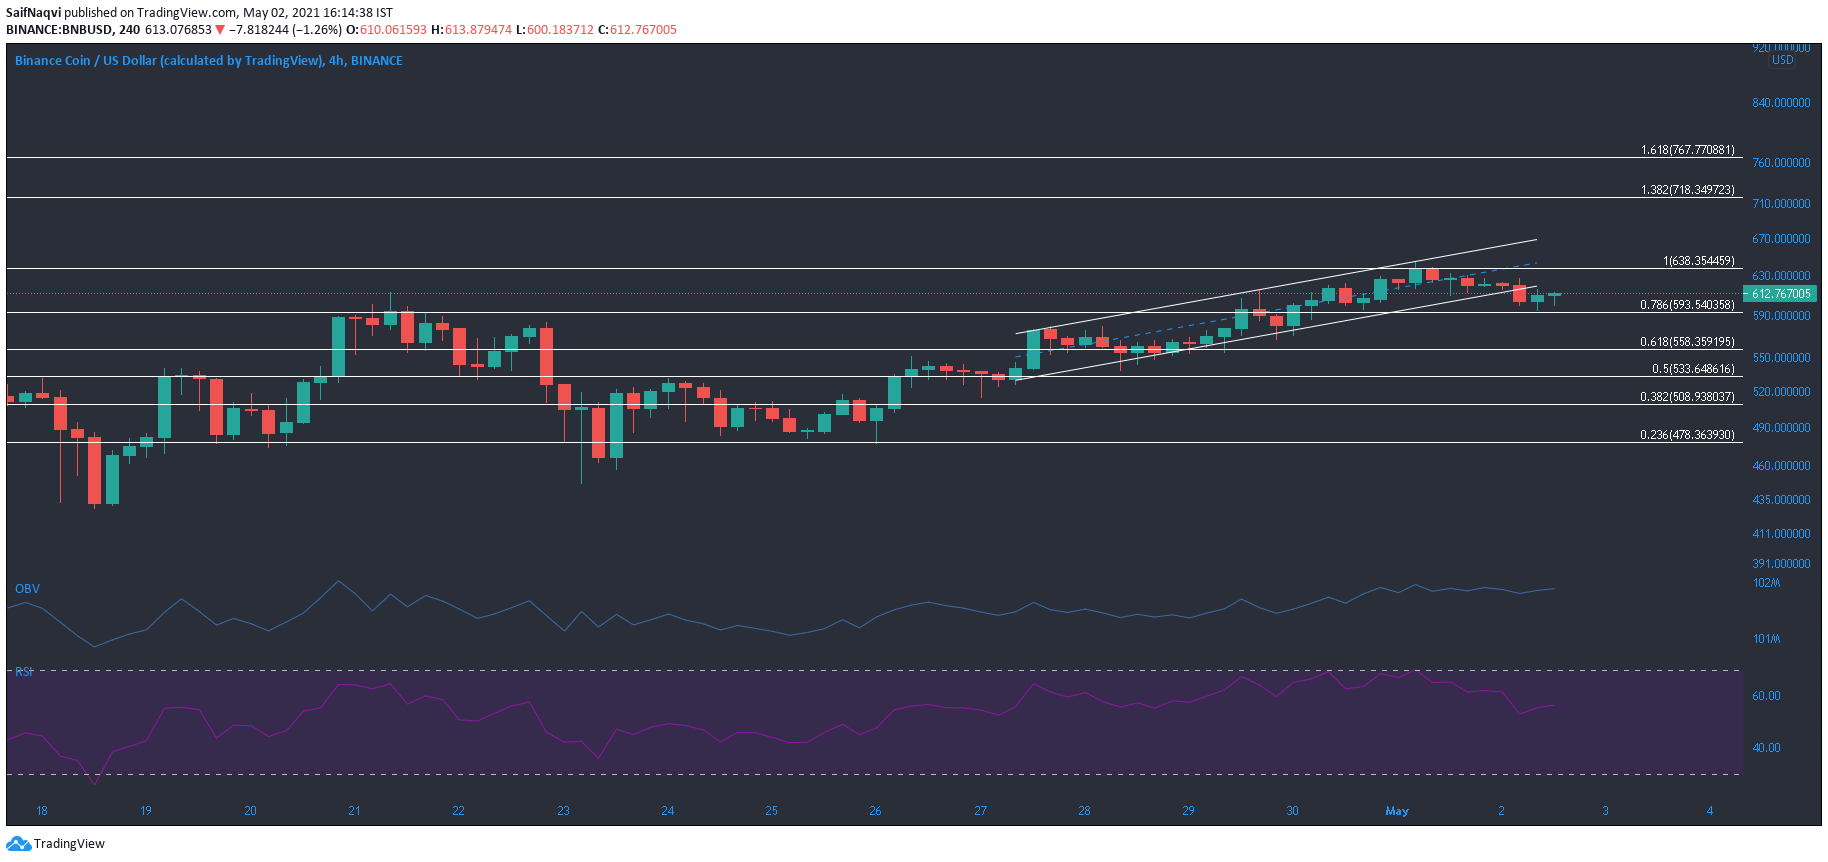
An ascending channel breakdown saw losses of over 3.5% from the lower trendline but Binance Coin found support at $597. OBV ticked up and buying volume outmatched selling volume as the price approached the aforementioned defensive line.
If the buying spree pushes BNB above the $640-barrier, the price would likely witness a surge and head towards $720 and even $770 before an eventual correction. RSI headed towards 60 and underlined a bull market despite losses made over the past 24 hours.


![Venice Token [VVV] likely to continue its long-term uptrend, supported by...](https://ambcrypto.com/wp-content/uploads/2026/07/Editors-1-e1784437616514.png)