
Bitcoin Cash maintained its rangebound movement but remained vulnerable to incoming selling pressure. Bitcoin SV presented a critical region to reclaim between its 23.6% and 38.2% Fibonacci levels. Finally, Litecoin threatened to drop to its demand zone in the event of a breakdown from $156.
Bitcoin Cash [BCH]
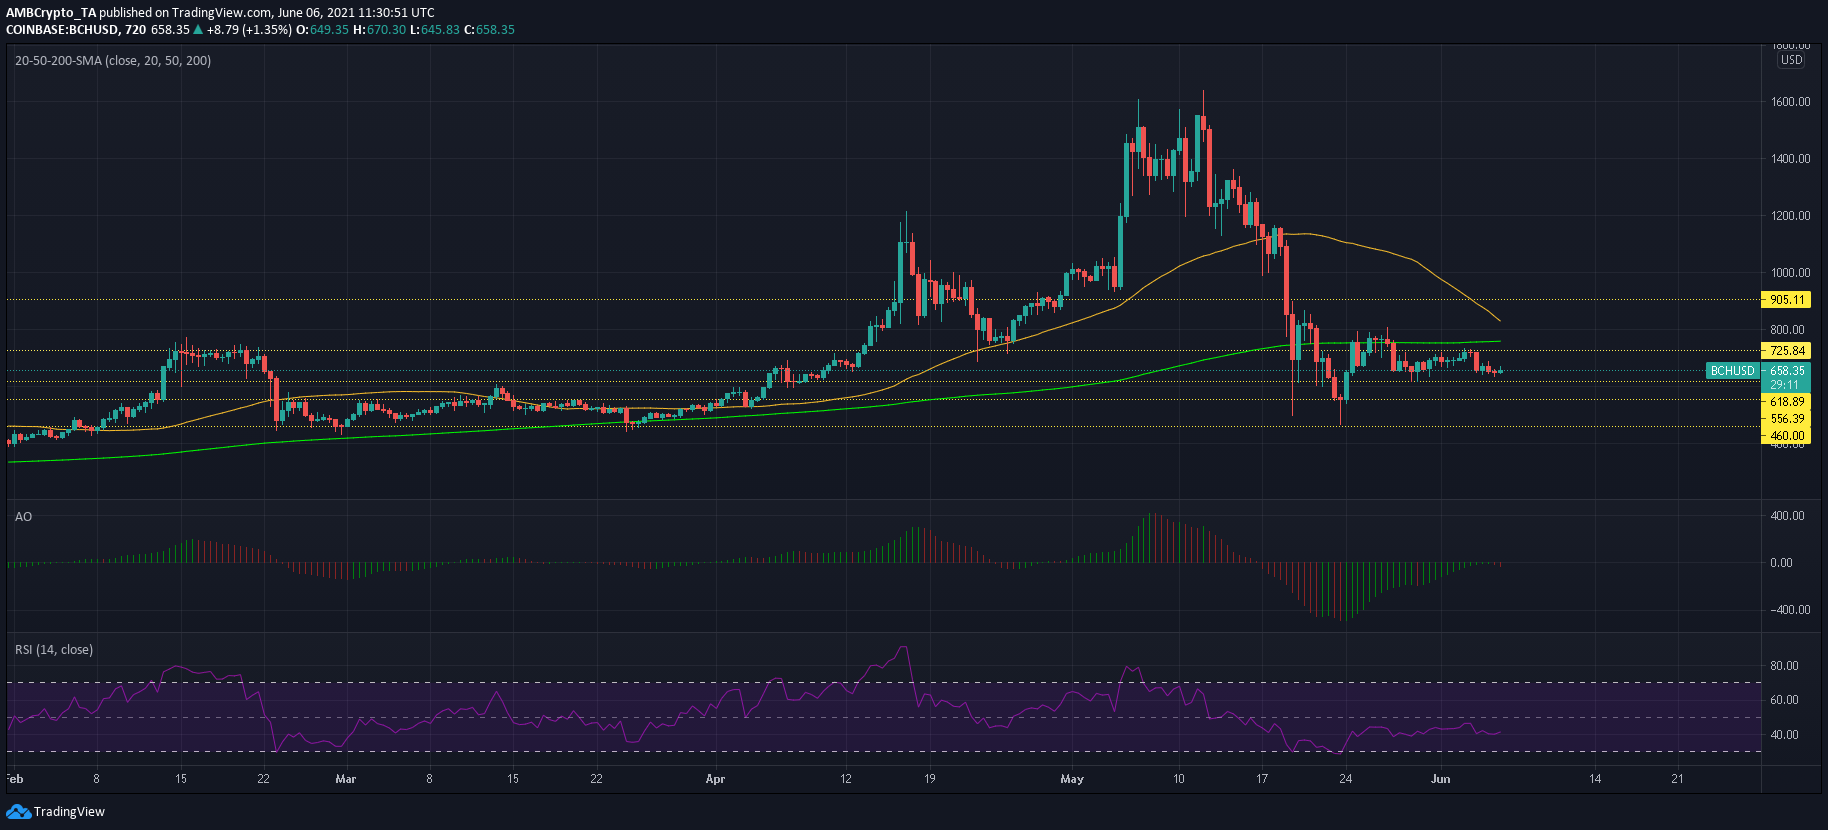
Source: BCH/USD, TradingView
On the 12-hour chart, Bitcoin Cash’s 50-SMA (yellow) and 200-SMA (green) seemed to near a point of confluence. A crossover below 200-SMA could bring in an added wave of bearish sentiment and stall BCH’s recovery attempt. The last time a crossover between the two averages took place was in Oct 2020 but the same was turned around in 15 days. However, that was back in a bullish broader market. Since a bearish market persisted at the time of writing, BCH’s road to recovery may not be as clear-cut as before.
Losing out on its current channel would likely see BCH move south towards a demand zone between $460 and $540. Consolidation was also likely if BTC moves sideways over the coming days. According to Awesome Oscillator, momentum was weak over the past few sessions. RSI was still below 50 and a breakout did not seem likely moving forward.
Bitcoin SV [BSV]

Source: BSV/USD, TradingView
A look at Bitcoin SV’s 12-hour chart showed that the cryptocurrency has been under the pump since its early-May highs. A drop from $460 to $130 represented a catastrophic loss in value of 70% and even though this number may be comparable to some other alts in the market, BSV has failed to recover key levels since the 19 May crash. An important area to reclaim lay between 23.6% Fibonacci level ($214.6) and 38.2% Fibonacci level ($266.9). These regions also showed some interplay between the 50-SMA (yellow) and 200-SMA (green).
Nevertheless, BSV lacked strength for a breakout- something pointed out by the RSI’s bearish territory. Naturally, Super trend Indicator flashed a sell signal but placed a stop-loss around $215.
Litecoin [LTC]
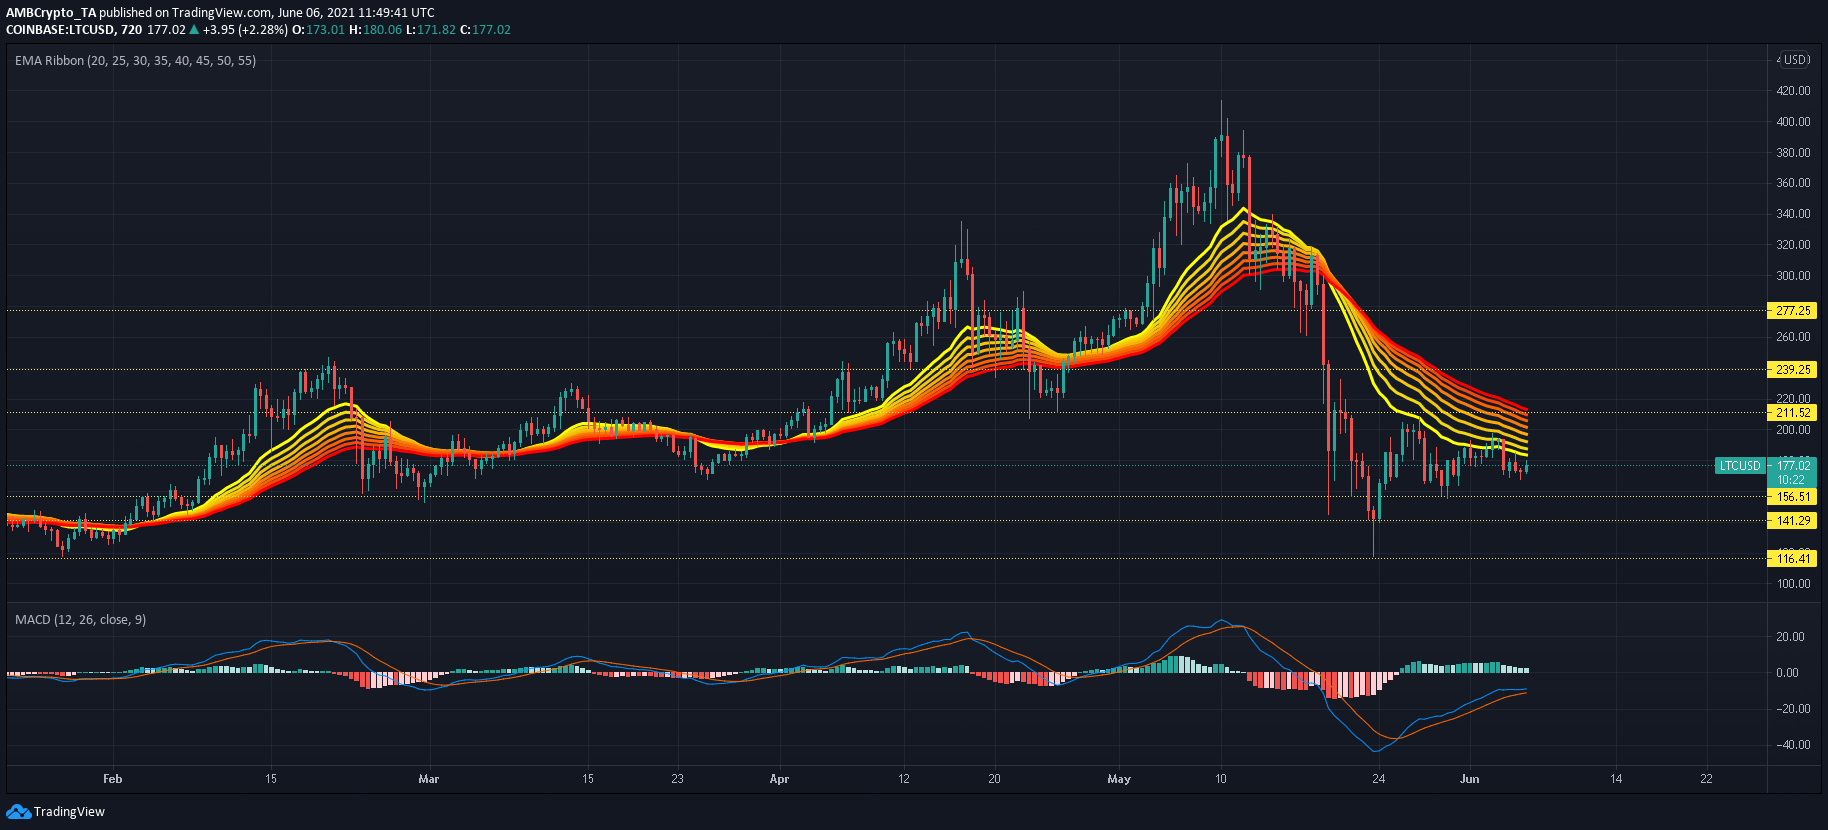
Source: LTC/USD, TradingView
The expanded nature of Litecoin’s EMA Ribbons showed that a bearish trend was very much in play even though the cryptocurrency formed lower highs. MACD’s histogram noted weakening momentum, while the Signal line was close to crossing above the Fast-moving line.
Focus should be on support zones over the coming days as LTC lacked bullish strength for a breakout just yet. In case of a breakdown from $156, LTC would likely revisit its demand zone between $116 and 141. Losing out on this region as well could trigger a sharper sell-off, but that depended on bearish cues from the market leaders.