


The broader crypto market has been in a downtrend since the fourth quarter of 2025, one that has extended into the present, with Bitcoin [BTC] trading around $67,000, below its yearly open.
Bitcoin Cash [BCH] follows a similar but harsher narrative. The asset has not only printed a new low; it has retraced all the way to its 2025 low as the bears take full control. At press time, BCH was closer to its all-time low than any possible path back to its all-time high.
BCH breaks multi-year support!
The bears tightened their grip as BCH broke below the $271 multi-year support that had held the asset intact and forced rebounds on several earlier occasions.
Price has since slipped past its 2025 low of $249.4 as sell pressure engulfs the market. Data at press time shows volume up 114% to $513 million, with the volume profile pointing to sellers dominating for a three-day stretch.
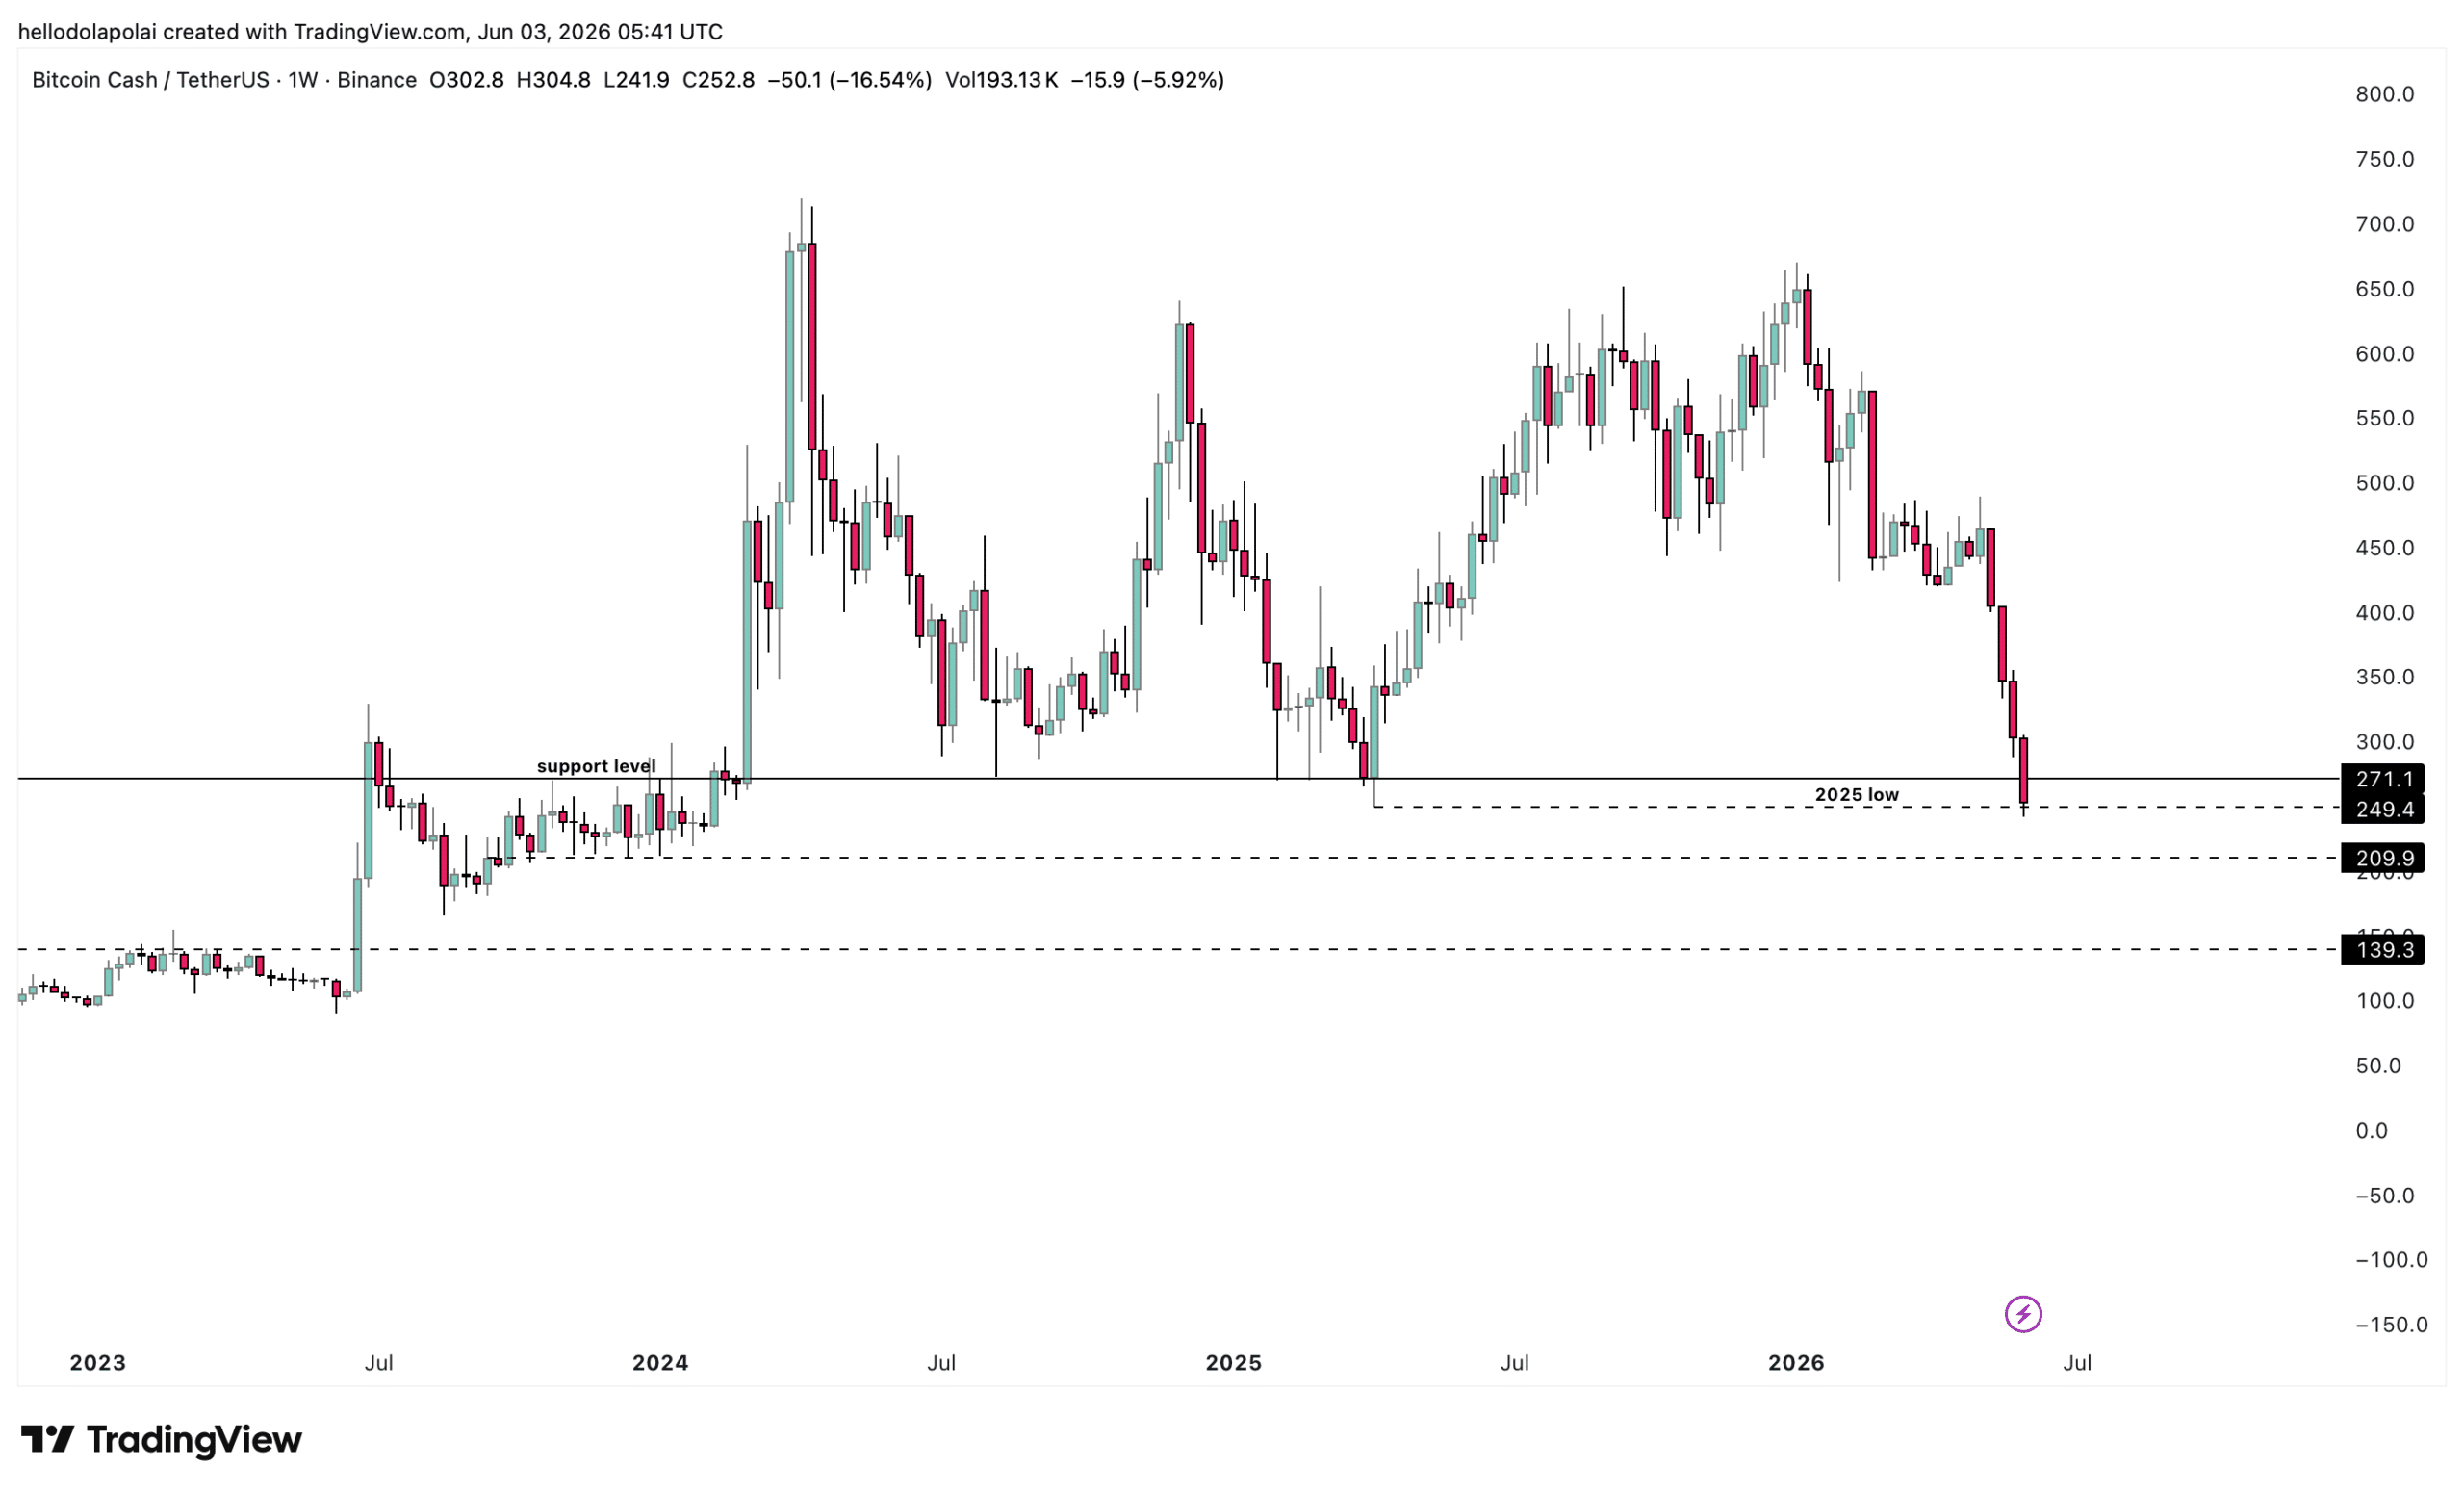
A candle close below the 2025 low would weaken BCH structurally and raise the likelihood of a deeper slide. The nearest target sits at the 2024 low of $209.9, and heavier selling could carry price further toward the $139.3 support zone.
A rebound at the 2025 low it just tagged is plausible on historical form, whether as the start of a reversal or a lower high before a fresh leg down.
Is BCH selling pressure increasing?
The momentum indicators tracking this move back the bearish read, among them the Aroon Indicator.
The tool uses two lines to gauge an asset’s trend, the Aroon Up (orange) and the Aroon Down (blue). The Aroon Up above the Aroon Down points to a bullish trend; the reverse points to a bearish one, with the gap between them measuring the strength of each.
At the time of writing, the chart displayed a textbook bearish setup, with the Aroon Down at 100.00%, and the Aroon Up at 0%.
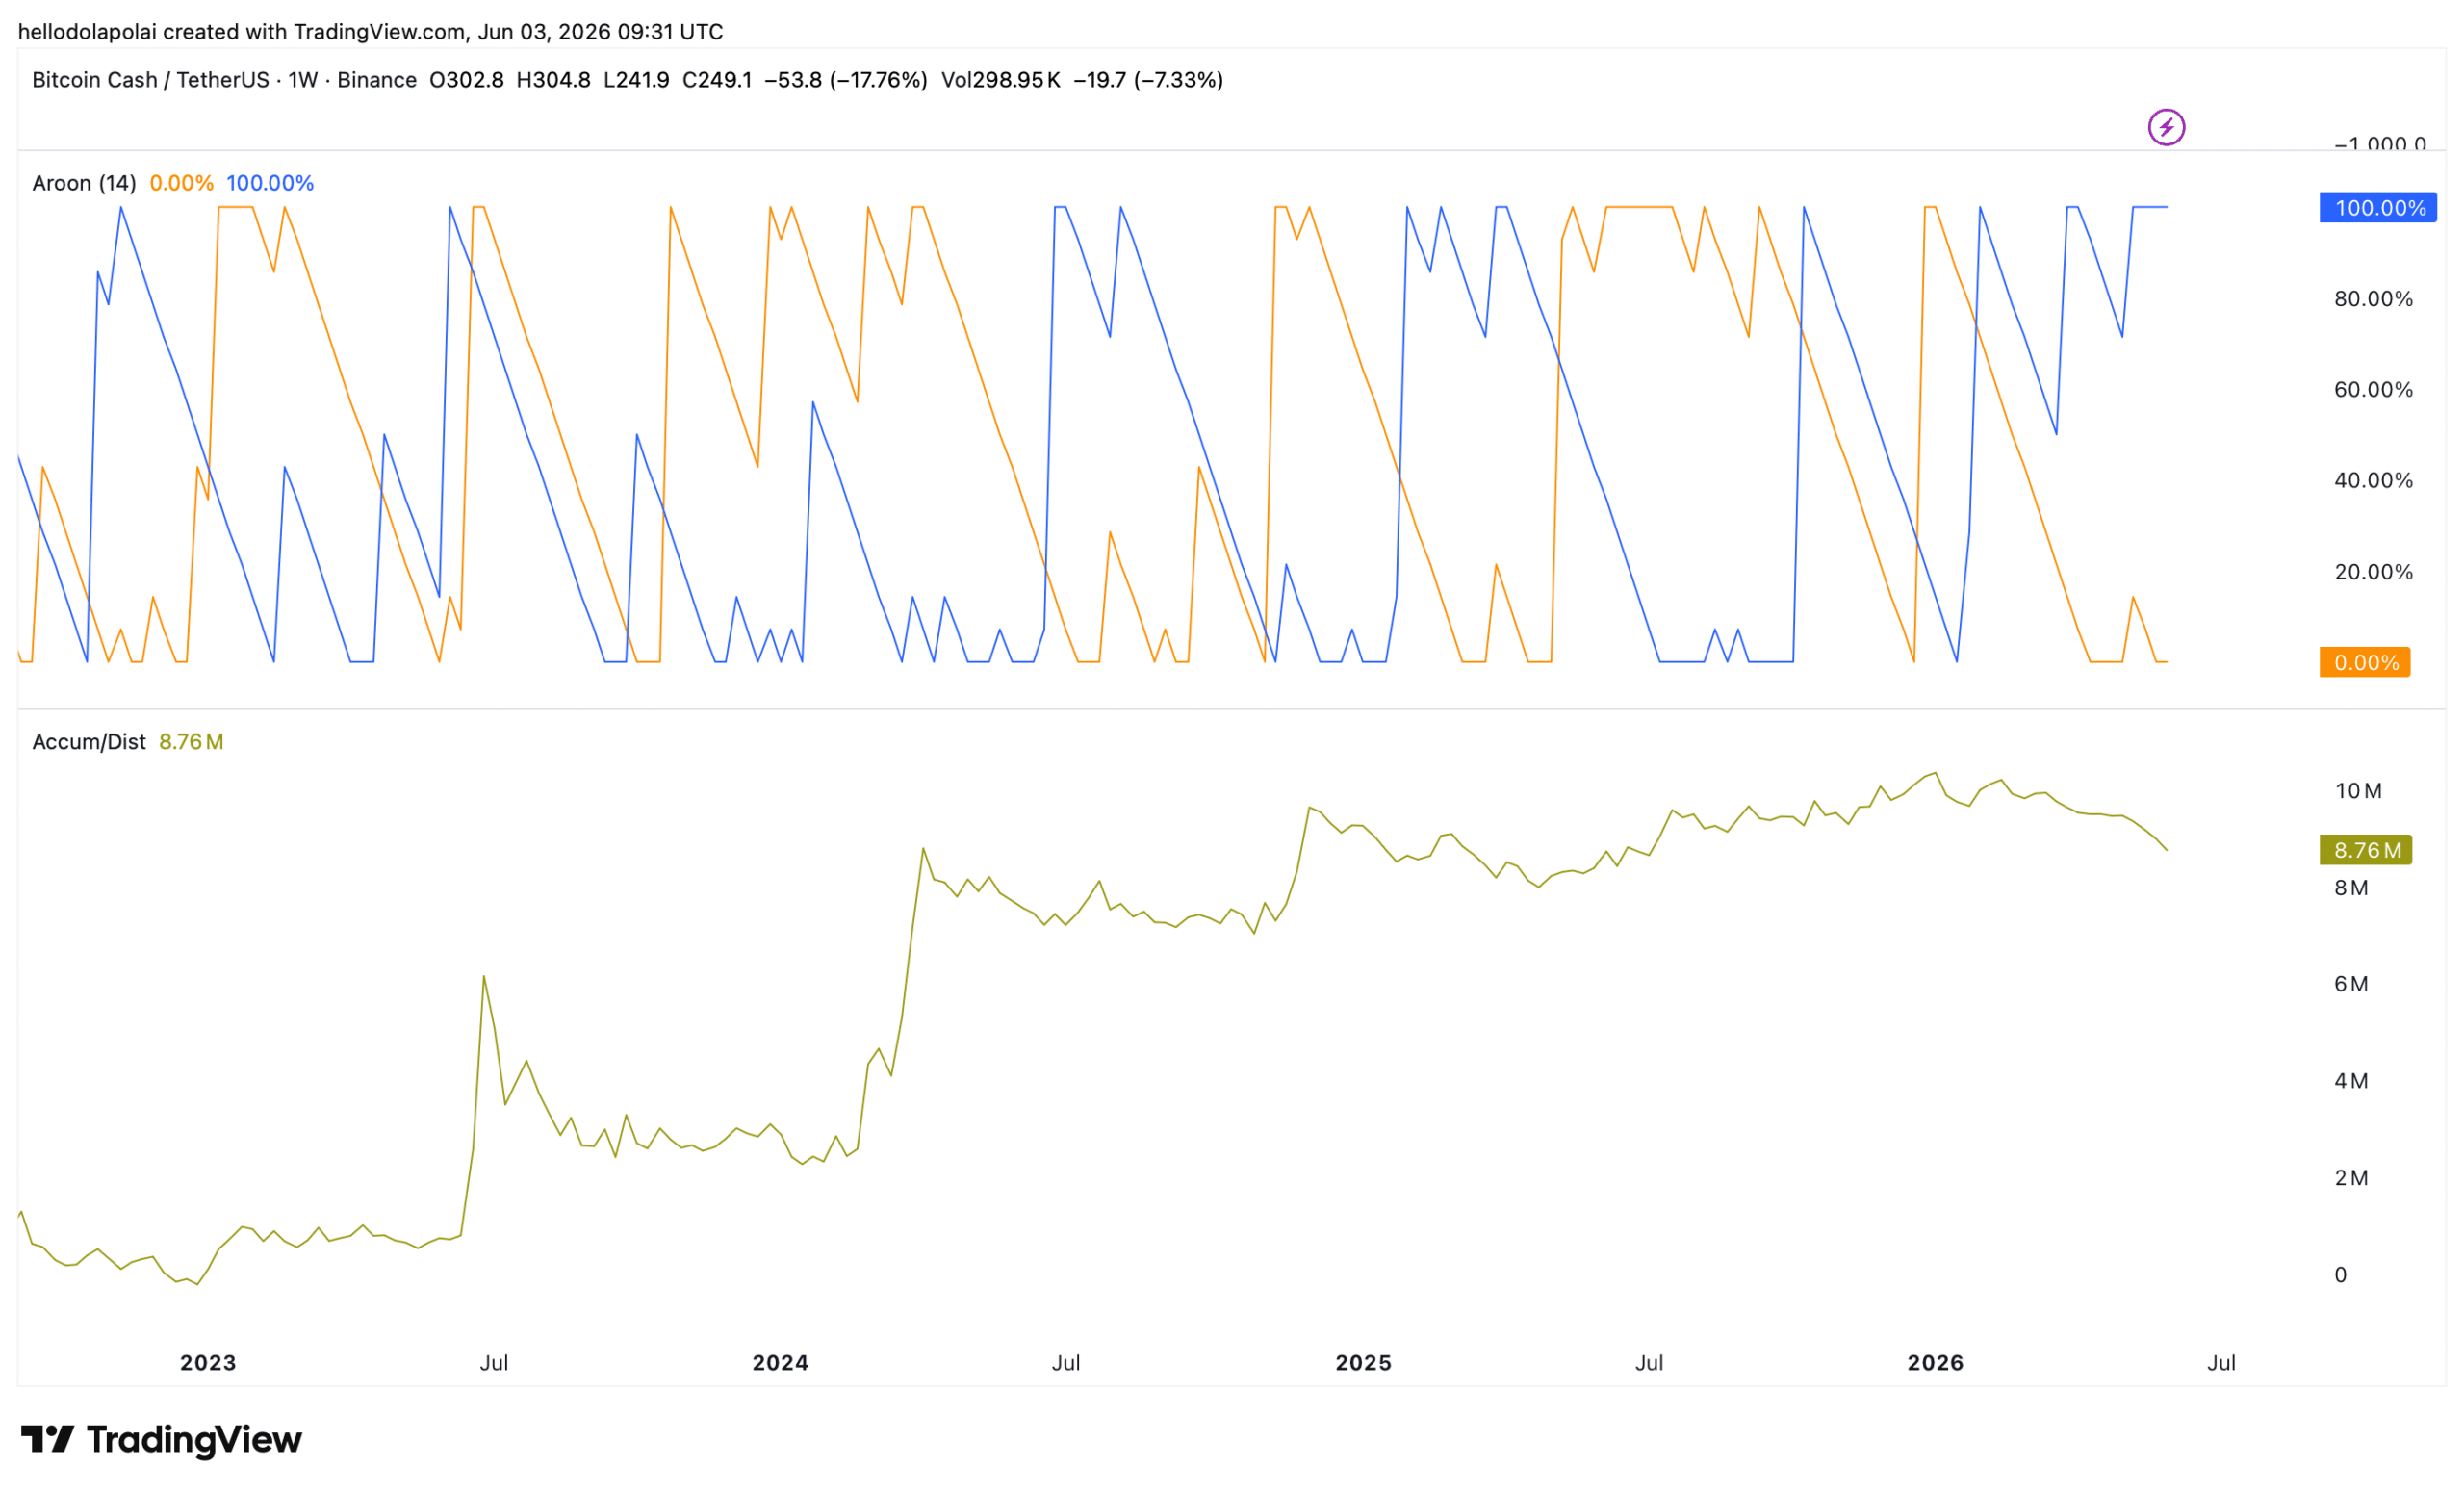
The accumulation/distribution trend completed the picture by tracking volume distributed to the market over time. Notably, the data estimated the total distribution volume at 8.76 million BCH.
Distribution, though, has not fallen as steeply as price over the same stretch. That divergence, if it holds, raises the probability of a rebound at the current level.
Large holders are leading the BCH sell-off
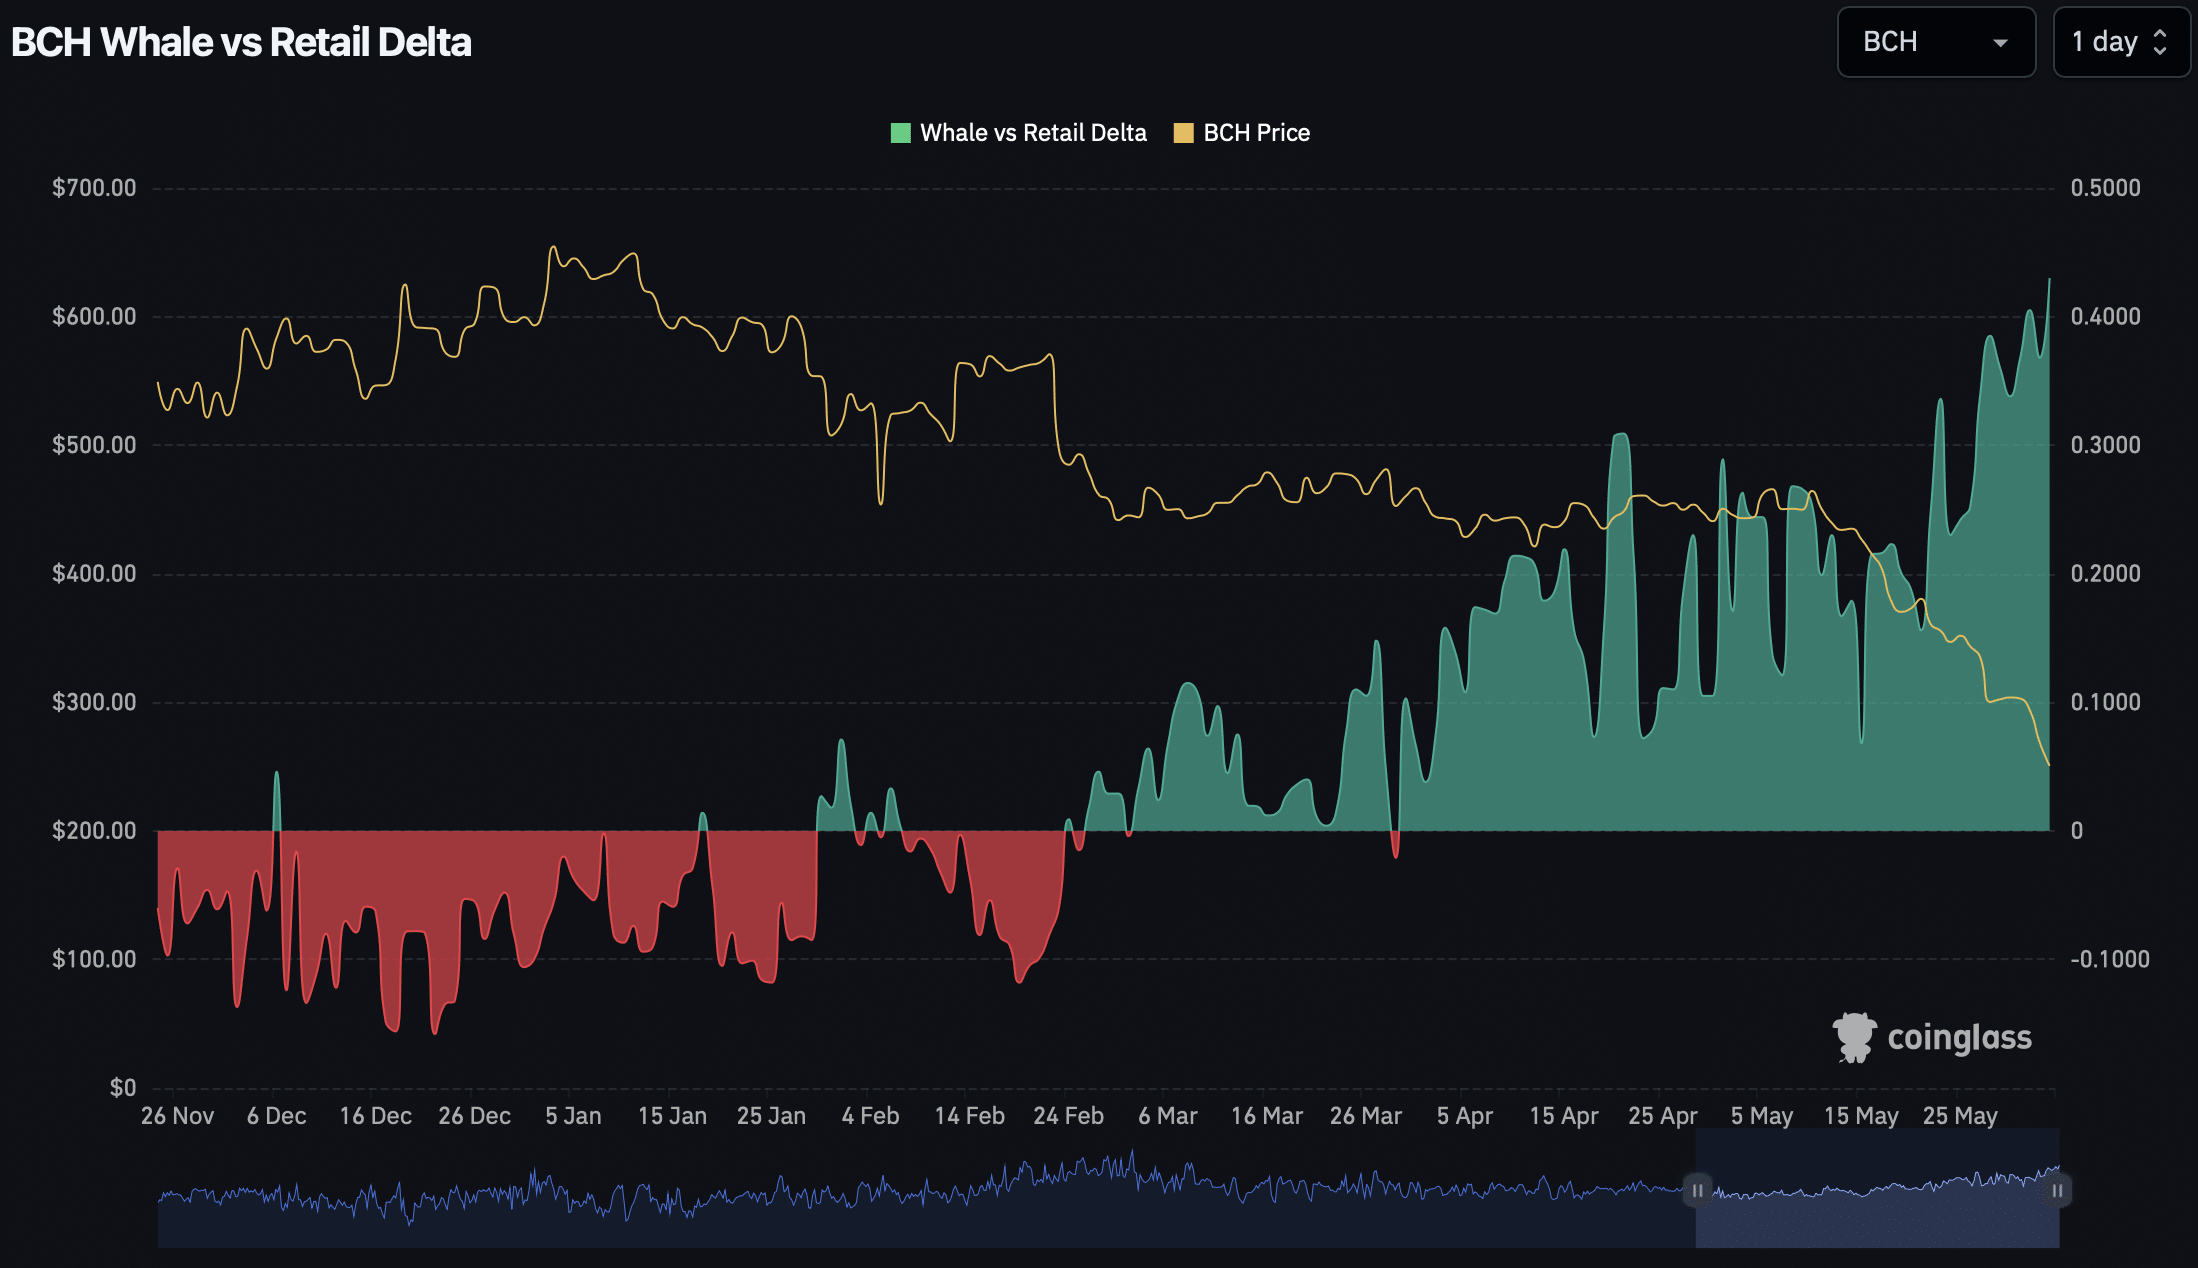
The whale-retail exchange delta, which tracks whether large holders or smaller retail traders are more active, shows whales leading the move.
Whale activity peaked on the 2nd of June, outpacing retail through the period. As long as the delta holds in the whale zone, large holders remain the dominant force behind the selling.
A cross to the red side of the chart would signal that retail has taken over the selling outright.
Final Summary
- Bitcoin Cash has broken below its $271 multi-year support and slipped past its 2025 low of $249.4, opening the door to the 2024 low at $209.9 as bears take full control.
- The Aroon Indicator shows a textbook bearish setup with a full 100% gap, while the whale-retail delta points to large holders driving the sell-off.