Bitcoin Cash could climb to this level before its next leg downward

Disclaimer: The findings of the following analysis are the sole opinions of the writer and should not be considered investment advice
Bitcoin Cash has been in a strong downtrend since mid-November. Selling pressure has been relentless and the market structure continued to remain bearish. Bitcoin was also not in a pretty spot on the chart as it had multiple levels of strong resistance overhead. Therefore, it appeared likely that Bitcoin Cash could climb to the $315 area to hunt for liquidity before reversing strongly downward.
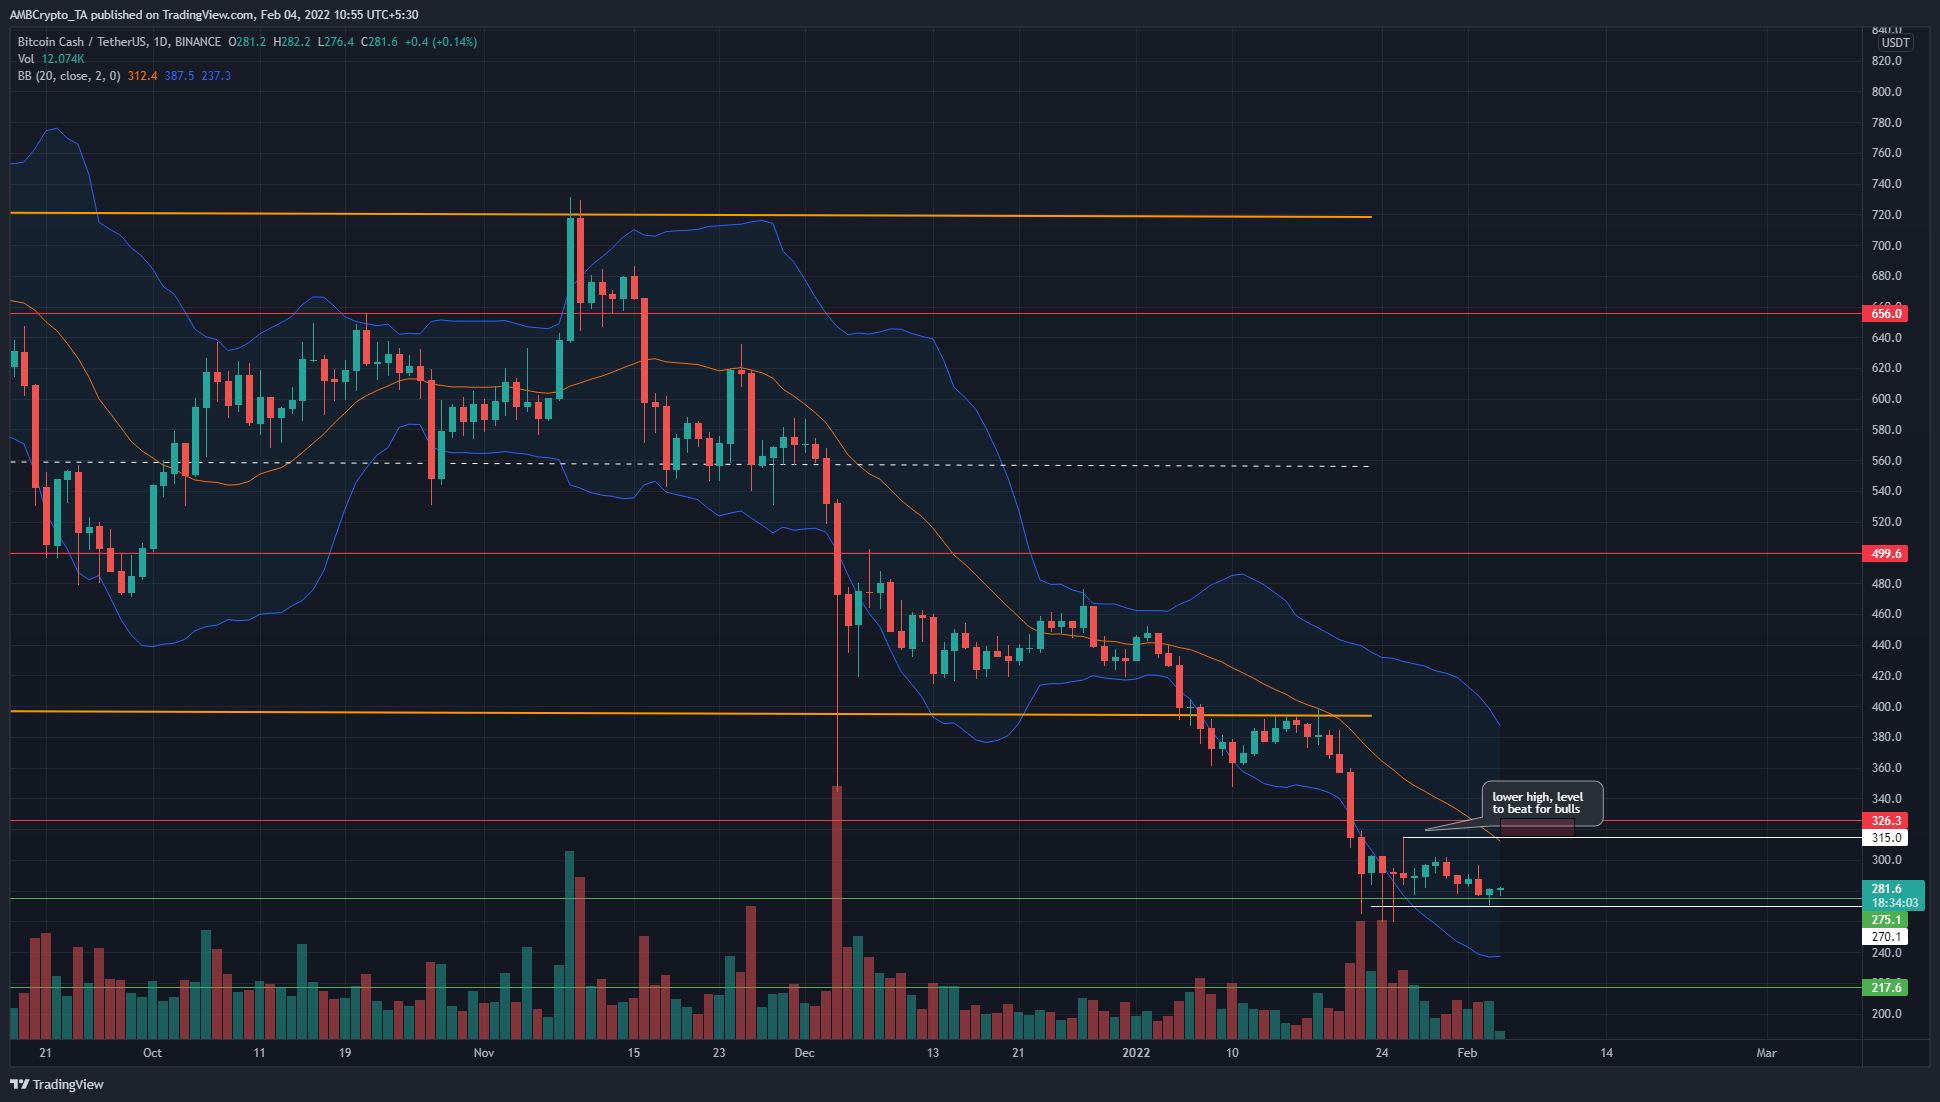
The previous lower high for BCH lay at $315. Above it lay a horizontal, long-term significant level at $326. In the past two months, $340 has also been an area that has seen buyers exhausted at. Putting this together, it appeared that the $300-$315 would be a far more attractive selling opportunity than an area to look to get into long positions.
BCH has found support at the $275 level, with dips to $260 and $270 in search of demand. A daily session close below $275 would likely mean BCH was primed for its next leg downward.
Quite often, before the next leg in a trend, the price returns to a previous area of interest in search of liquidity. For BCH at press time, this was the $315 area. A move higher for BCH could fool some market participants that further gains were imminent and could convince some buy orders to be executed. The price could then reverse strongly and force the late buyers to sell, fueling the move down.
Rationale
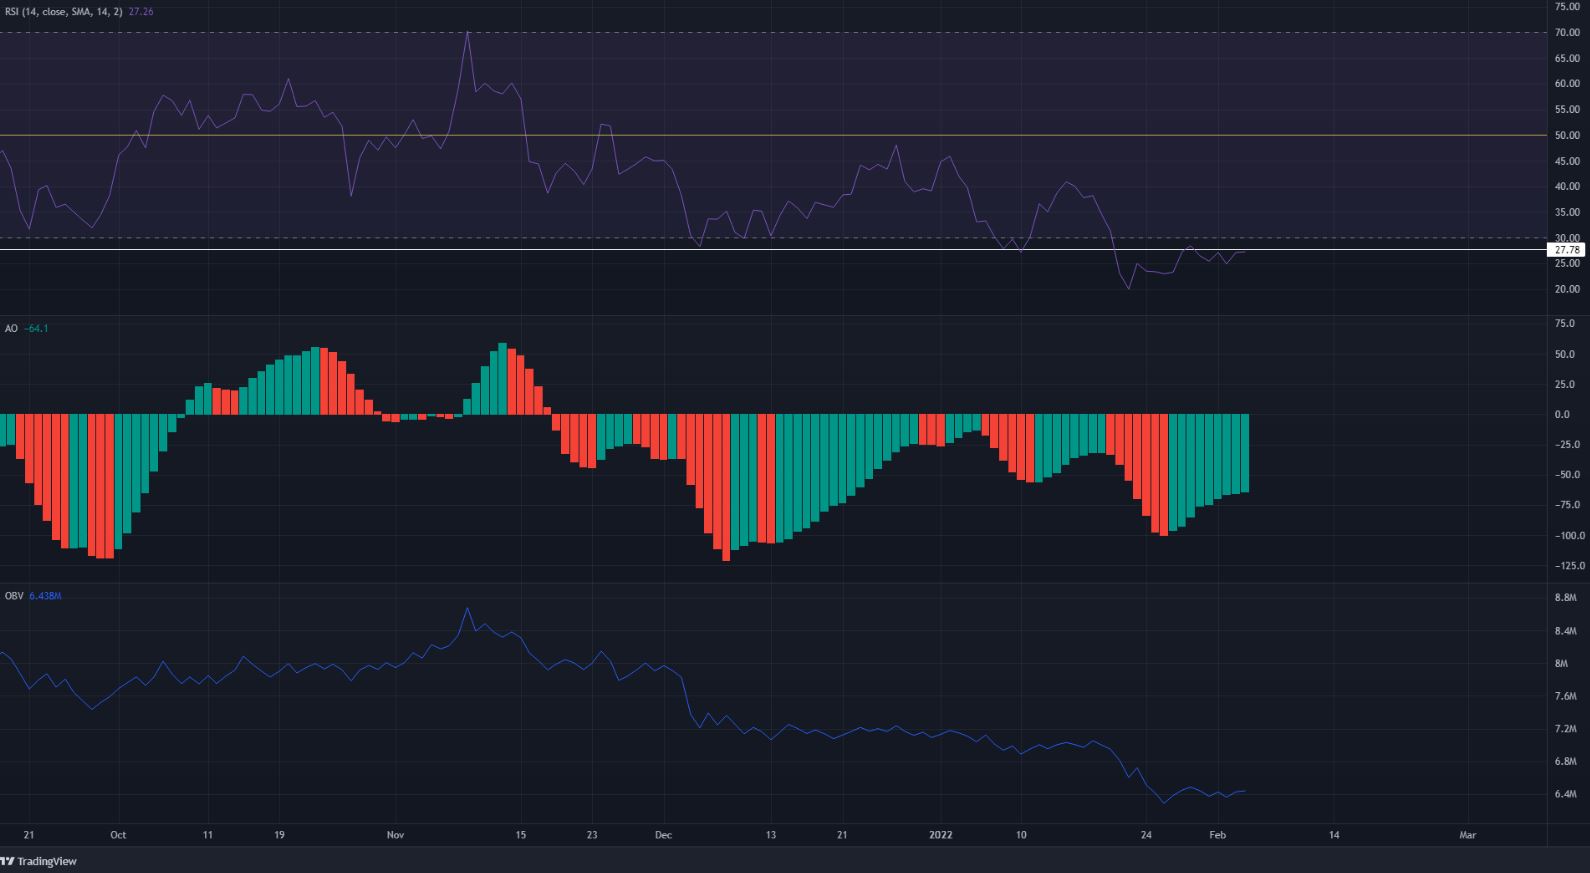
The RSI on the daily chart has been in the oversold territory for more than a week prior to press time. The 27-28 area is a place where the RSI tended to bounce in the past, but at the time of writing, RSI was knocking on this level from below it. This highlighted the extreme bearish conditions of the past few days, and a relief rally could follow from the oversold territory.
The Awesome Oscillator was well below the zero line. This shows the strong downward momentum in the past few weeks. However, it has registered green bars over the past week, which showed bearish momentum has slowed down.
The OBV continued to trend strongly downward and no significant buying volume was seen.
Conclusion
The $315-$325 area remained one to watch out for. It was not impossible that BCH could climb past $325 and flip it to support in the coming weeks, but the more likely scenario was that a move to these previous lower highs would give BCH the fuel it needed for the next leg downward.


