
Bitcoin Cash was on its way to test the $288 level of resistance. Dash lacked momentum as it approached a crucial level at the $100 mark, and Ethereum Classic formed a bearish reversal pattern that could see the price drop back toward support.
Bitcoin Cash ]BCH]
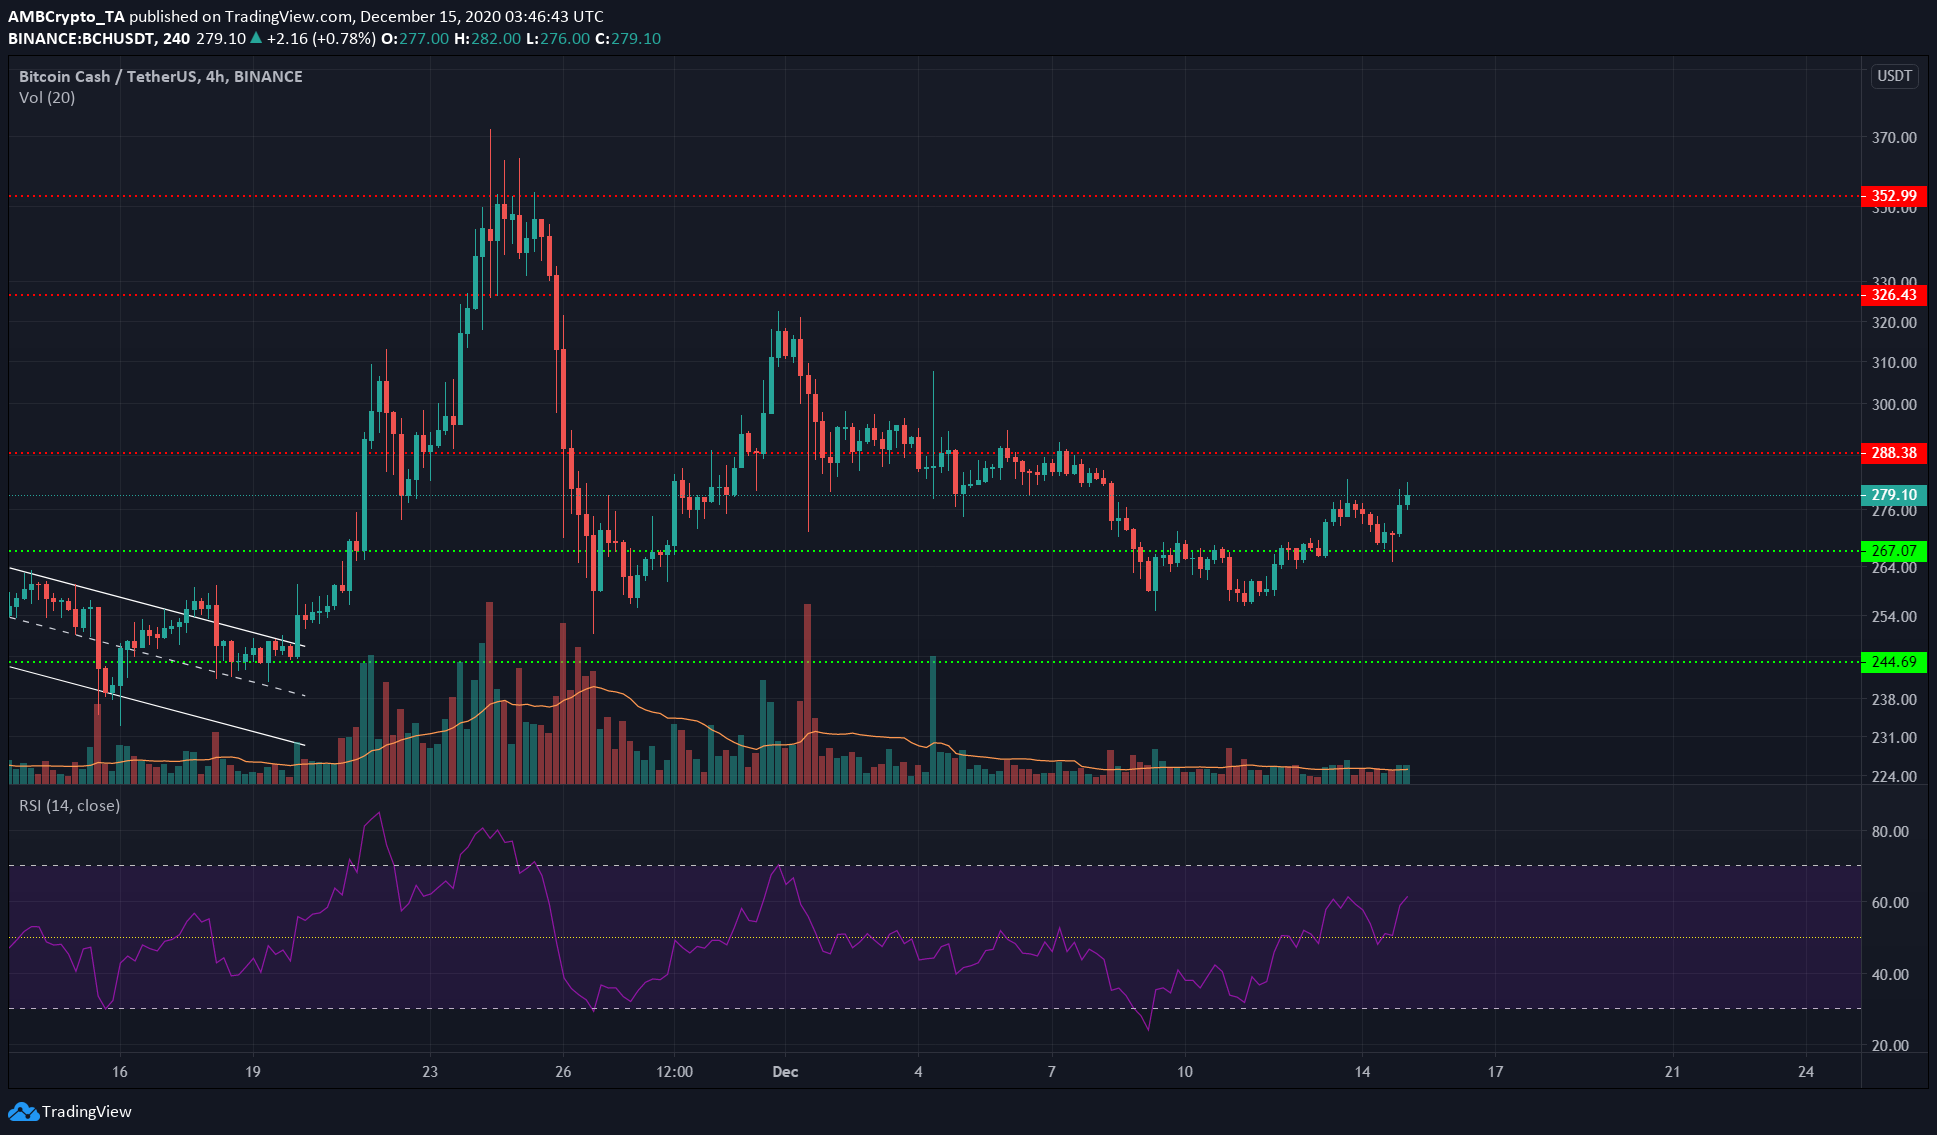
Source: BCH/USDT on TradingView
Over the past 24 hours, BCH dipped from $275 to retest the level of support at $267, confirm its flip to resistance, and began to climb in value once more. It was trading at $279.1 at press time.
The RSI also climbed above the neutral 50 and stayed above it over the past couple of days. This could see it test the $288 resistance, and possibly flip that to support as well.
The trading volume has not yet picked up behind BCH, and a surge in volume would indicate a strong move in the making.
Dash [DASH]
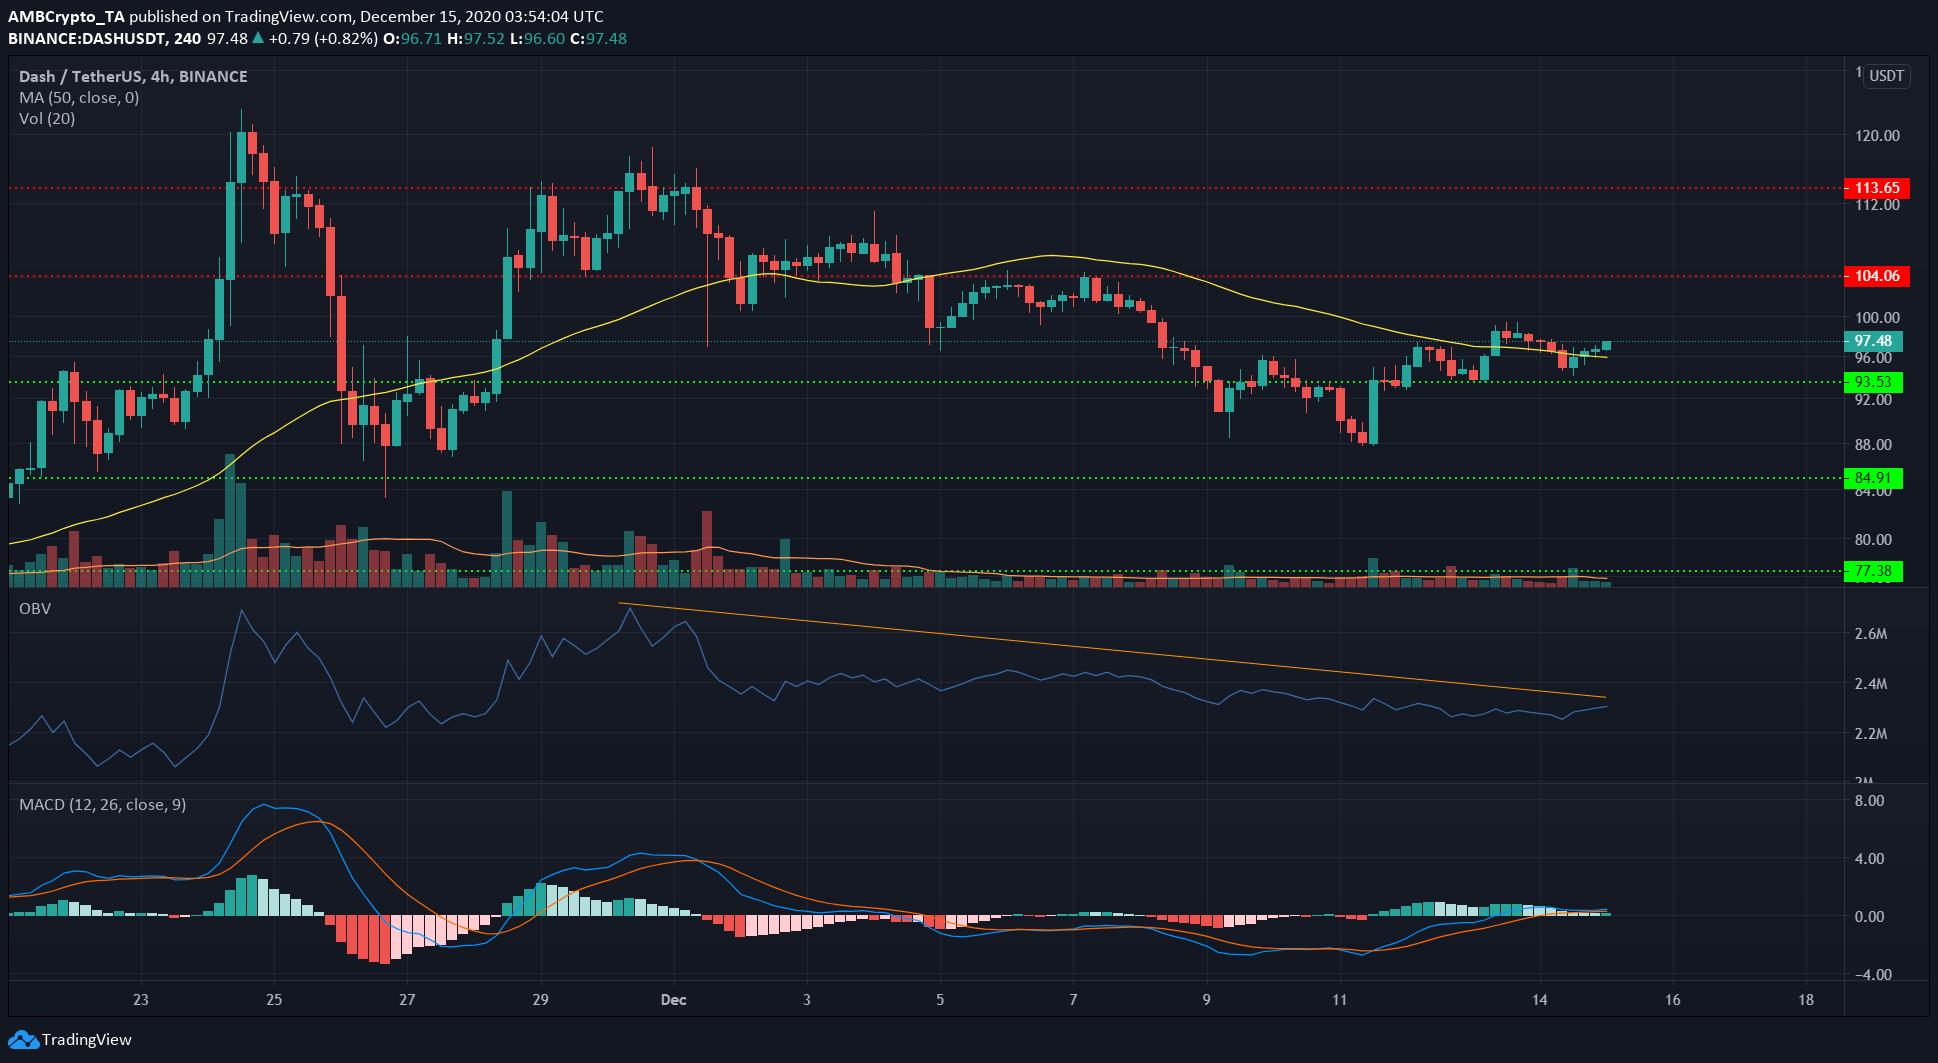
Source: DASH/USDT on TradingView
Dash climbed above the $93.5 level and flipped it to support. It also managed to climb above the 50 SMA (yellow) and could use this moving average as support.
This slightly bullish development is marred by the fact that the MACD showed no momentum over the past few trading sessions, as the MACD and signal lines were nearly overlapping and right atop the zero line.
Neither the trading volume nor OBV saw much activity. The past few days have seen more selling than buying for DASH in the market, even as the price approached $100.
The region at $100-$104 will be crucial. A breakout to the upside is more likely, considering that the longer-term trend has been bullish.
Ethereum Classic [ETC]
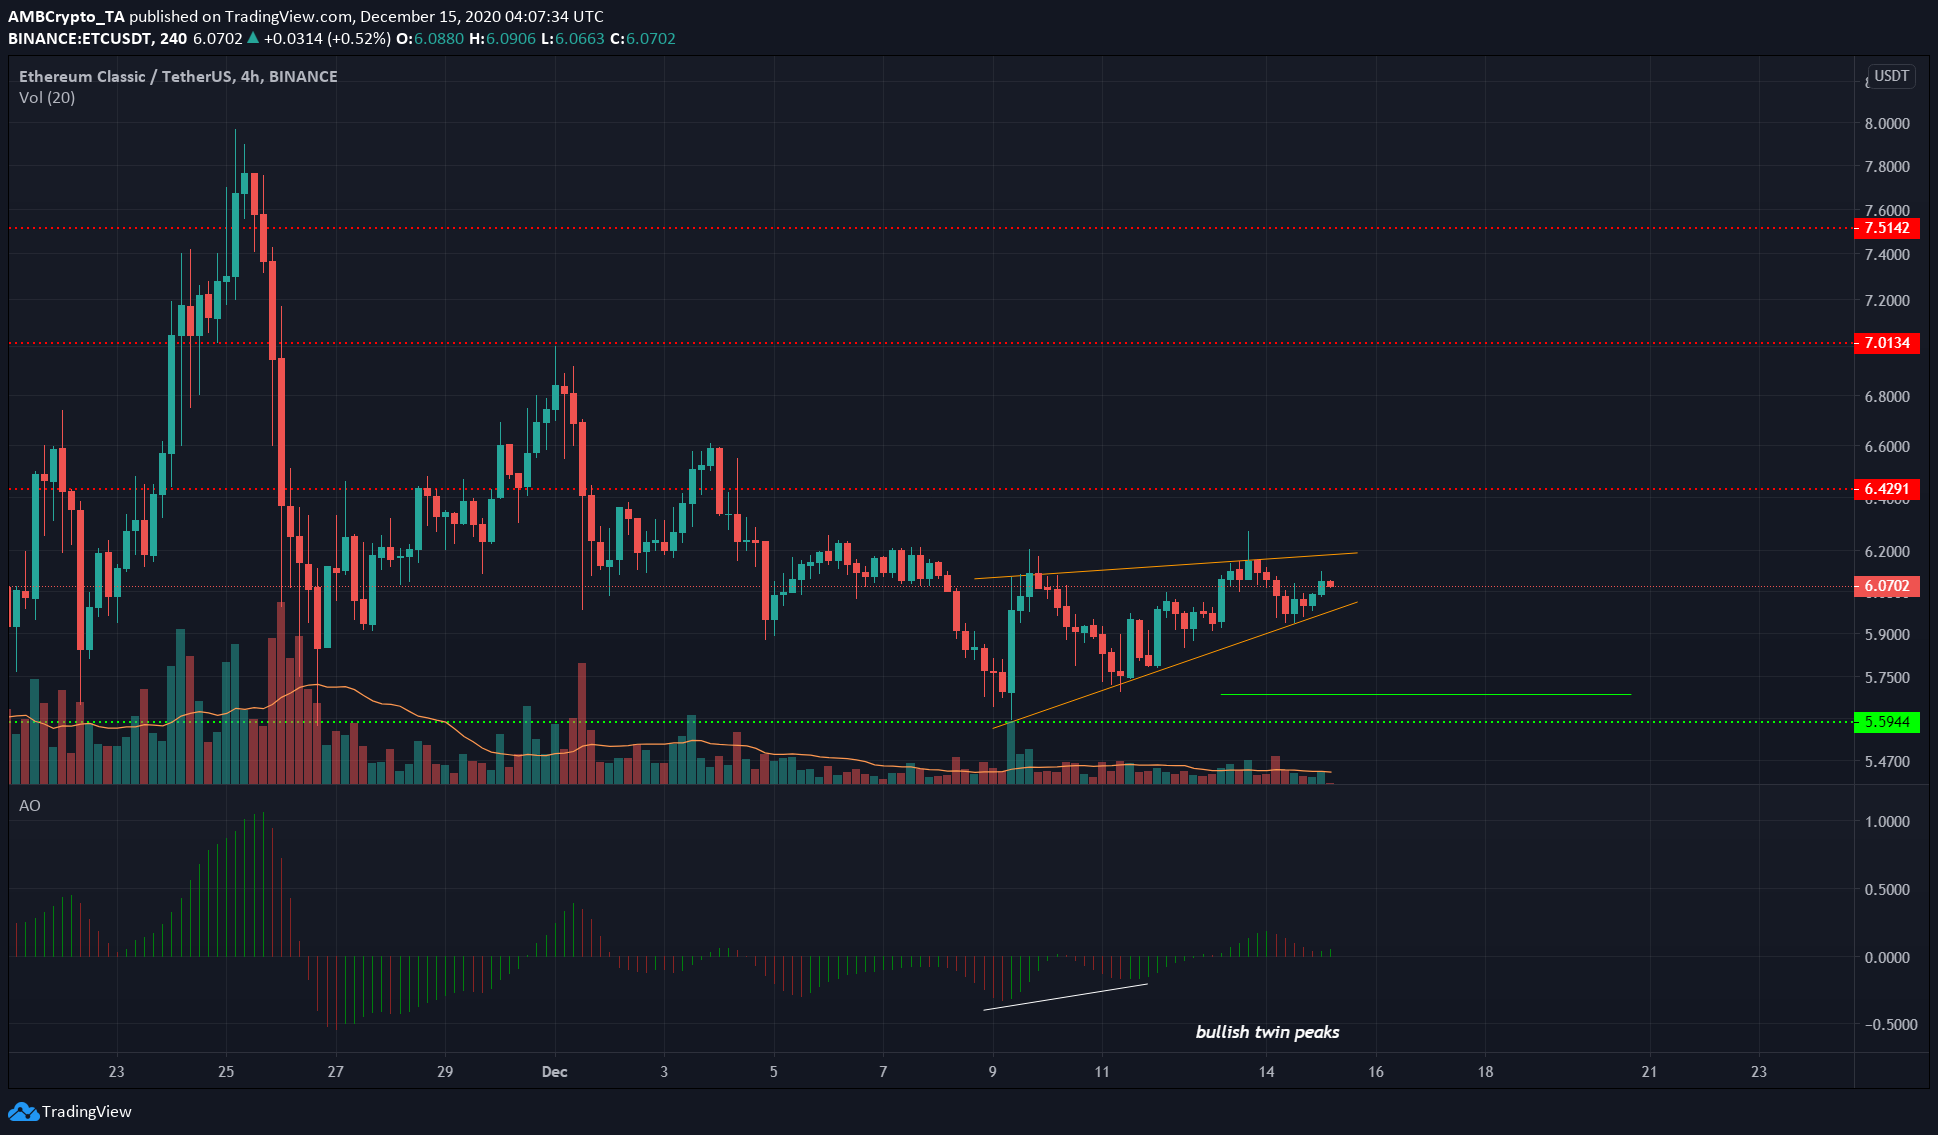
Source: ETC/USDT on TradingView
ETC formed a rising wedge, a bearish reversal pattern, over the past few days. The Awesome Oscillator showed a bullish twin peak set up to indicate short-term bullishness when the price was at $5.85 on the 11th. The price has respected the lower trendline so far.
There was the threat that, if ETC does not climb above $6.2 within a day, that the AO would present a bearish twin peak set up. In combination with the rising wedge pattern, ETC would likely fall toward $5.59 support.
A trading session close above the pattern would invalidate the bearish scenario.