Bitcoin Cash, EOS, Curve Finance Price Analysis: 06 May

Bitcoin fell by 9% the previous day, and across the altcoin market, short-term bullish setups were mercilessly wrecked. Just when coins like Bitcoin Cash and EOS appeared to break past their respective resistance levels, the intense sell-off forced them to suffer a sharp drop in prices. Curve Finance looked ready to shed more value on the charts.
Bitcoin Cash (BCH)
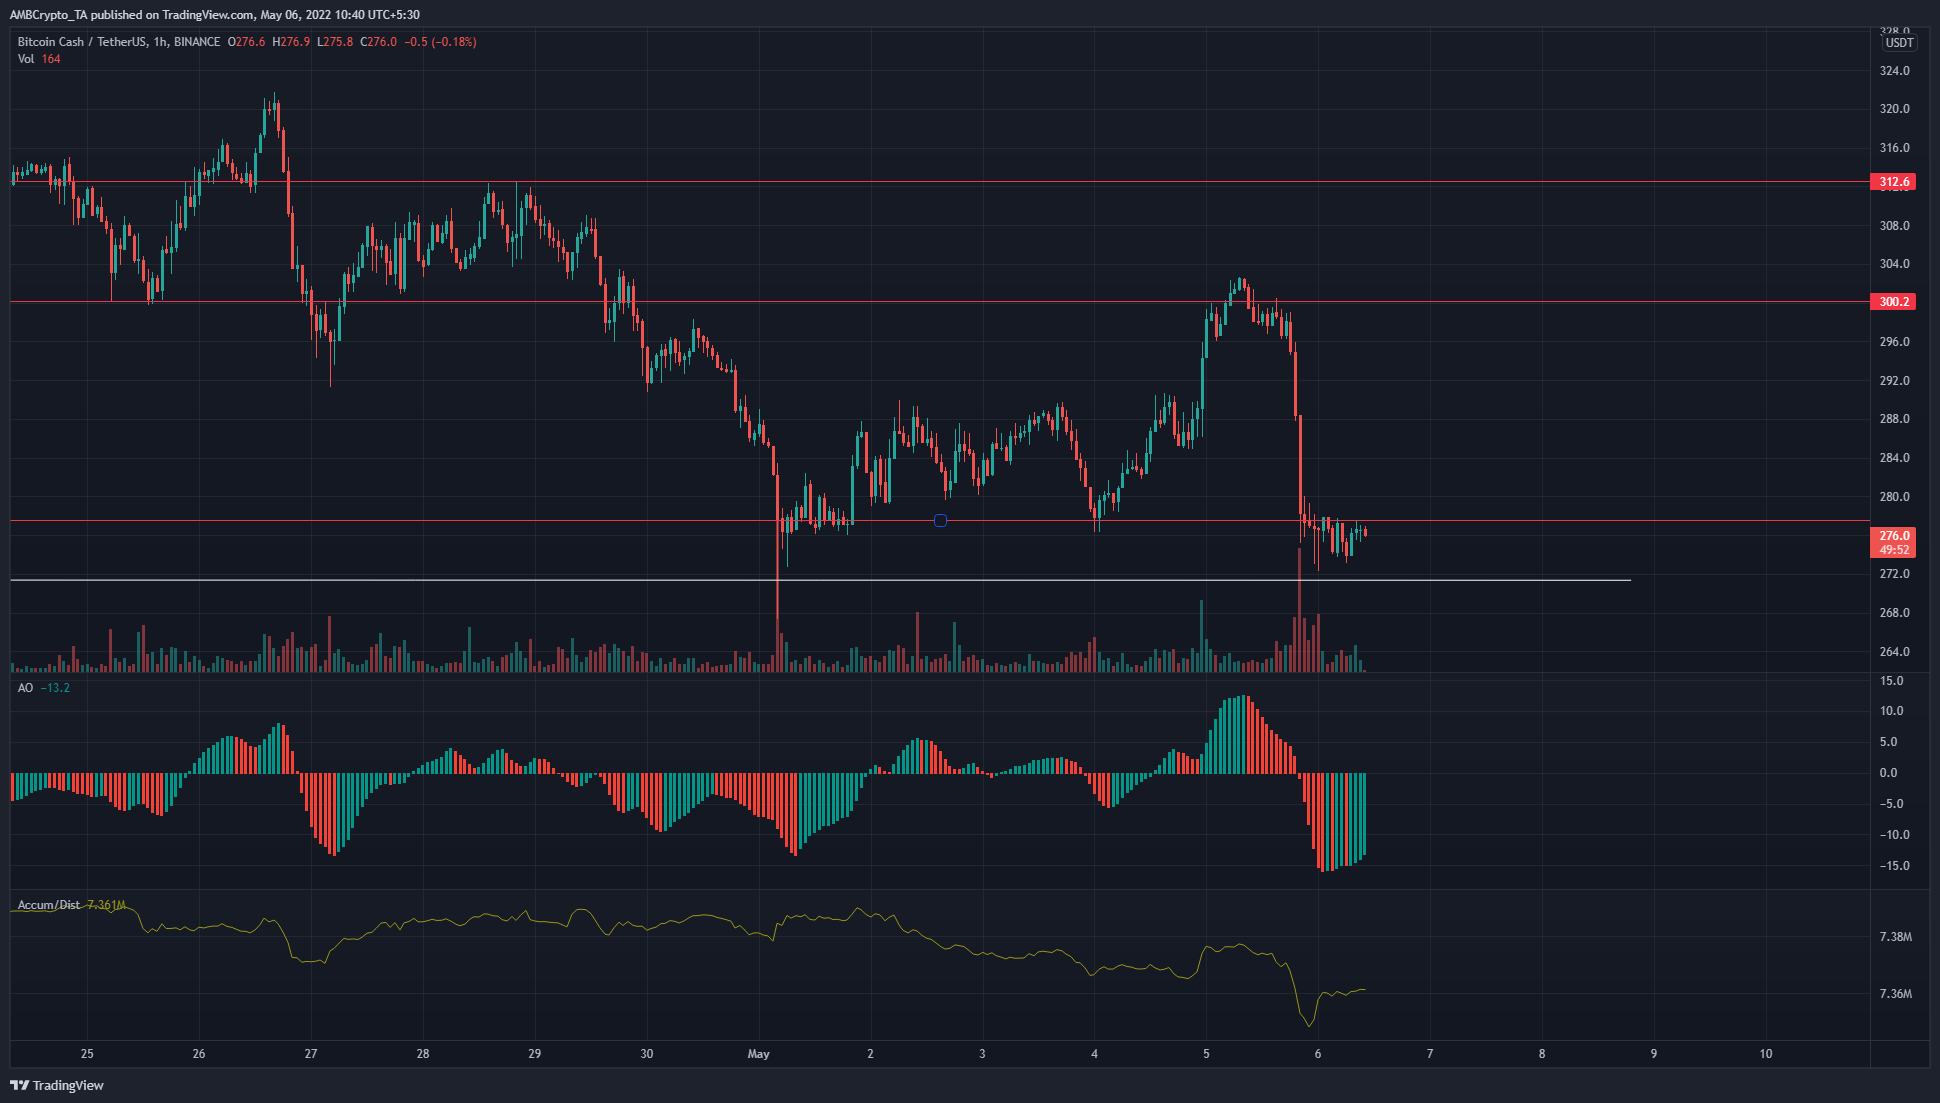
Since early January, Bitcoin Cash has traded within a range from $270 to $392. On lower timeframes, $270 and $300 are the most important levels of support and resistance respectively. $276 has also acted as a level of support in the past two weeks, but at press time, this is a resistance level.
The Awesome Oscillator was well below the zero line to reflect the strong bearish momentum of the past few hours, a fall of nearly 8%. The A/D indicator was also on a downtrend, which showed that despite the move upward to $300, the sellers still have the upper hand.
EOS
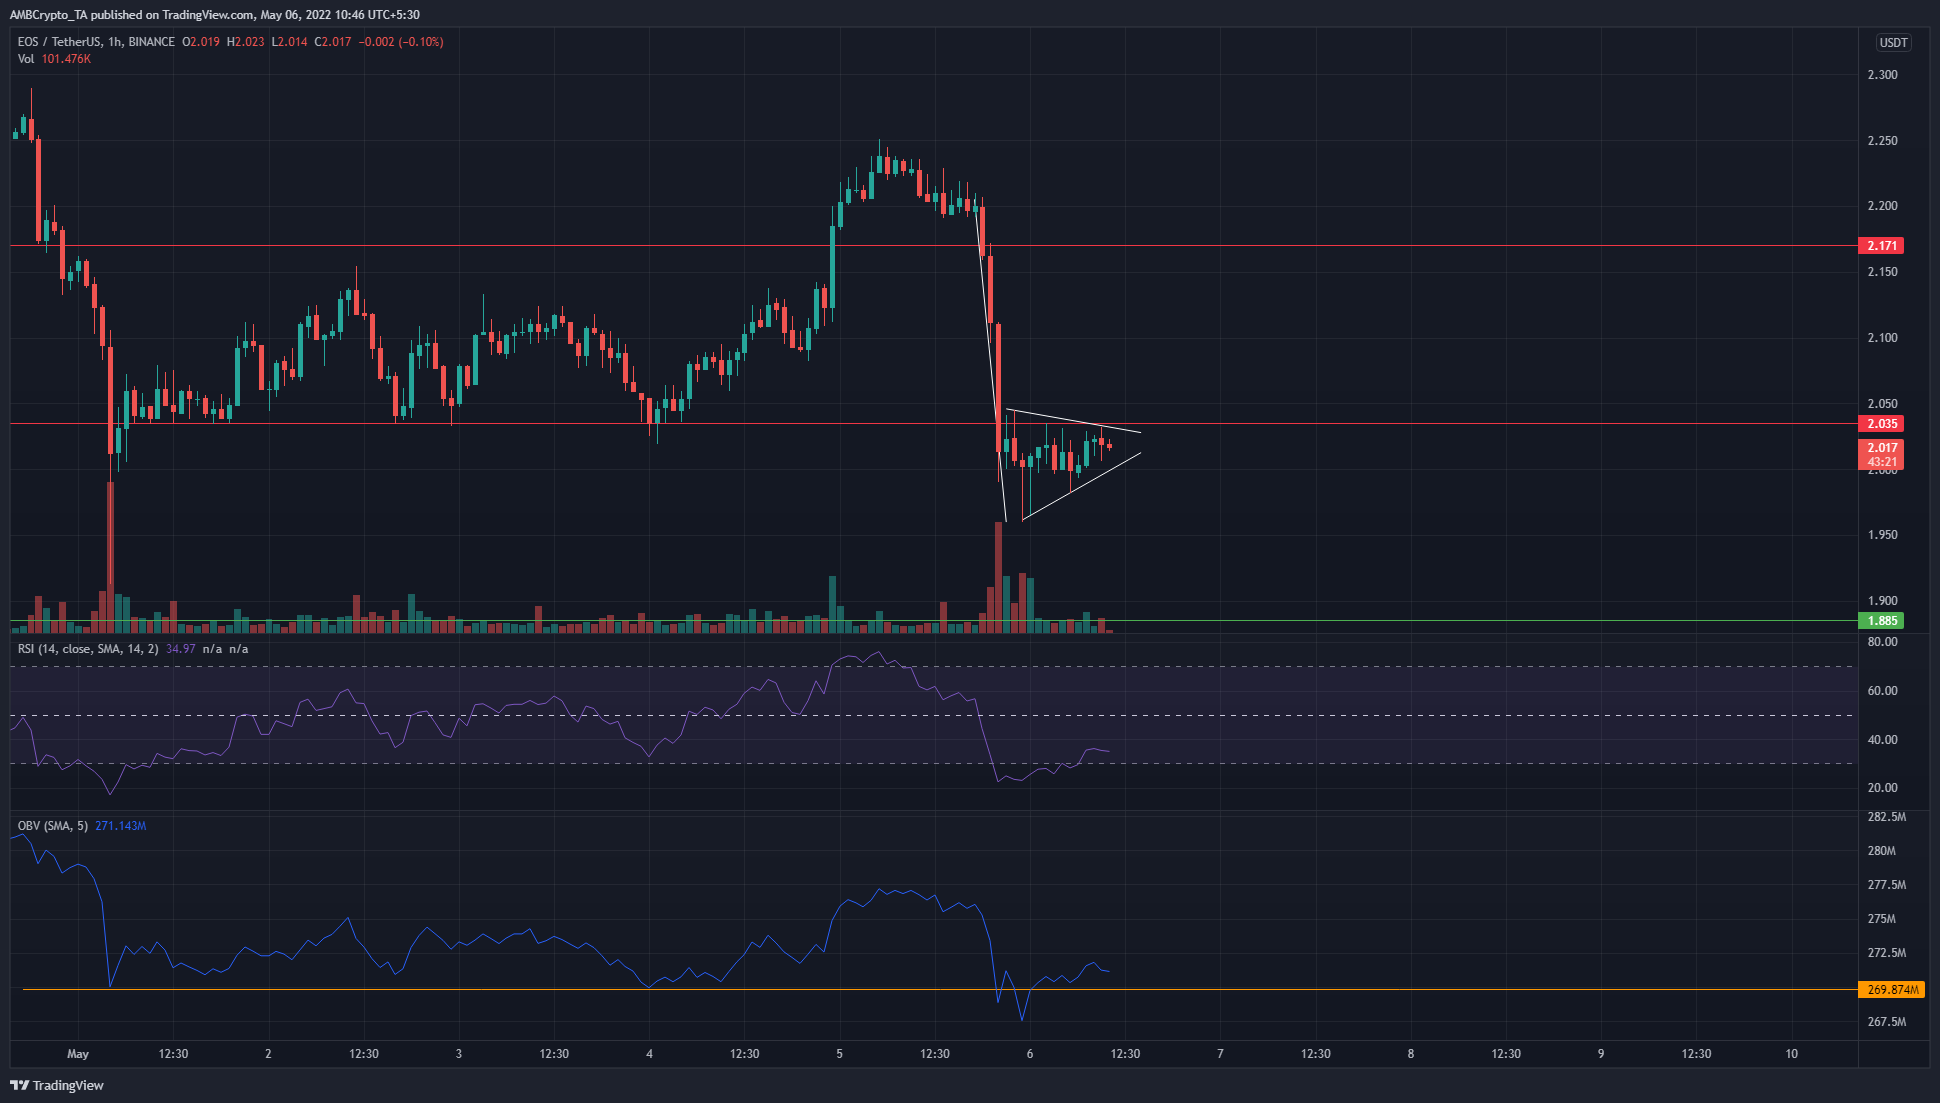
EOS formed a bearish pennant pattern, a chart pattern that is likely to see another drop in prices for EOS. The next level of support lies at $1.88. In the past week, $2 has acted as support but in the past few hours, the price fell decisively beneath this level and $2 is now a level of resistance.
The RSI on the hourly chart has fallen beneath neutral 50. The market structure has flipped to bearish after breaking beneath $2, and the bearish pennant pattern suggested further downside was likely. However, the OBV managed to climb above the past week’s support, but it was unclear whether the buyers can force a recovery.
Curve Finance (CVX)
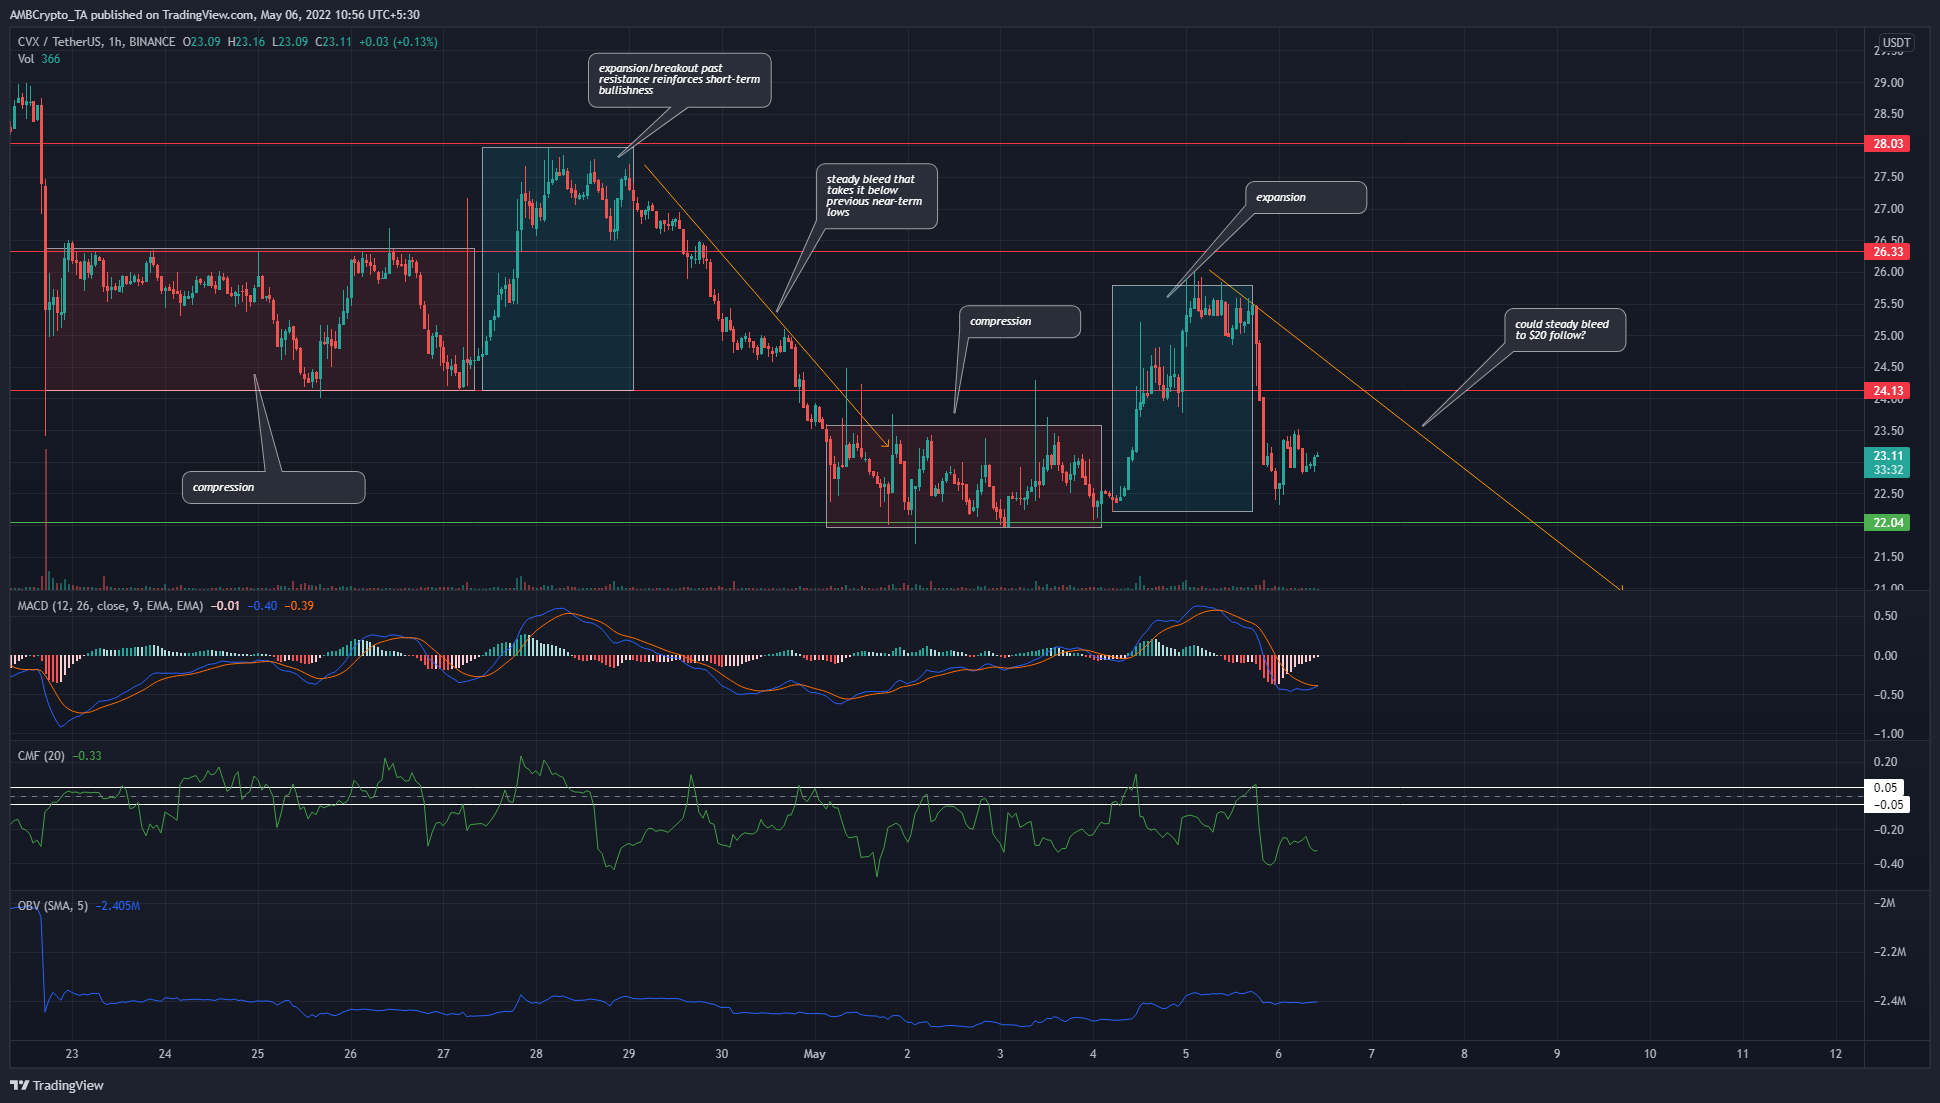
As highlighted on the charts, CVX has seen a period of compression, and upside expansion followed by a steady bleed back beneath former support. This pattern could repeat once more, and push CVX back to $20.
The MACD gave a sell signal, although it could form a bullish crossover in the bearish territory to suggest a slight pullback toward $23.7 before another drop. The CMD has been well below -0.05 for the majority of the past ten days, while the OBV has been relatively flat in the same time period. In fact, it has formed higher lows in the past three days.


