Bitcoin Cash, Ethereum Classic, Polkadot Price Analysis: 09 May

Bitcoin Cash’s movement was within the confines of a descending triangle and a breakdown was still expected considering bearish market momentum. Ethereum Classic could go as low as $45.5 in an extreme sell-off. Lastly, Polkadot maintained its up-channel but a break above $46.5 seemed unlikely.
Bitcoin Cash [BCH]
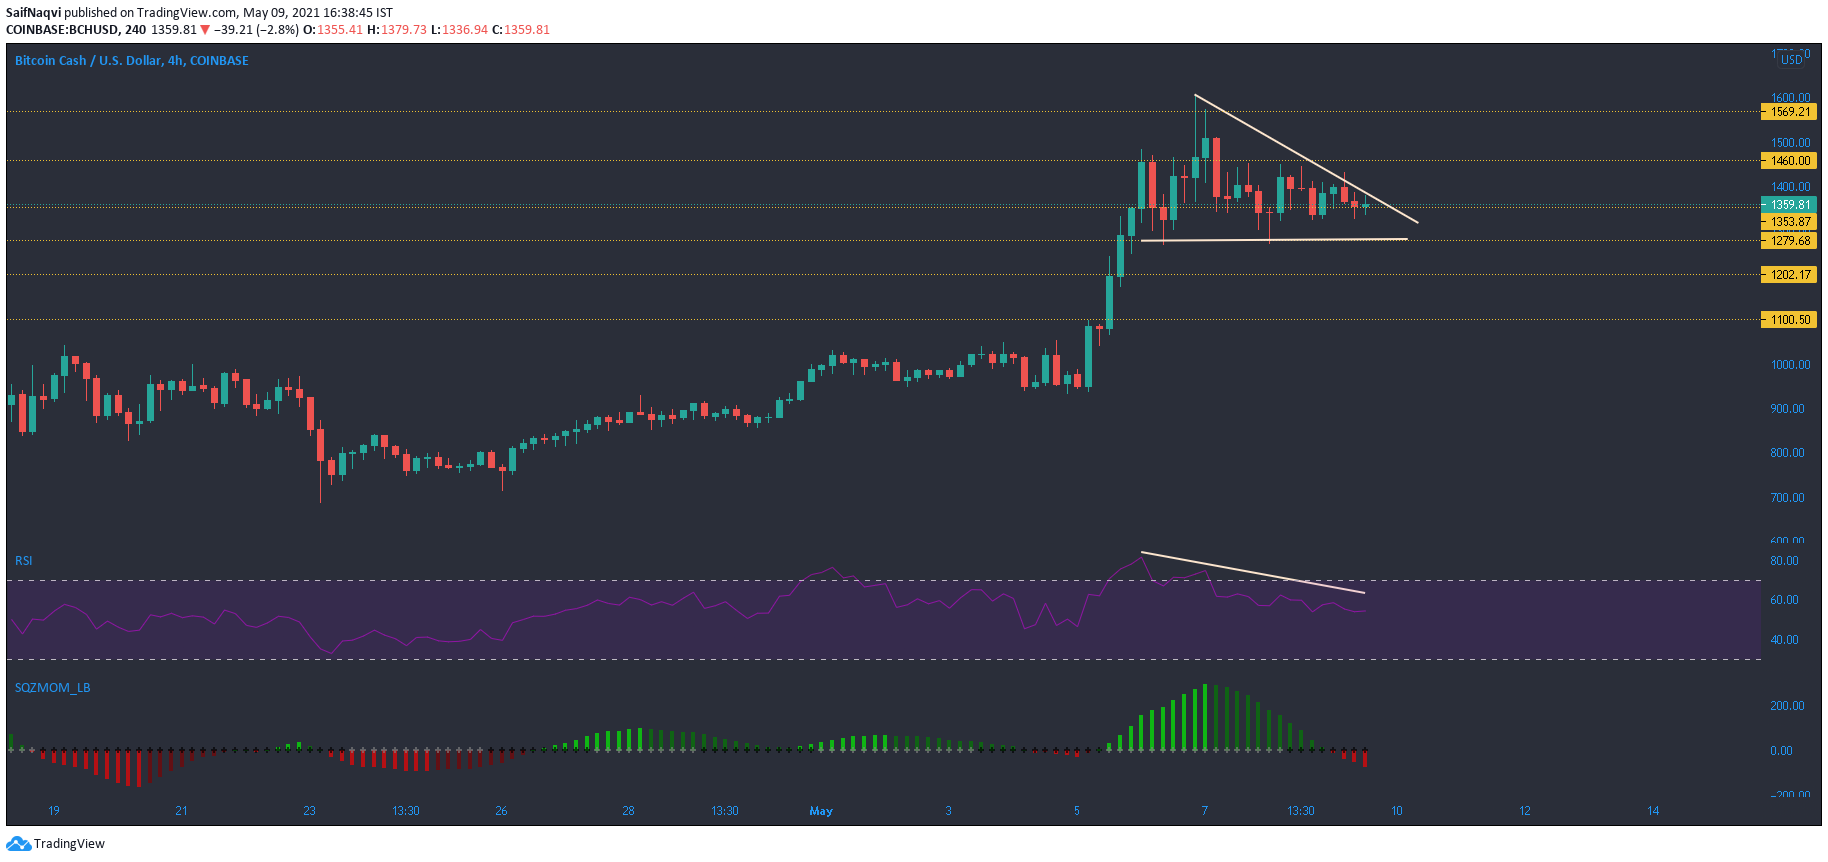
Squeeze Momentum Indicator showed bearish momentum in the market as Bitcoin Cash traded within a descending triangle. The lower trendline at $1,280 represented the cut-off point for the bulls. A breakdown from this pattern could lead to a dip towards $1,200 support. For a breakout, the bulls needed to retake $1,430-$1,460 from the sellers.
RSI has steadily declined over the last couple of days after overbought conditions. A dip below 47-45 would reflect bearish price action.
Ethereum Classic [ETC]

Ethereum Classic traded within the green territory at press time, but its gains were nowhere close to those seen a few days ago. Over the last 24 hours, BCH was up by 3%, but weekly gains stood strong at 160%. This also suggested a correctional period for ETC before it resumed its northbound trajectory. If $111 support is maintained, another hike can be anticipated in the coming days. If that level is breached by the sellers, pullbacks around $90, $70.5 were also possible. An extreme sell-off could go as low as $45.5 and below the 20-SMA (red).
The width of Bollinger Bands indicated high volatility in the market and backed a pullback after the candlesticks traded on the upper band. The RSI made its second peak in the overbought zone and headed south at the time of writing
Polkadot [DOT]
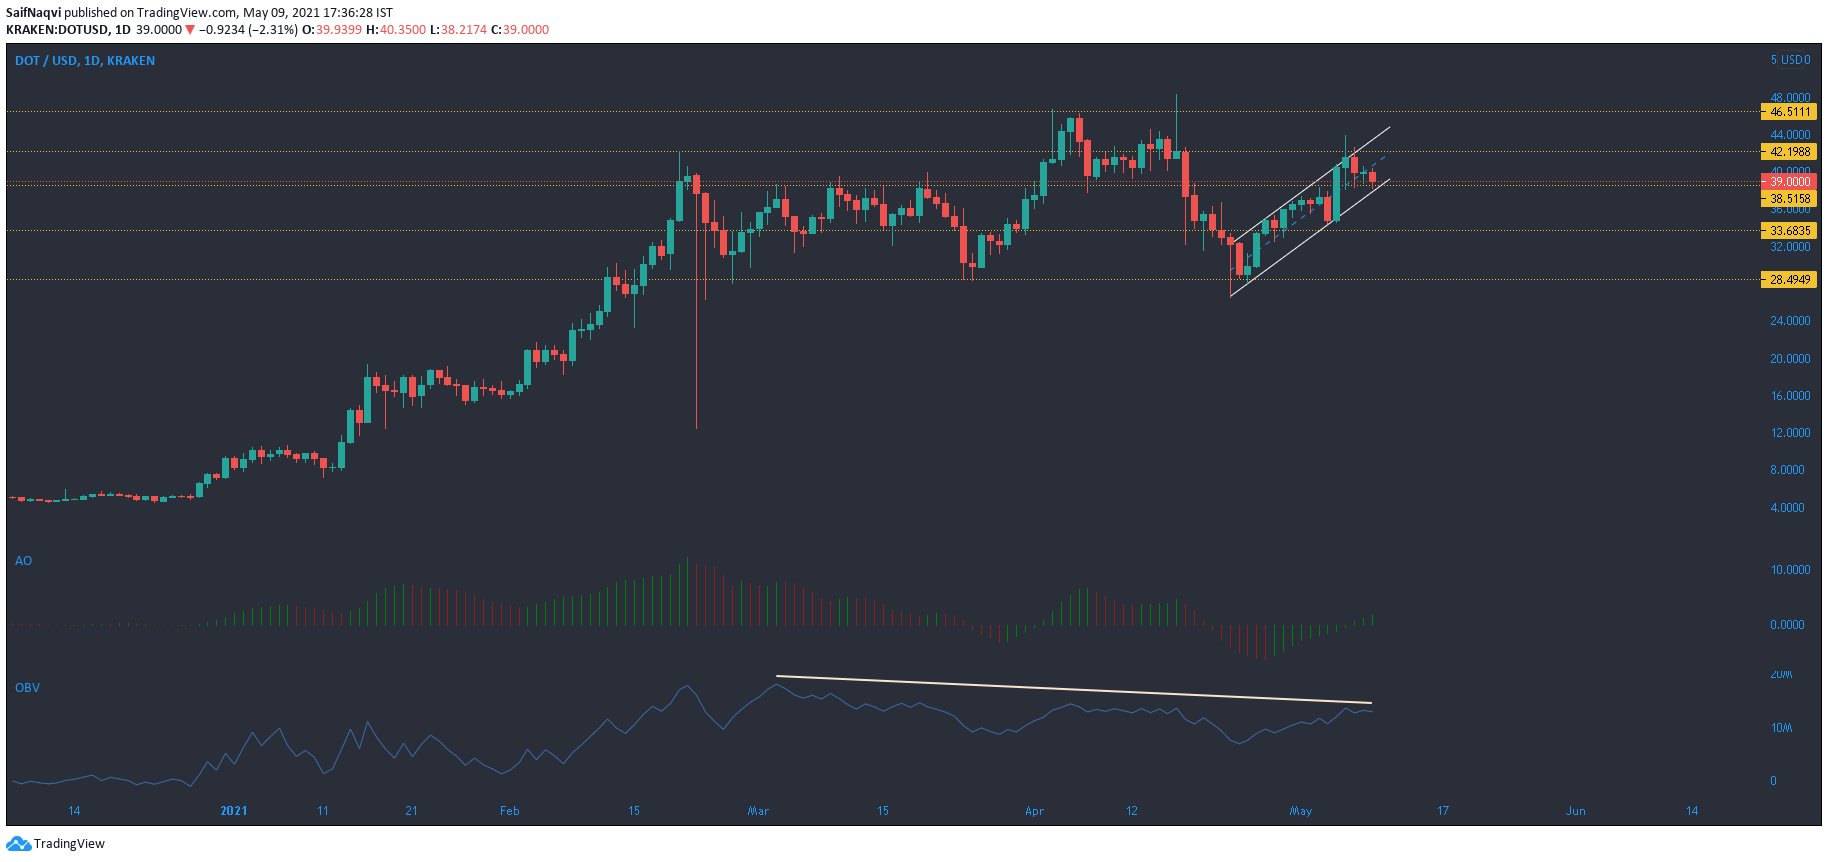
As Polkadot’s up-channel closed in on the $42.2-upper ceiling, bullish momentum was noted in the market. It would be interesting to see if this momentum remained when DOT approaches the next ceiling at $46.5. If buying activity does not slow down prior to a breakout, DOT’s first few targets lay at $53 and $57.
Awesome Oscillator’s green bars showed positive buying pressure as DOT approached $42.2. If this buying dissipates, a pullback can take place between $33-35. OBV’s downtrend showed that buying pressure seen during late-Feb highs has been on a steady decline. This could come into effect and work against a breakout prediction. If OBV does manage to rise above its upper sloping trendline, a favorable outcome can be expected.


