Bitcoin Cash: How these contrasting indications could play out for BCH

Post an up-channel (yellow) oscillation for over three months, it has more or less been a bear show in the Bitcoin Cash [BCH] market. An expected up-channel breakdown on 30 April set BCH in a bearish motion for nearly a month now.
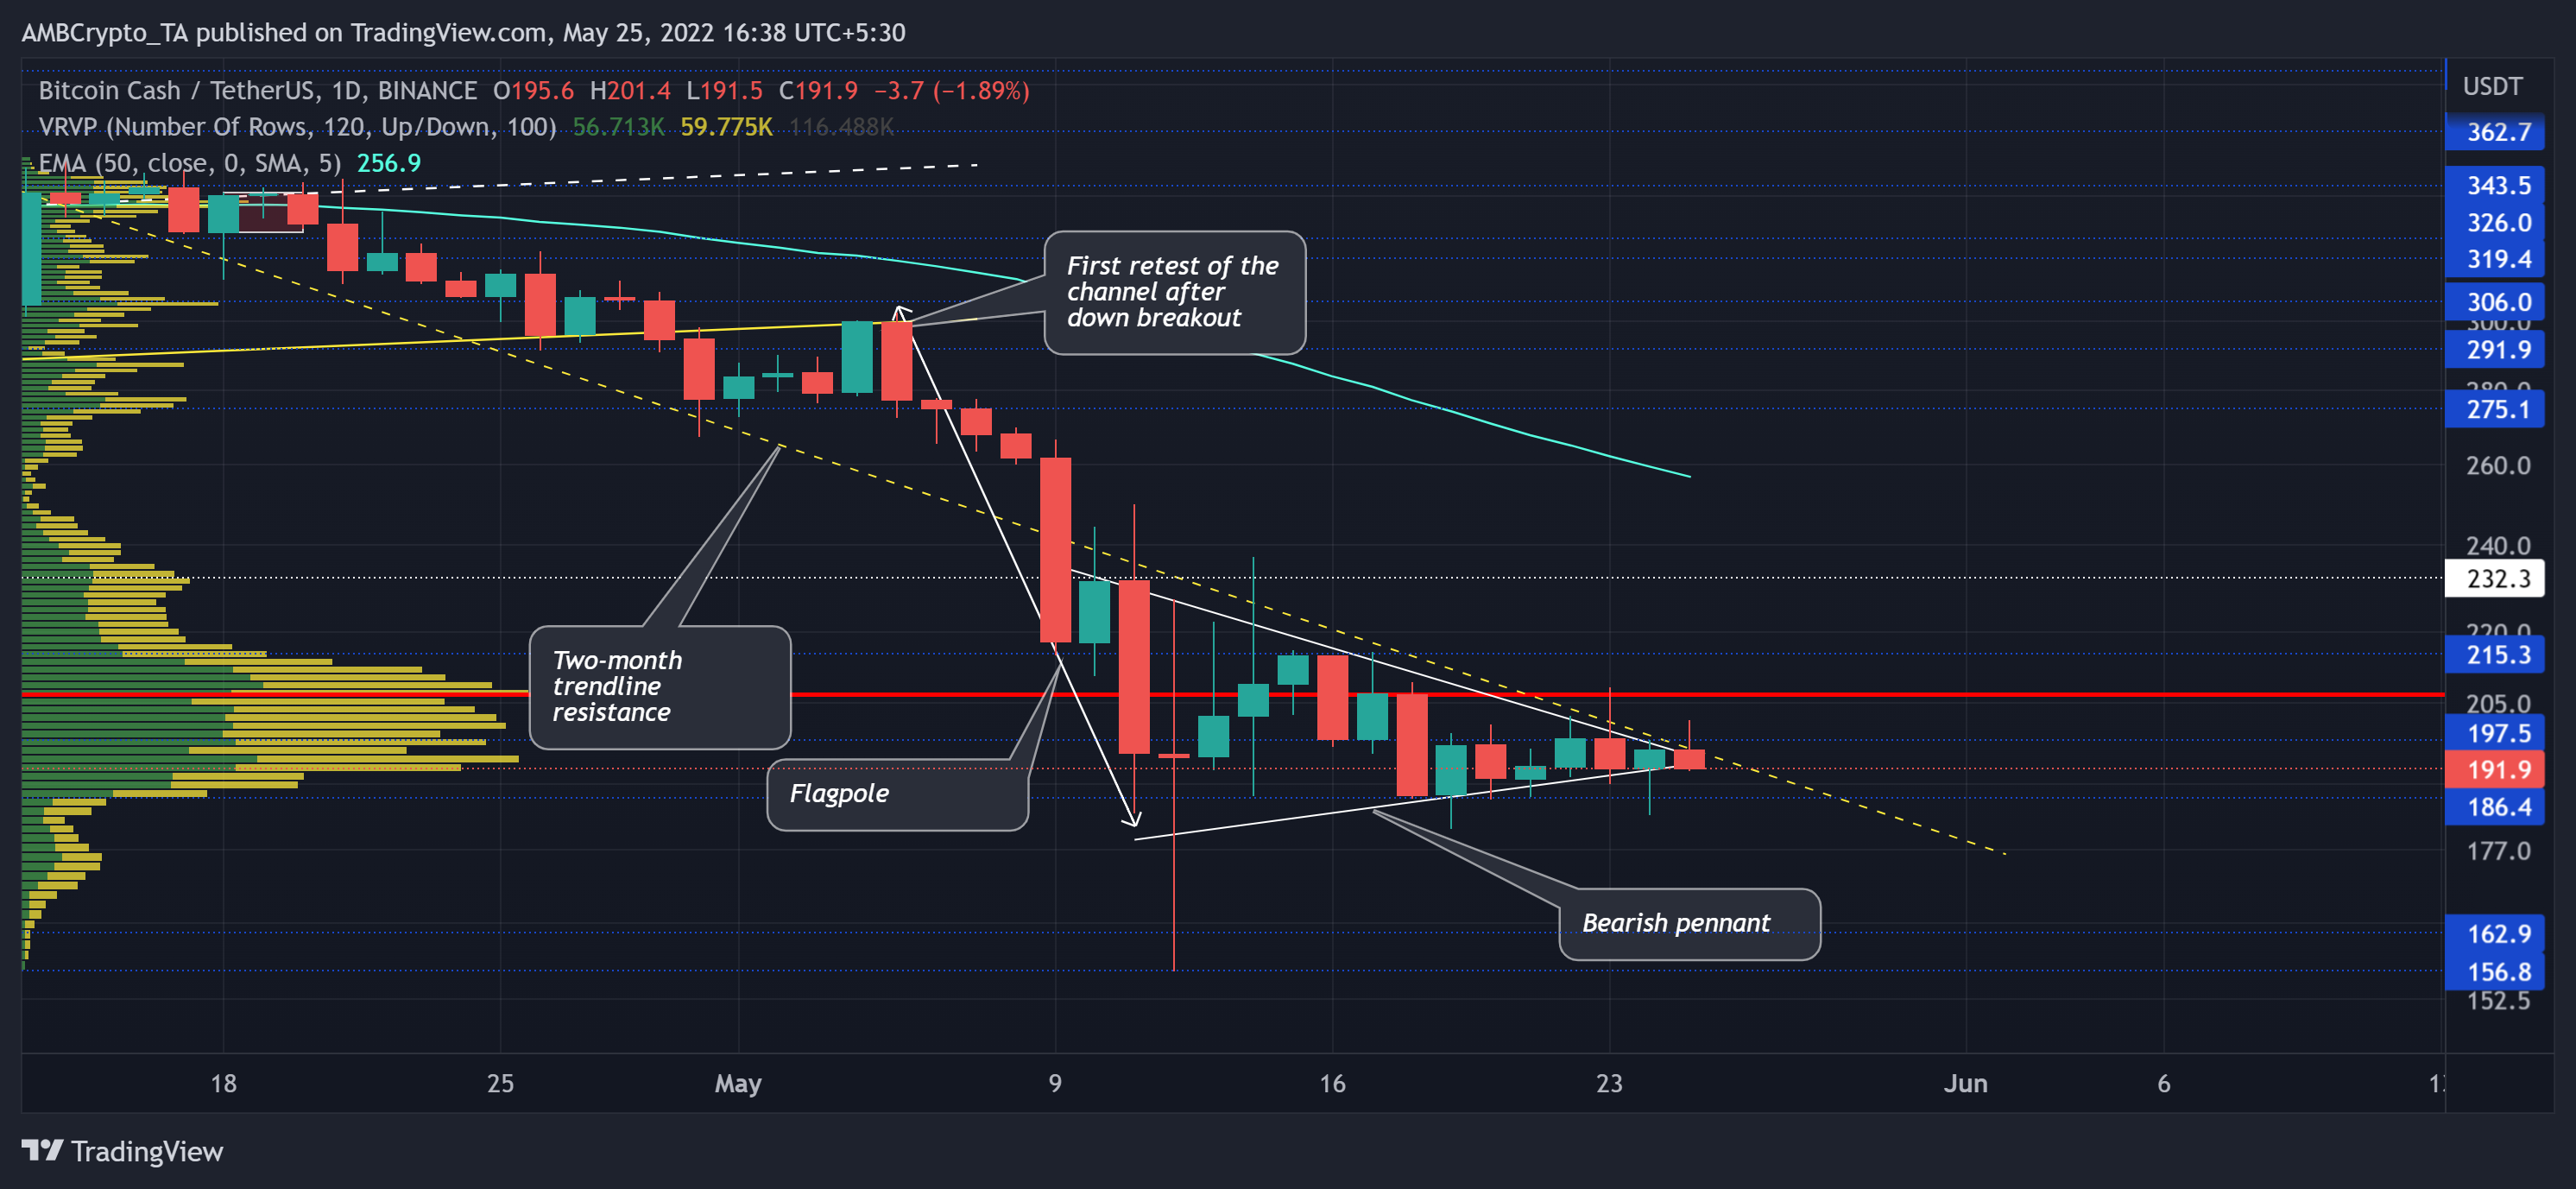
While the altcoin hovered near its Point of Control (POC, red), it stood at a juncture that primarily marked two hurdles.
Essentially, the upper trendline of the bearish pennant coincided with the two-month trendline resistance to pose a stiff barrier. Any close below the $186-zone could lead to further losses. At press time, BCH was trading at $191.9.
BCH Daily Chart
Owing to its high correlation with Bitcoin, it has been relatively easy for BCH bears to find renewed selling pressure. A correction from the $719-zone in November last year identified the reversal of its long-term bull cycle.
Since then, the coin has been on a steady slump. On its way down, the $275-level offered strong selling resistance. But the broader liquidations pulled BCH down to its 26-month low on 12 May.
In the last two weeks, BCH has been entering into a tighter phase within the bounds of its bearish pennant. Also, with the volumes still in a decline phase, the near-term chances of bullish comeback endeavors seemed pretty weak.
But on the flip side, the price had overextended its gap with the 50 EMA (cyan). For over 11 months, the price has shown its tendency to bounce back after extending by over 25% below the 50 EMA. Also, the buyers are keen to reject any lower prices at the two-year support at $186.4. So, any close below the 186-level could confirm strong down breakout chances.
Rationale

Over the last ten days, the bearish RSI witnessed higher peaks in its efforts to jump above the oversold region. Meanwhile, it formed a bearish divergence with the price. Thus, it also saw a rising wedge breakdown as it aimed to test the 33-mark.
With the MACD lines undertaking a bullish crossover after nearly two months, the selling pressure eased. The buyers still needed to bridge the gap between MACD lines and the zero-mark to claim an edge.
Conclusion
The altcoin flashed mixed signals in the current structure. The formation of a bearish pennant that is approaching the two-month trendline resistance makes an excellent bearish case. A close below the $186-level would confirm this narrative.
But with an overextended gap between the price and the 50 EMA, buyers should ideally step in to prevent a significant fallout.
Moreover, BCH shares a 98% 30-day correlation with the king coin. Thus, keeping a watch on Bitcoin’s movement would be vital in making an accurate decision.


