Bitcoin Cash, Status, Polkadot Price Analysis: 04 January

Bitcoin Cash and Polkadot were extremely bullish on the charts as they climbed past levels of resistance with ease. Bitcoin Cash surged on the back of Bitcoin and Ethereum’s performances and it looked likely to rise past the $460-level. Polkadot doubled in value over the past week and could climb as high as $11.5 in the coming days.
Finally, Status faced resistance at $0.042 after recording gains of nearly 30% in the hours before press time.
Bitcoin Cash [BCH]
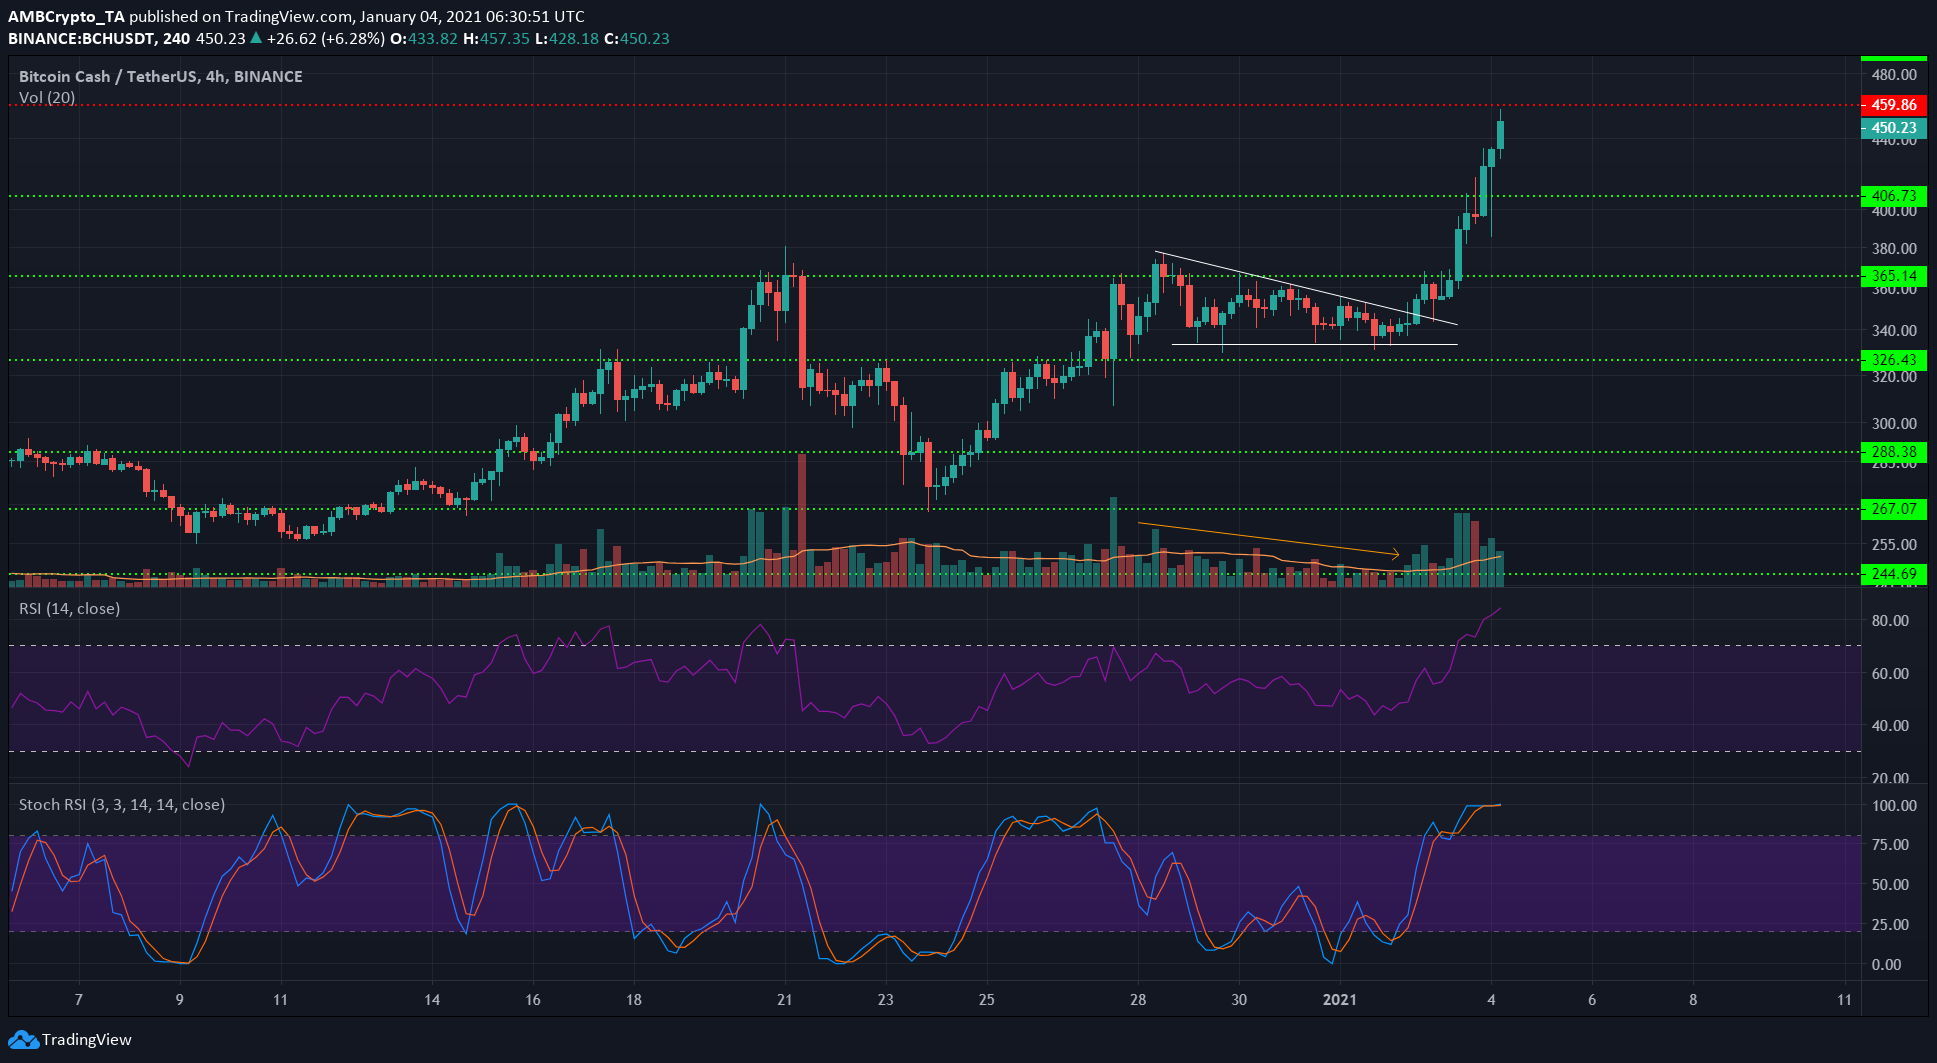
Bitcoin Cash was influenced far more by a bullish Ether, than a bullish Bitcoin. The past 24 hours saw BCH surge from just below the $365-level to trade at $450, at the time of writing, with a level of resistance at $459.
The Stochastic RSI and the RSI indicators pointed towards an overbought market, but they did not necessitate a pullback. The bullish momentum could see BCH rise further, before consolidating around the $460-region.
Above $460, $500 looked like a level that can be expected to act as resistance. Below $460, $440 can also serve as support.
Status [SNT]
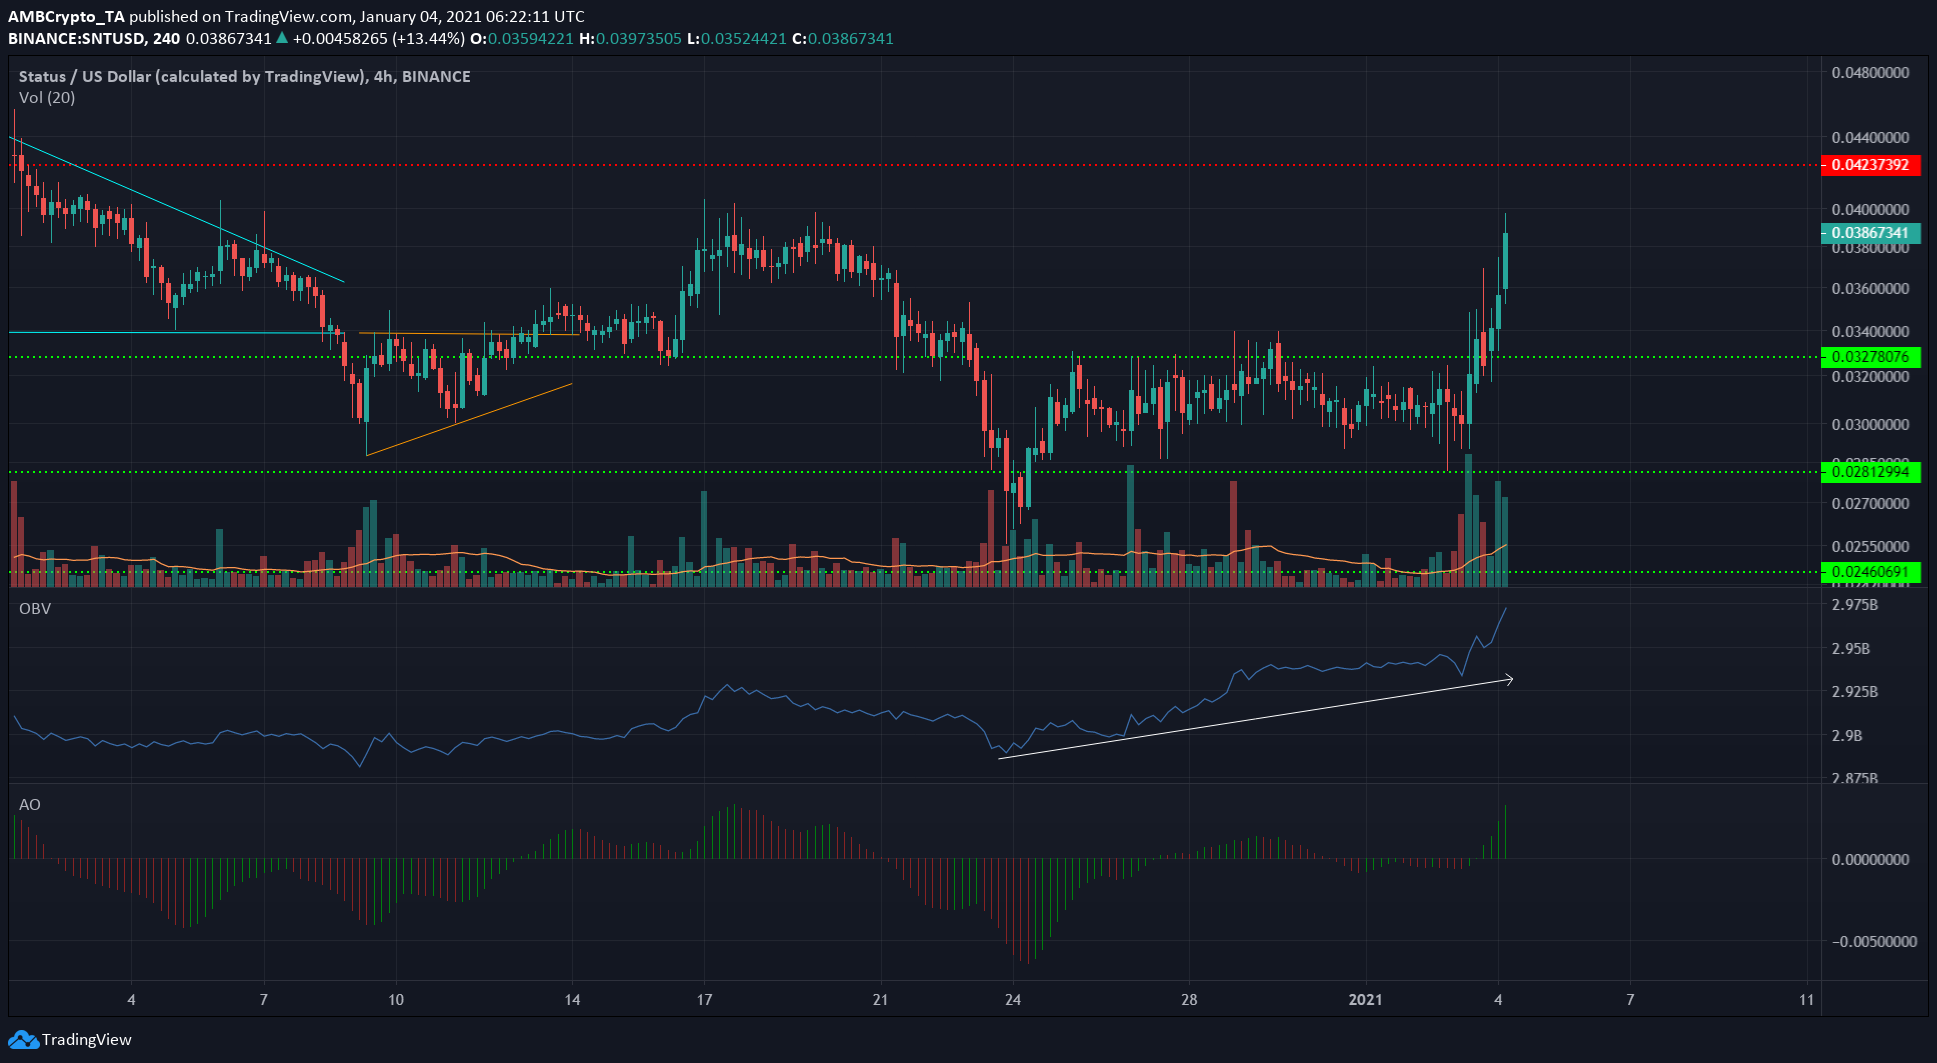
The cryptocurrency’s price rose past the $0.032-level over the past few hours. The $0.036-region did nothing to halt the ascent, although it has acted as support in the past. SNT was trading at $0.039. at the time of writing.
The OBV noted steady buying volume over the past week, while the Awesome Oscillator crossed strongly over into bullish territory.
This upside momentum could see SNT test the resistance at $0.042, while likely flipping it to support.
Polkadot [DOT]
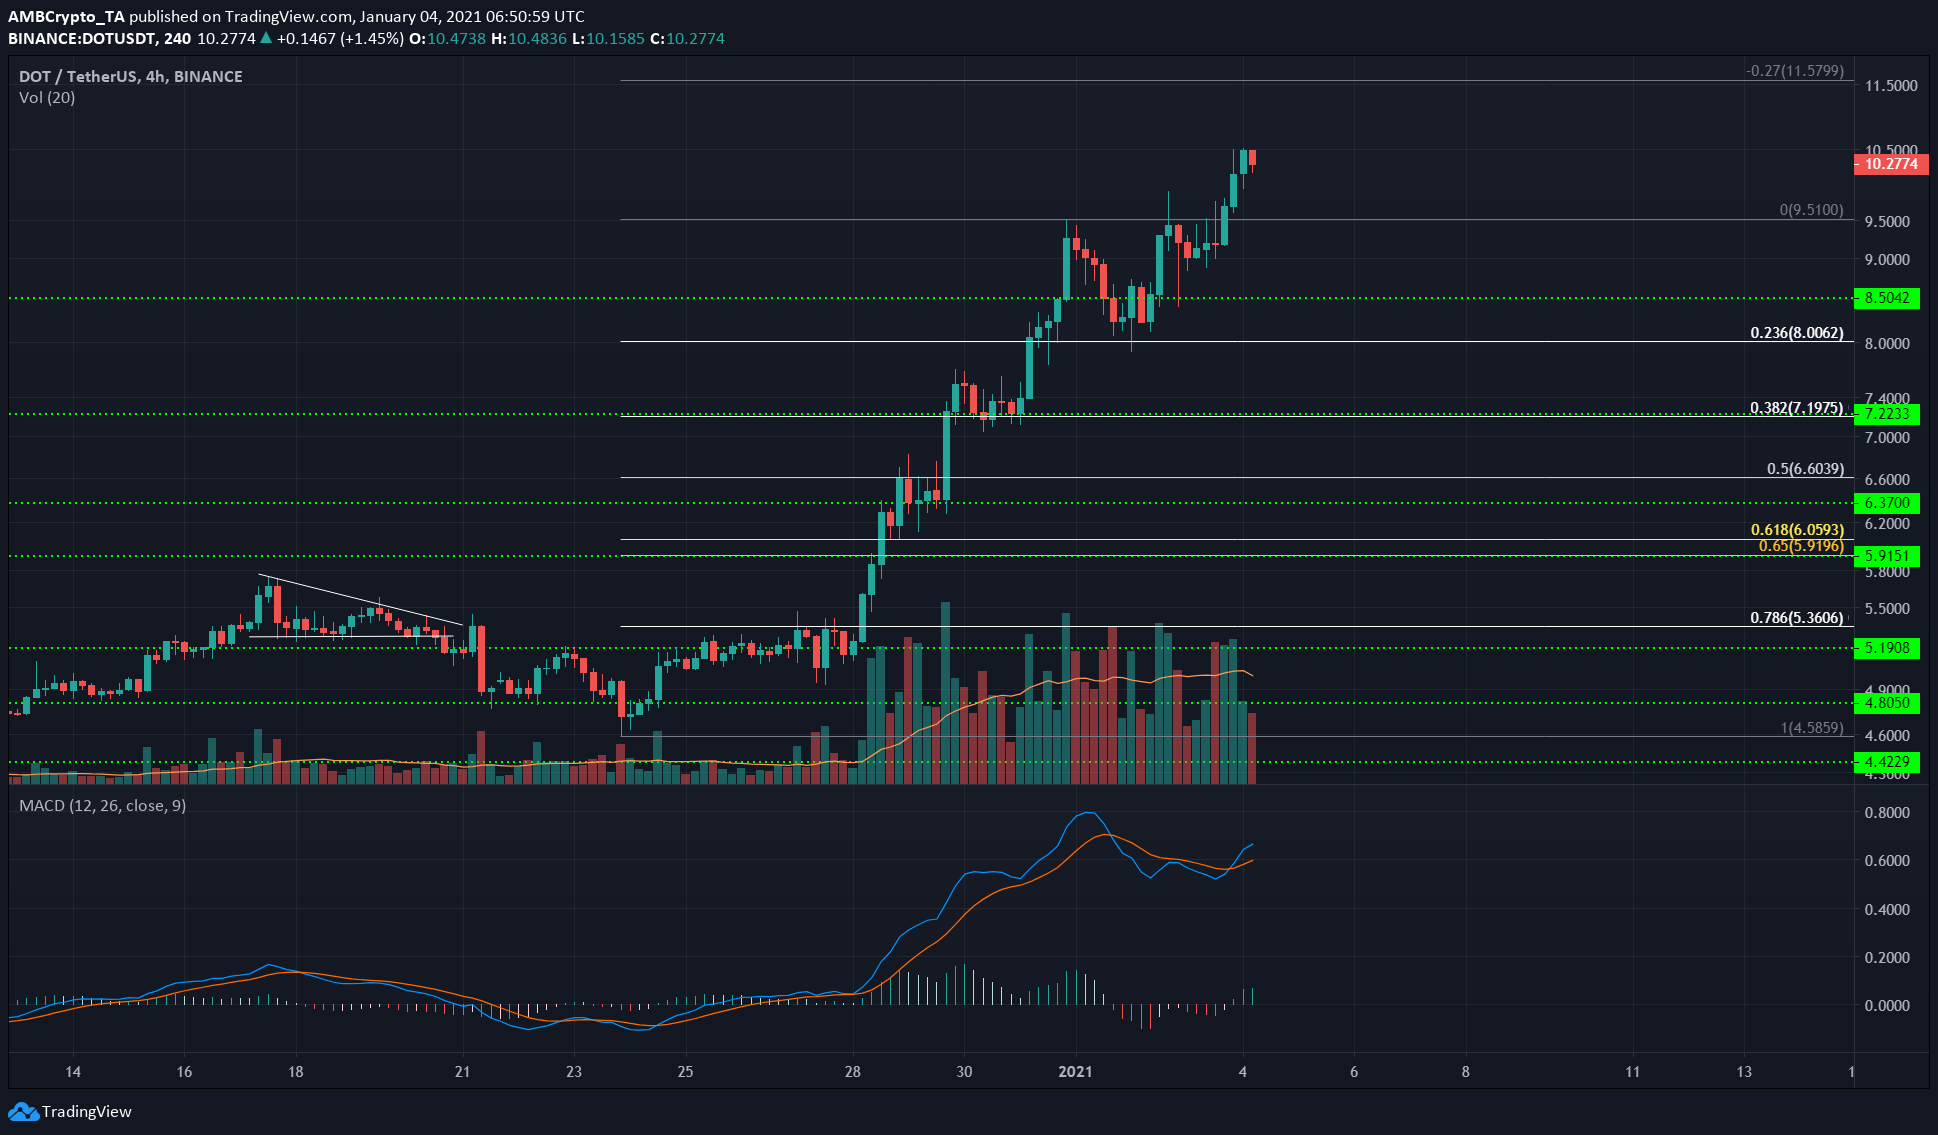
The break past $9.5 projected a target of $11.5 for DOT, using the 27% Fibonacci extension for DOT’s move from $4.58 to $9.51.
The MACD indicated strong bullish momentum for DOT and, after the psychological $10-level has been claimed by the bulls as a support, the $11.5-region was likely to be tested in the coming days.
The surge over the past few days can see DOT correct itself. However, the said correction would be based on Ether and Bitcoin’s movement and not just DOT’s.


