Bitcoin Cash, Tron, Terra Price Analysis: 03 December

As the broader market entered into a possible recovery phase, Tron saw gains on its daily chart after bouncing from its two-month support level.
Moreover, Terra’s LUNA saw 56.4% weekly ROI while it entered into price discovery and found its ATH on 3 December. On the flip side, Bitcoin Cash flashed bearish near-term technical indications.
Bitcoin Cash (BCH)
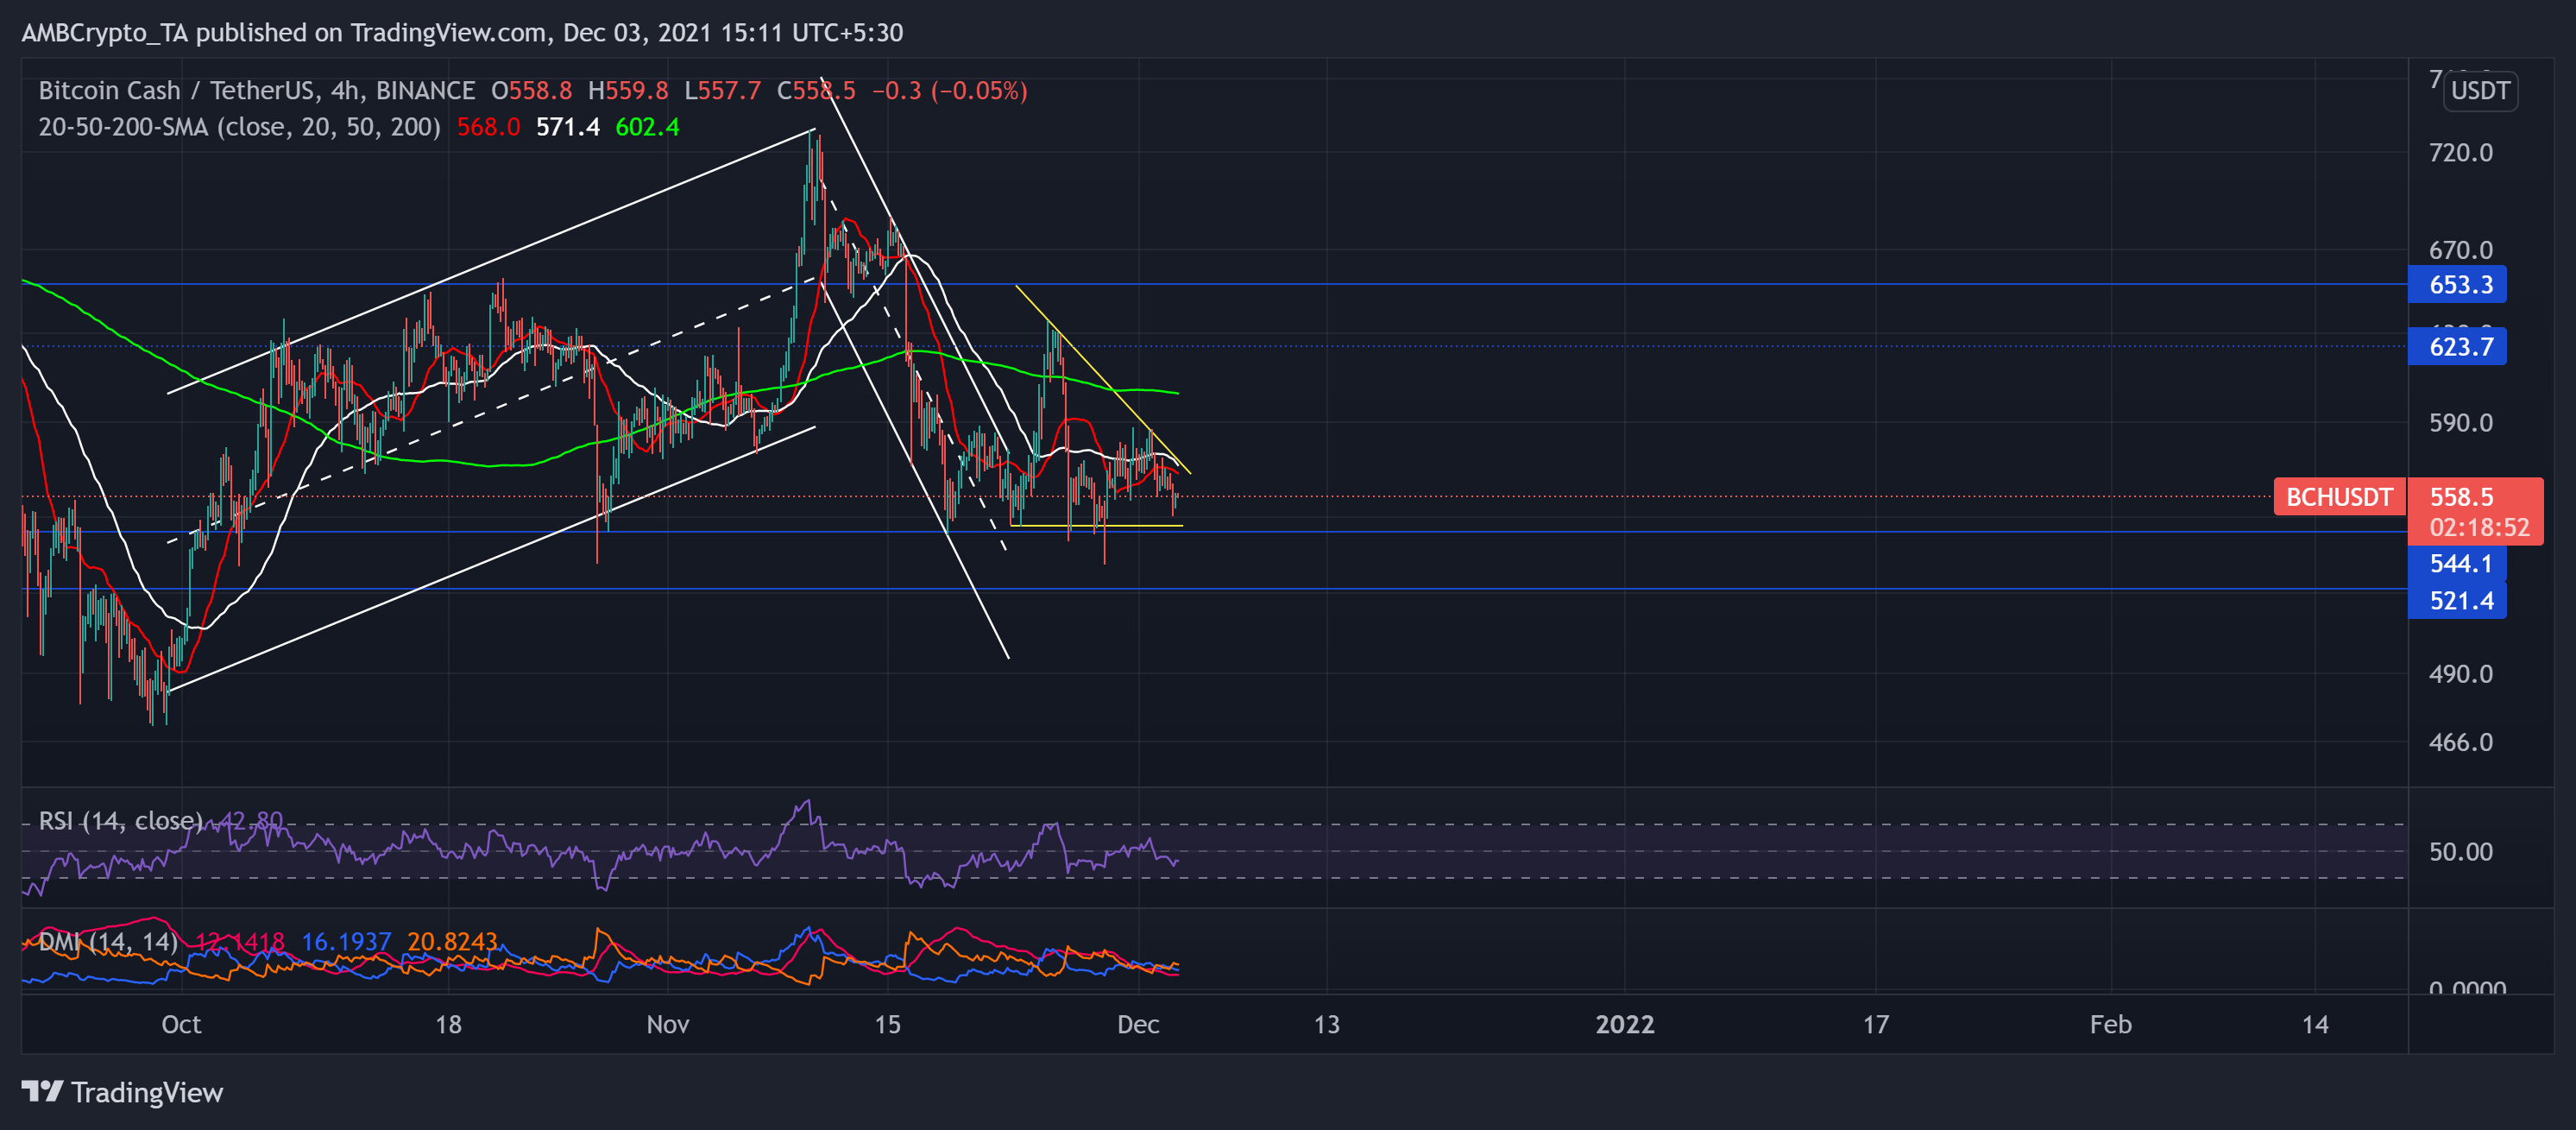
After a down-channel breakout on 22 November, BCH continued to move in the descending triangle pattern (yellow) in its 4-hour chart for the past ten days. This downtrend occurred post the altcoin touched its nine-week high on 10 November.
With this milestone, bulls breached the 12-week long resistance at the $653-mark but could not sustain those levels. As a result, bears initiated a 27.2% retracement as BCH hit its one-month low on 28 November. For the past two months, bears have been retesting the support at the $544-mark.
At press time, BCH traded below its 20-50-200 SMA at $558.5. The RSI preferred the sellers after diminishing for the last three days. Further, the DMI confirmed the bearish vigor, but the ADX displayed a substantially weak directional trend.
Tron (TRX)
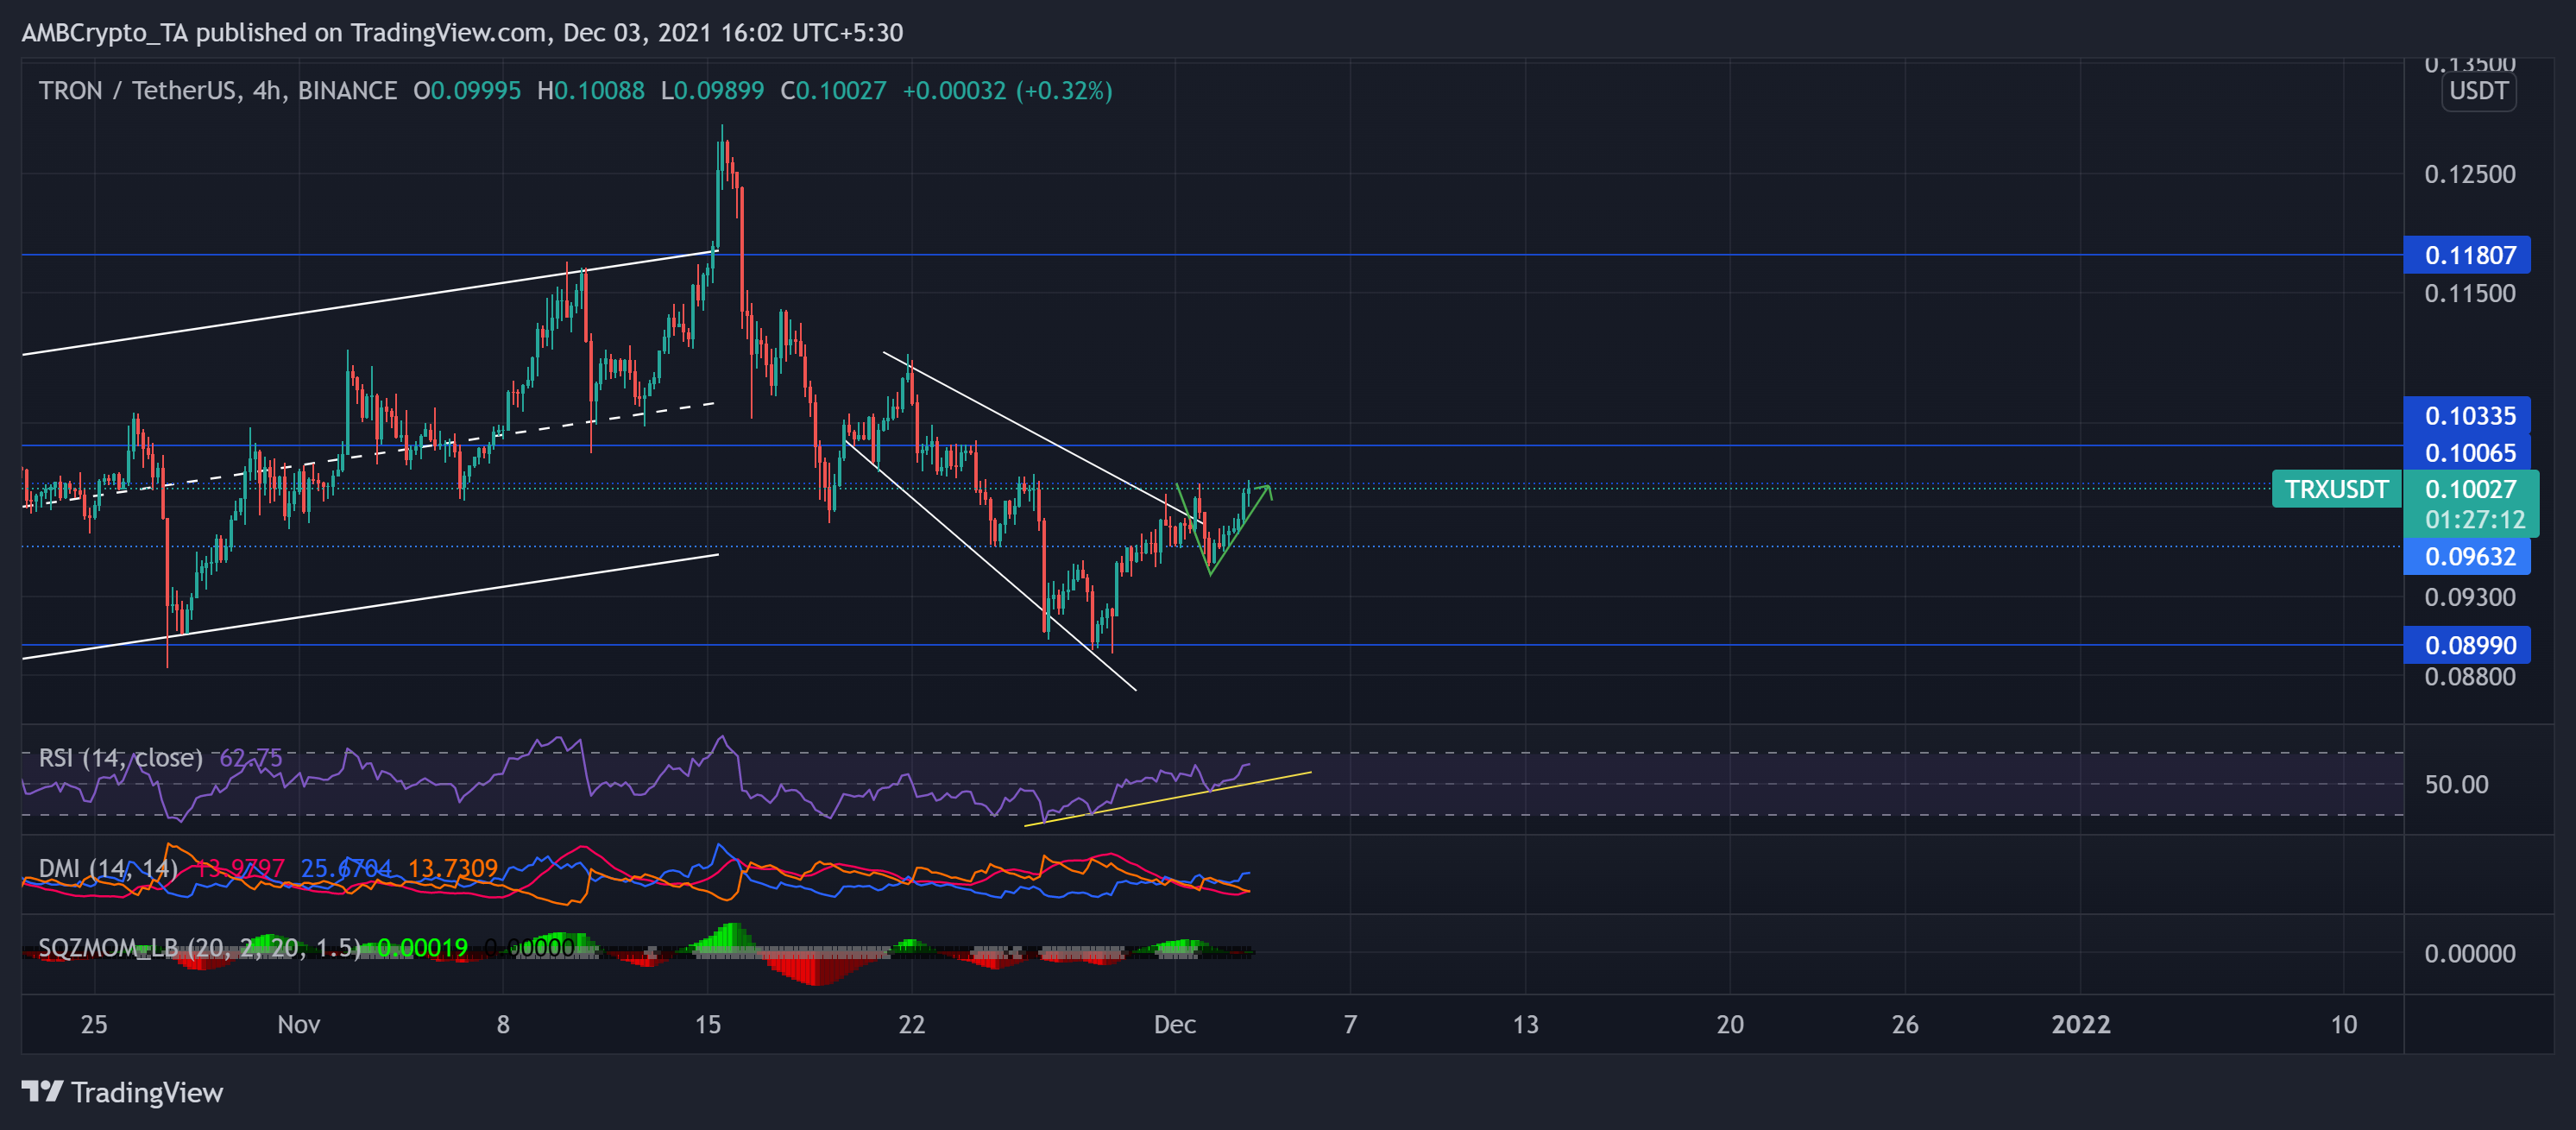
After attaining its six-month high milestone on 15 November, TRX broke out of a descending broadening wedge on its 4-hour chart.
Following a 54% incline from 29 September to 15 November, the price action steadily declined as the bears showed resistance at the $0.118-mark for the past six months. Consequently, TRX lost over a third of its value in the retracement phase to poke its one-month low on 28 November.
Now, the bulls retested the $1.0065-mark twice over the past three days. If the bulls sustain their influence and keep the price above the aforementioned mark, a further breakout could occur.
At press time, TRX traded at $0.10027 after noting a 4% gain in 24 hours. The RSI was in an uptrend while it swayed near the 62-mark after 17 days. Moreover, the DMI confirmed RSI’s hint by preferring the buyers. However, the ADX continued to display an overly weak directional trend.
Terra (LUNA)

LUNA registered an exceptional gain of over 80% from 26 November to 3 December. During the previous downtrend, LUNA lost over one-third of its value. Afterwhich, it touched its five-week low on 24 November.
However, after a strong upturn, the price action broke out from the descending channel and entered into price discovery until it touched its ATH on 3 December. The altcoin breached the $53.3-mark (all-time high support) after the bulls undeniably turned the tide in their favor.
Accordingly, the altcoin saw a 9.5% incline in 24 hours. At press time, LUNA traded at $67.85. The RSI moved near the overbought region for three days, hinting at a substantial bullish vigor. Nevertheless, AO and MACD depicted a slight decrease in bullish strength.