Bitcoin Cash, VeChain, MANA Price Analysis: 11 November

In the last 24 hours, the crypto market witnessed a minor withdrawal after the bull run as prices approached the retracement phase. Thus, the price trajectories of Bitcoin Cash, VeChain, and Decentraland’s MANA saw a 24-hour decline.
Additionally, near-term technicals for all the aforestated altcoins visibly showed decreasing buying power.
Bitcoin Cash (BCH)
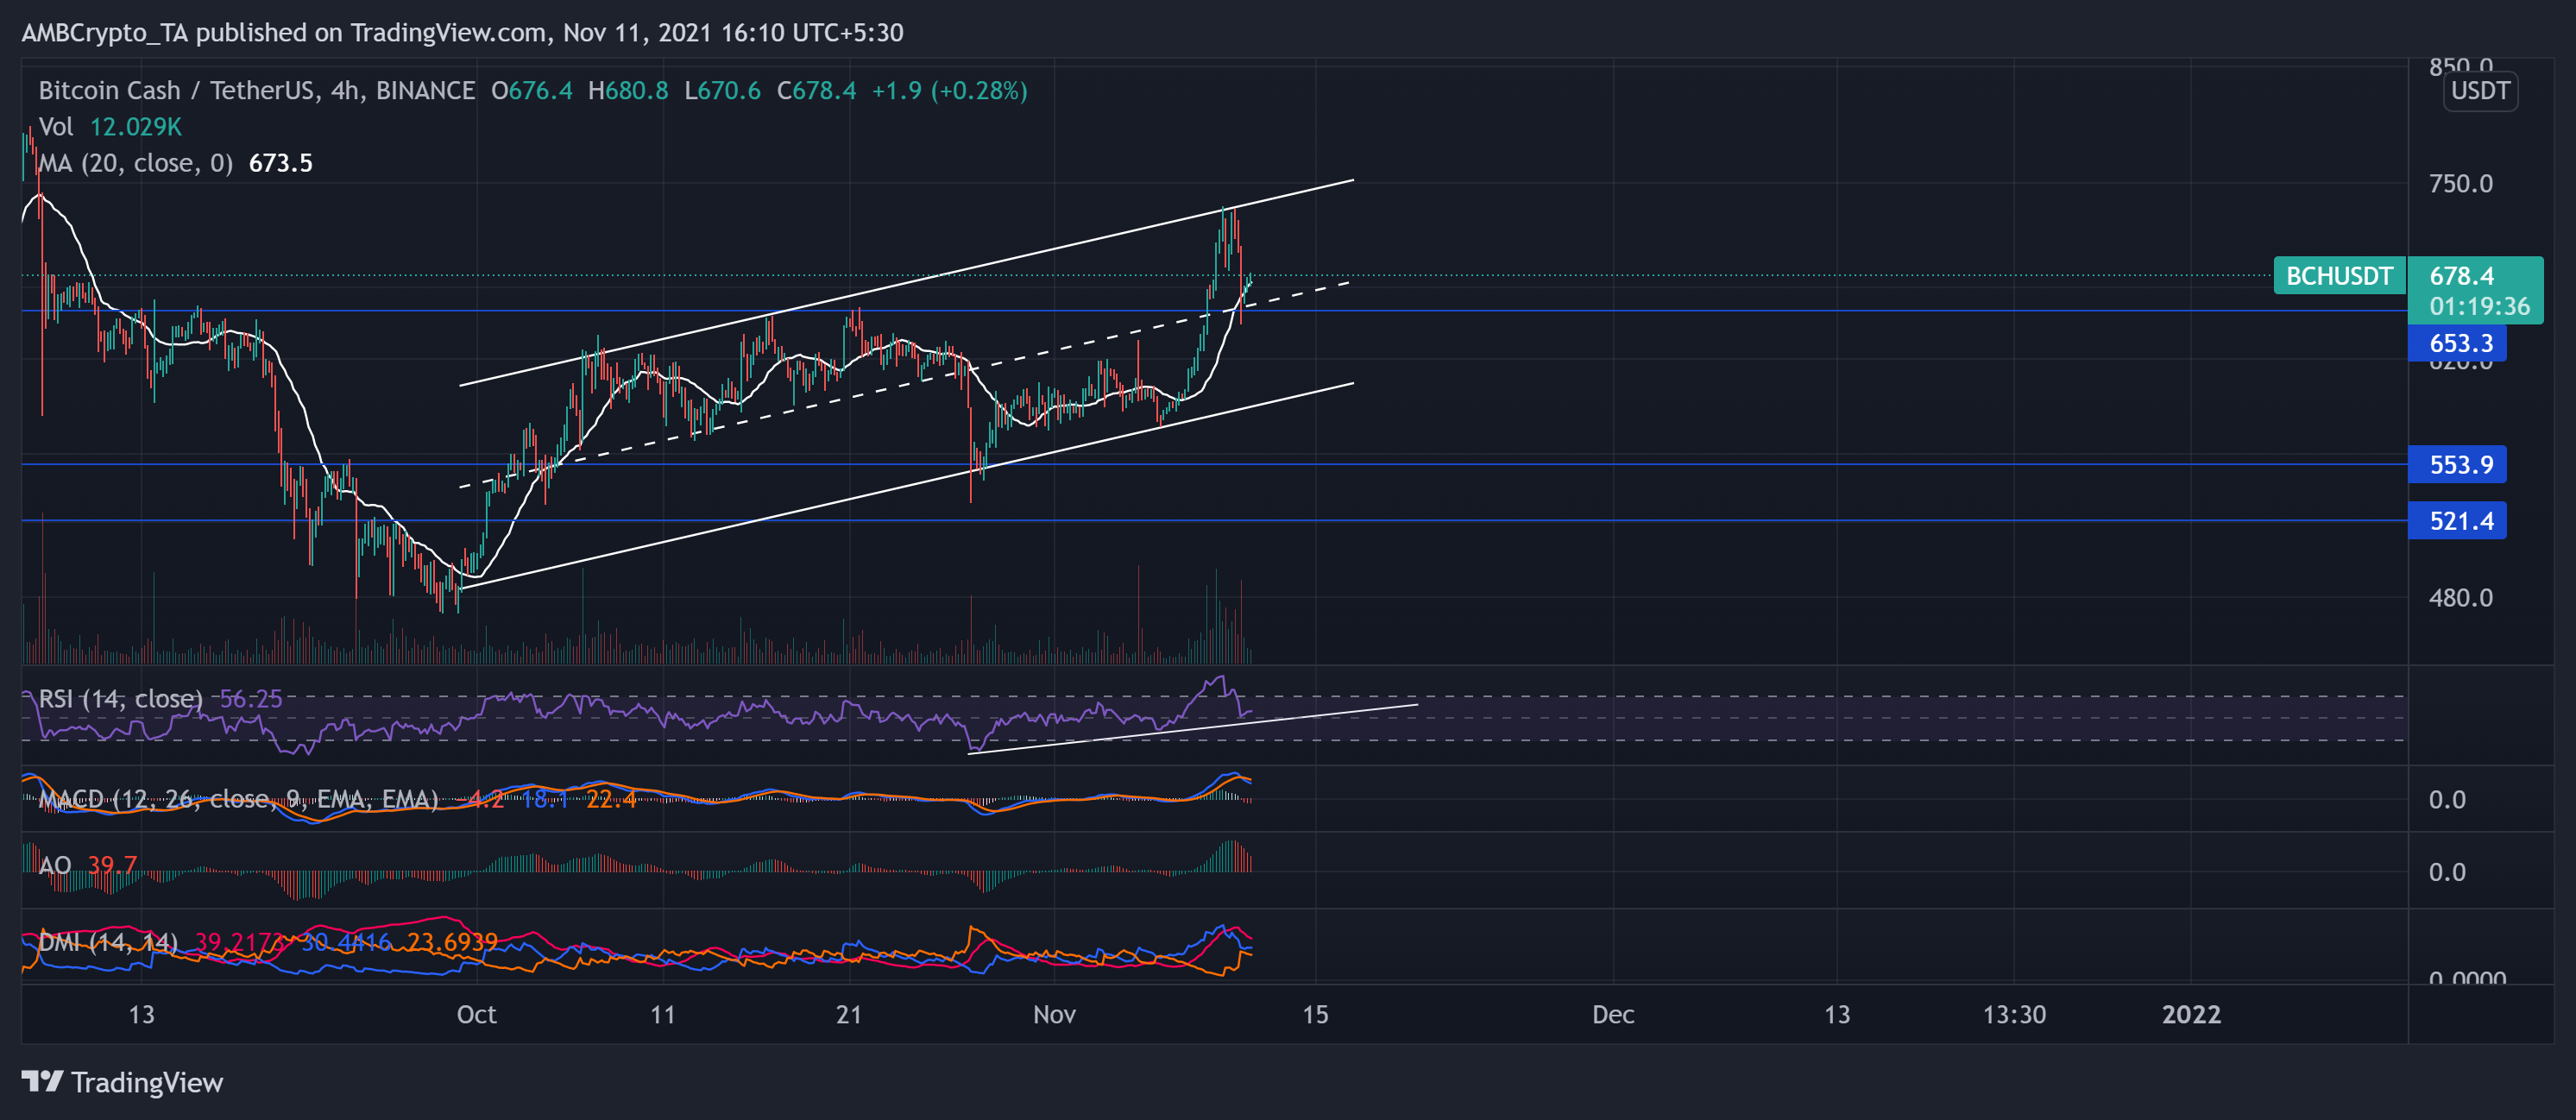
BCH performed well for over a month by steadily ascending within the parallel channel. The uphill ascent resulted in a nearly 26% 42-day ROI. As a consequence, the altcoin touched its nine-week high on 10 November. Since then, the bears countered the bull pressure while the price action obliged the trendlines.
Although BCH saw a 2.94% decline over the past day, the price traded slightly above its 4 hour 20-SMA. This reading indicated a preference for the bulls while they keep extending the support levels. Near-term technicals fancied the buyers but hinted at possible ease in bullish momentum. At press time, BCH traded at $678.4.
The Relative Strength Index (RSI) was above the half-line in an uptrend, favoring the bulls. Additionally, the bullish readings on the Directional Movement Index (DMI) correspond with RSI’s interpretation. However, the red signals flashed by Awesome Oscillator (AO) and MACD visibly affirm the near-term decreasing buying pressure.
VeChain (VET)
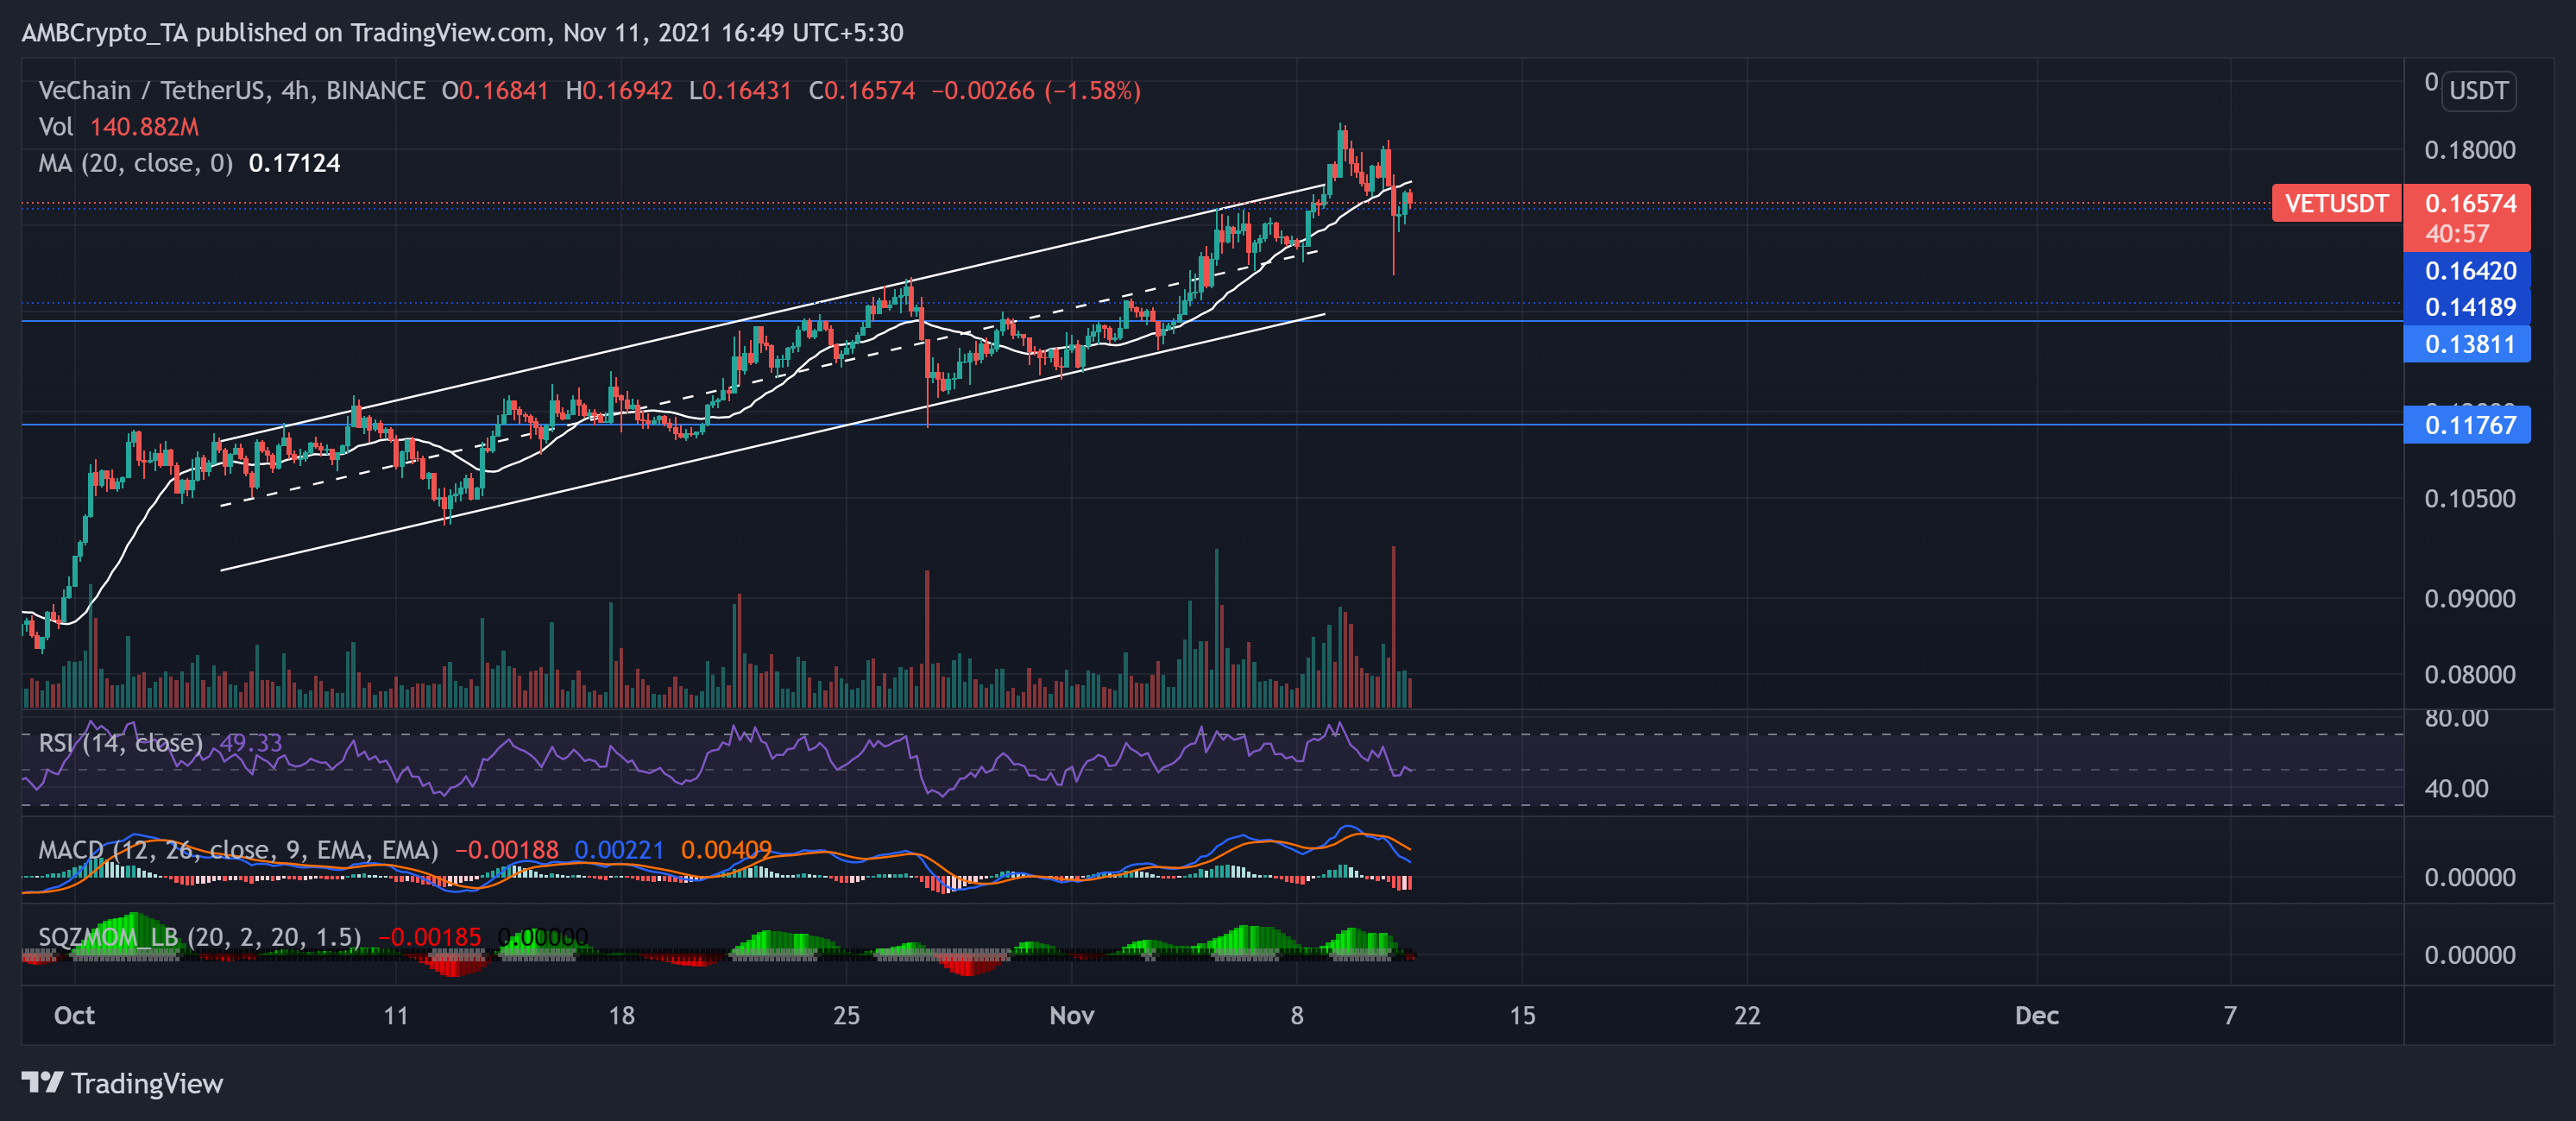
VET witnessed a poised uptrend since 5 October. As the price oscillated between the two parallel lines heading north, the alt saw a 55.33% gain on its monthly charts. Consequently, VET reached its nearly six-month high on 9 November at the $0.187-mark. After which, the alt saw a retracement over the past two days.
VET noted a 4.9% decline in 24 hours as technicals hinted at decreasing buying strength in the near term. At press time, VET traded below its 4 hour 20-SMA at $0.16574.
The RSI plunged by 9 points and seemed to head south, indicating decreasing buying strength in the near term. Moreover, the MACD lines were in agreement with RSI as showed a preference for the selling strength. Also, the Squeeze Momentum Indicator displayed black dots indicating a squeeze phase with low near-term volatility.
Decentraland (MANA)
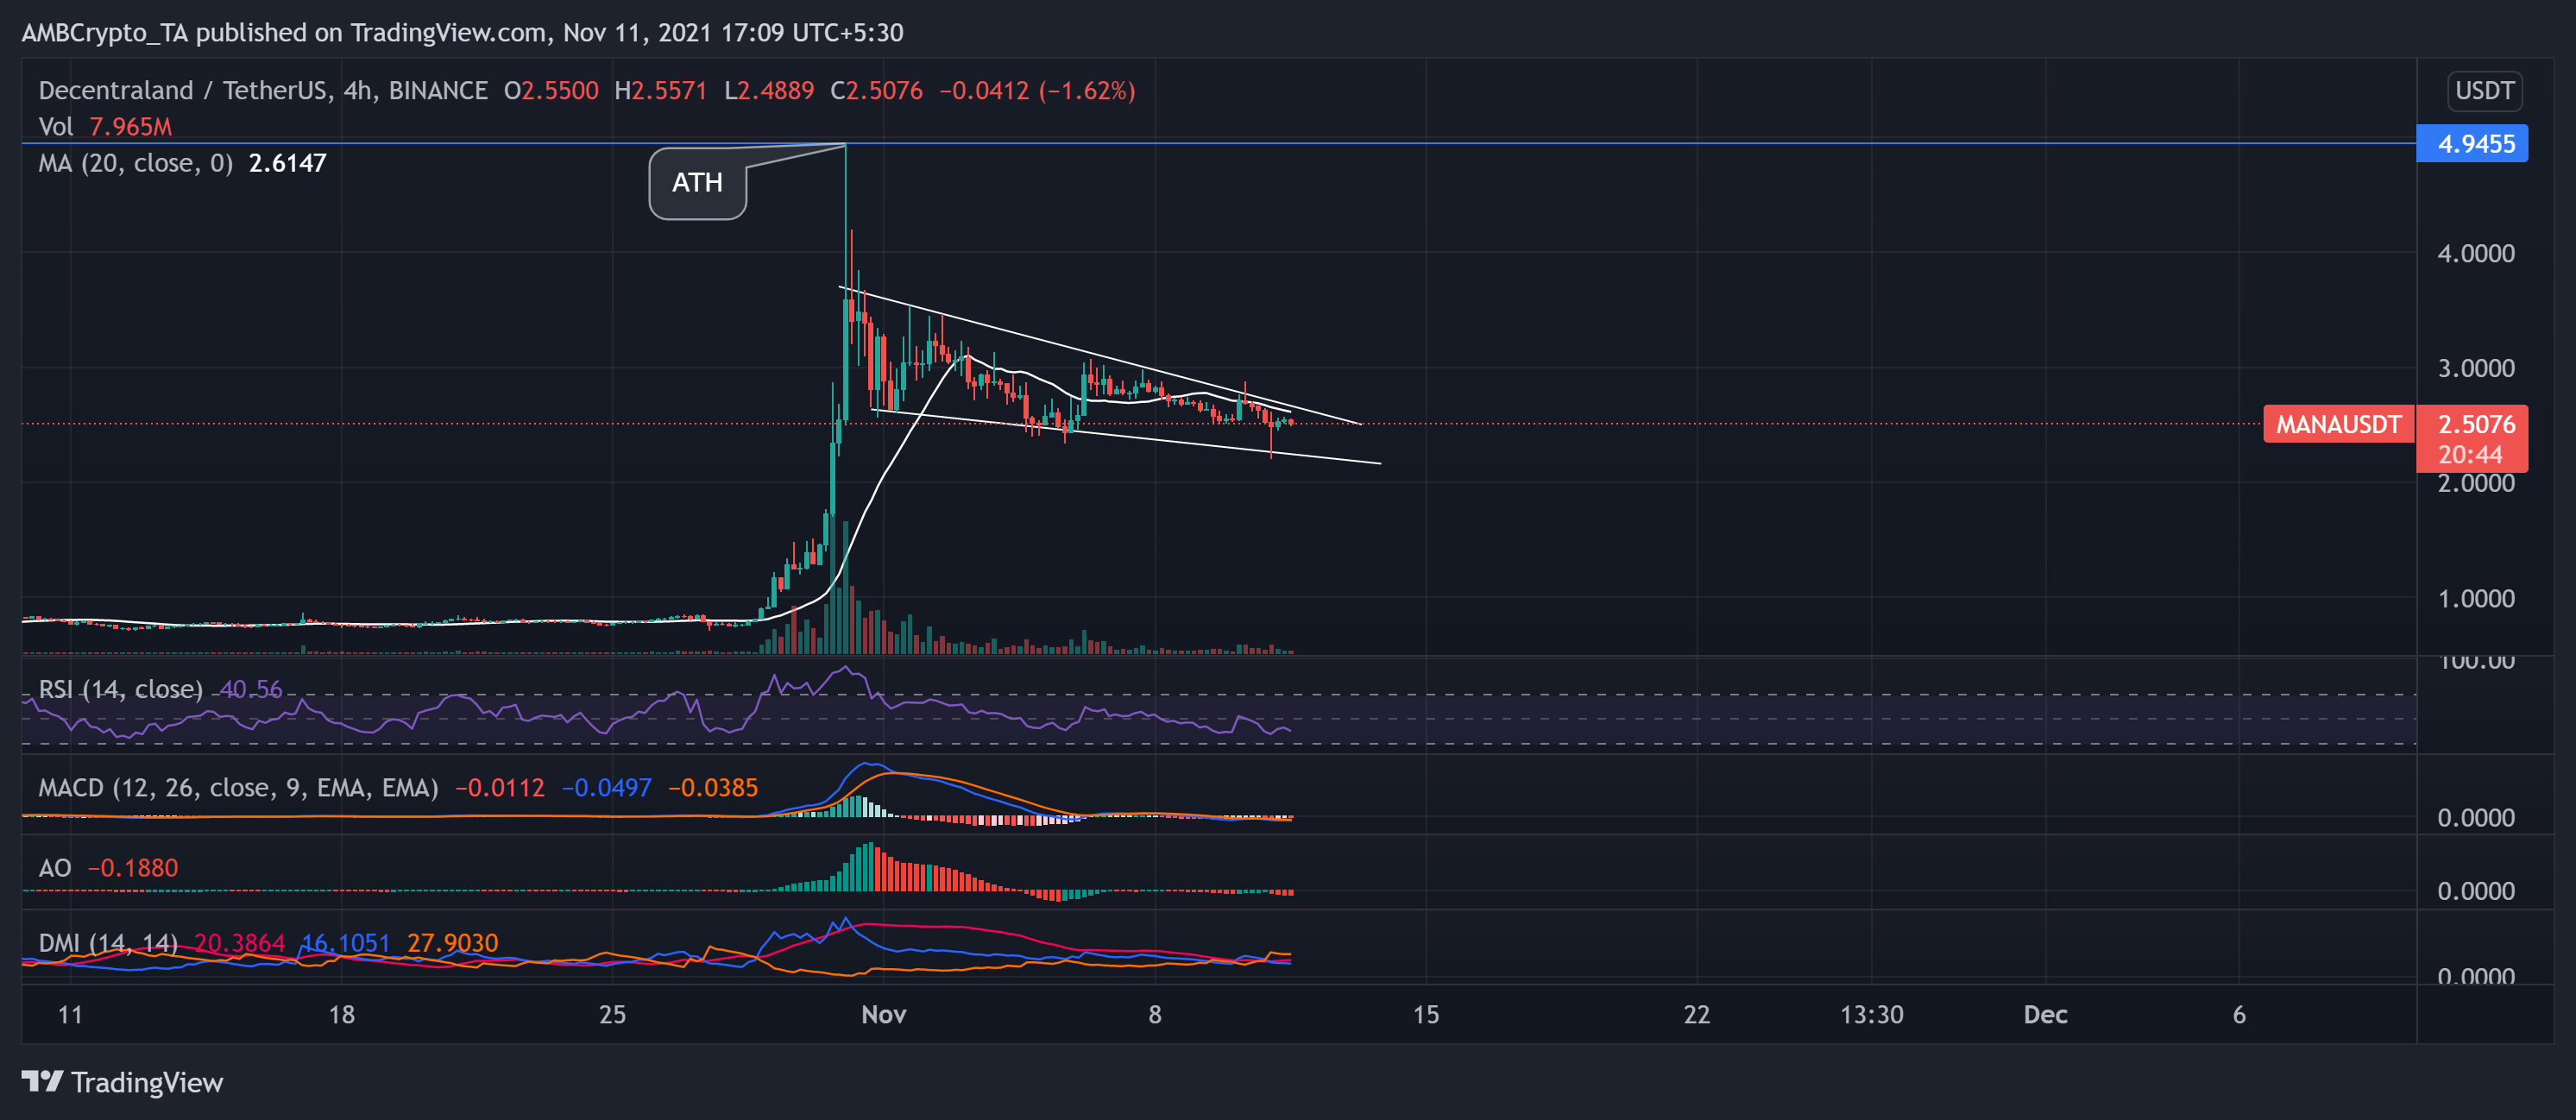
The Ethereum-powered virtual world’s native token MANA witnessed soaring gains from 28 October. MANA rallied by over 520% to touch its ATH on 31 October at the $4.9-mark. Since then, the price action headed south in a falling wedge pattern as the buying momentum eased.
Near-term technicals reiterated a decreasing buying power. As a result, MANA traded at $2.5076 after noting a 5.7% loss in 24 hours.
The RSI was in a downtrend at the 40-mark, suggesting a preference for the sellers. Also, the AO marked lower peaks while it flashed red signals. This reading matched with the RSI’s narrative. However, the MACD histogram flashed shorter light red bars, hinting at a possible revival of the bulls if they sustain their pressure.


