Bitcoin, Cosmos, Aave Price Analysis: 04 January

While the market-leading crypto failed to snap its immediate resistance near the $47,000 mark, its OBV upturned over the past week. This movement indicated a potential stalling of the sell-off. Meanwhile, Aave bulls strived to cross the 61.8% Fibonacci resistance.
Cosmos, on the other hand, formed an inverse head and shoulder and reached an overbought position.
Bitcoin (BTC)
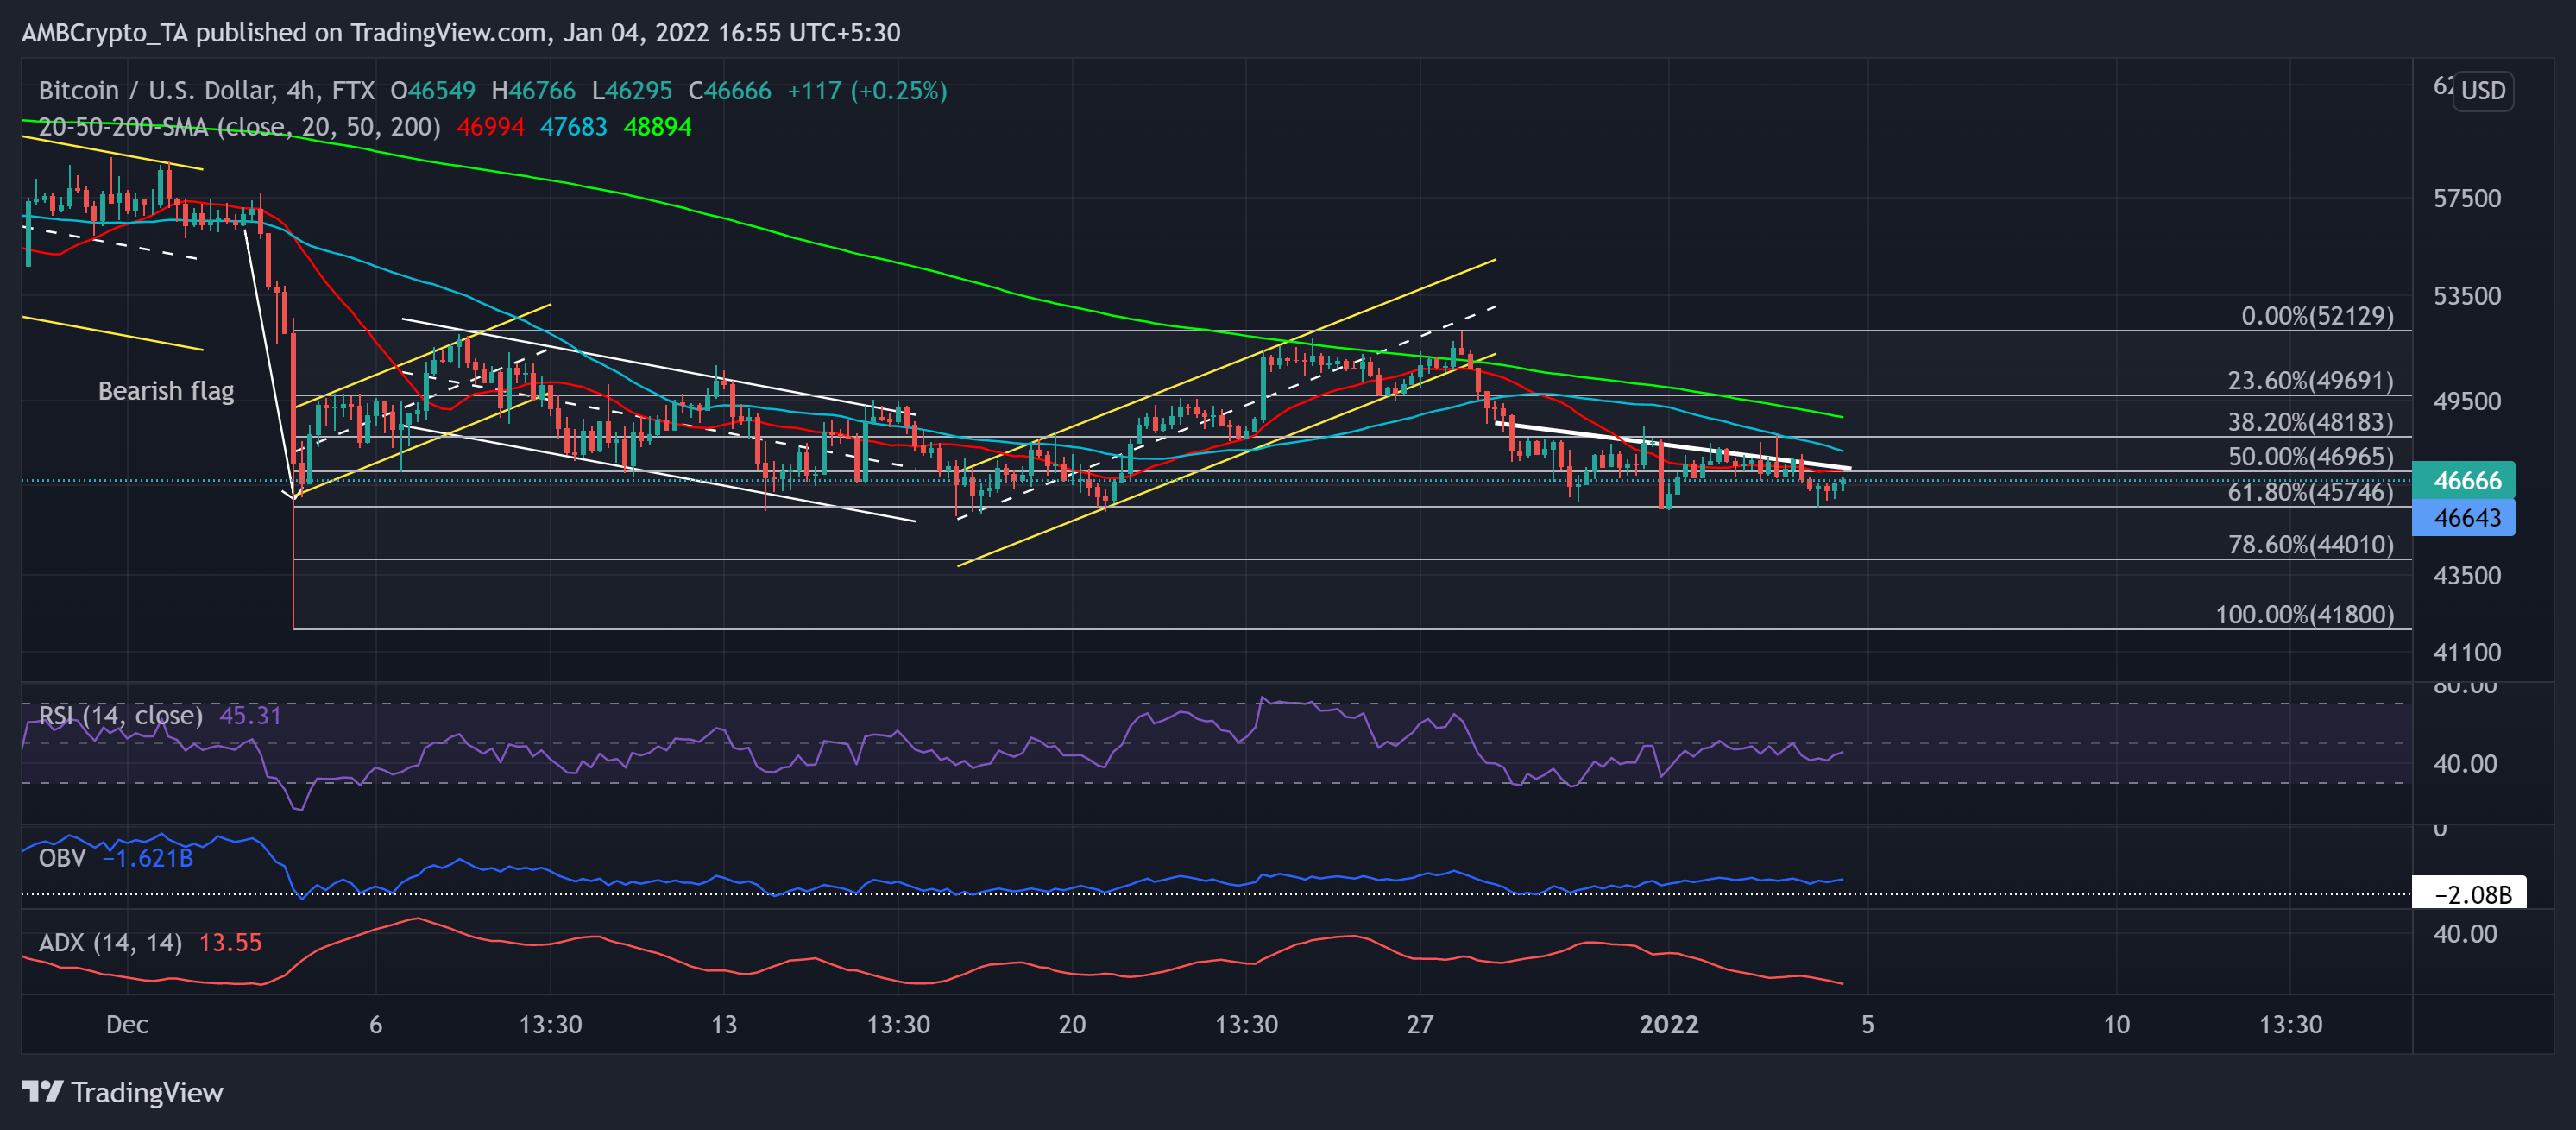
Since striking its ATH on 10 November, BTC consistently marked lower peaks. As the fear sentiment kept surging, the largest crypto witnessed multiple sell-offs that hindered its recovery phase. Ever since BTC broke out of the bearish flag, it found reliable support at the golden 61.8% Fibonacci level for the past month.
Now, as the recent up-channel (yellow) saw a breakdown from the $52,000-mark, the king coin marked lower peaks while ensuring the $45,700-level. This trajectory indicated an increasing selling power. Meanwhile, as the fear and greed index plunged below the 25 mark, BTC fell below its 20-50-200 SMA.
At press time, BTC traded at $46,666. Although the RSI saw higher toughs, it continued to find resistance near the half-line. However, while the price marked lower peaks since 28 December, the OBV was upturned. This reading hinted at a possible reversal. Besides, the ADX displayed a weak directional trend for the crypto.
Cosmos (ATOM)
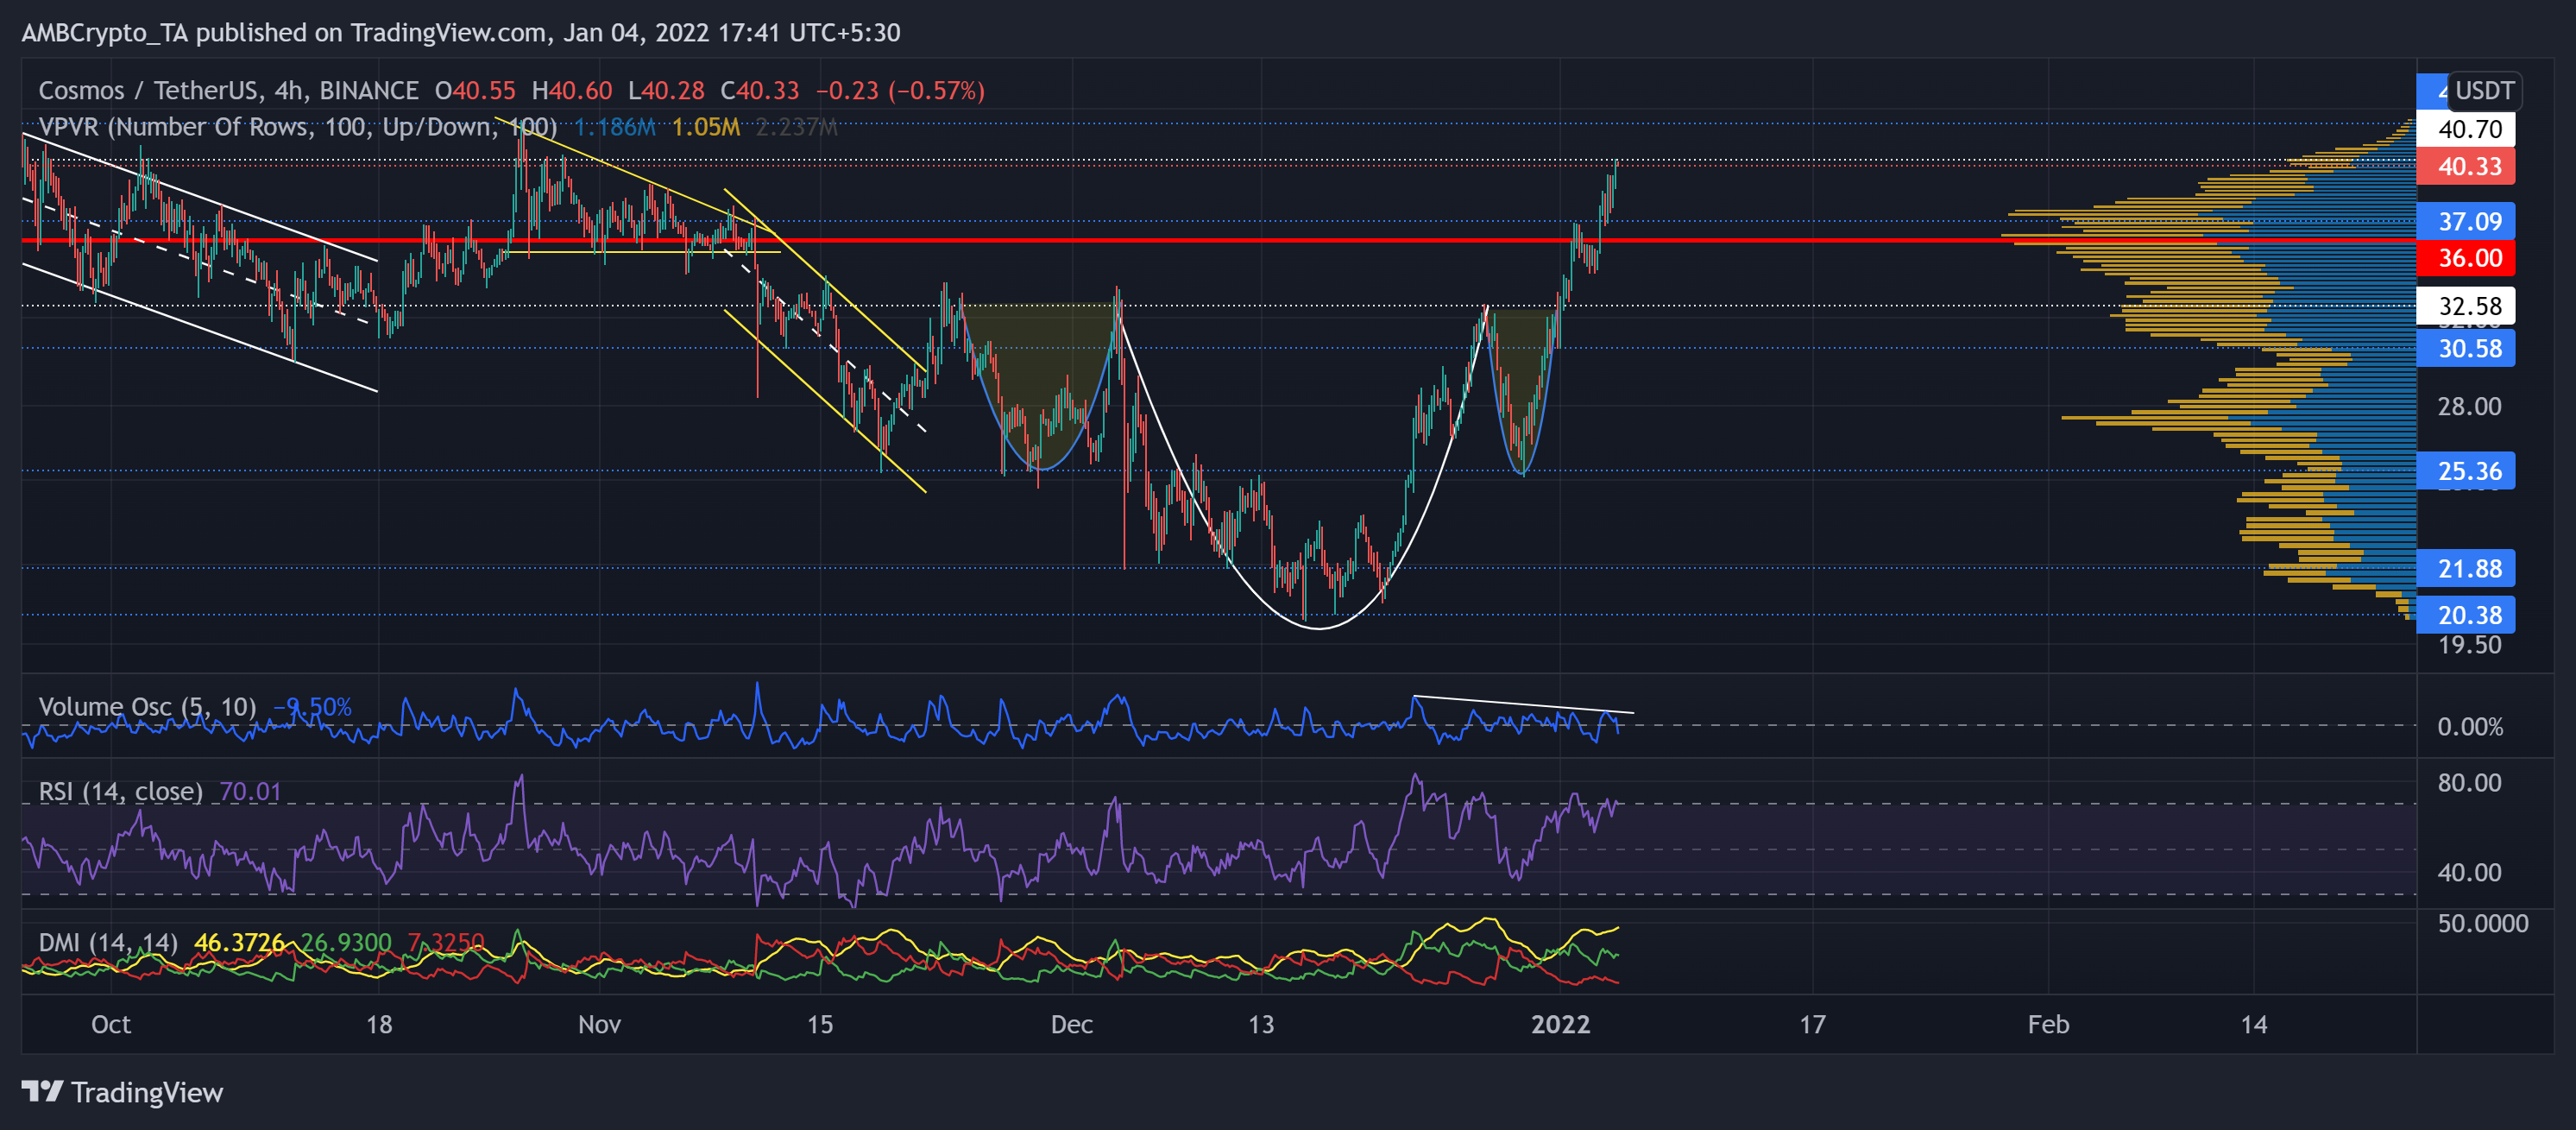
On its 4-hour chart, ATOM formed an inverse head and shoulder pattern over the past six weeks. Thus, after a nearly 63% rally (from 29 December low), the alt saw an expected breakout from the bullish pattern and traded near its two-month high at press time. This incline pushed ATOM above its 24-week Point of Control (red) at the $36-mark.
After retesting the $32.5-support for over seven weeks, the bulls finally initiated a sustained breakout for the past four days. However, the Volume oscillator marked lower peaks, instead of higher highs. Now, As the bulls face a hurdle at the $40.7-mark, the immediate testing support stood near $37.
At press time, ATOM traded at $40.33. The RSI undeniably skewed in favor of the buyers in the overbought region. Also, the DMI confirmed RSI’s conclusion. Keeping the overbought RSI threat in mind, a near-term reversal should not surprise the investors/traders.
AAVE
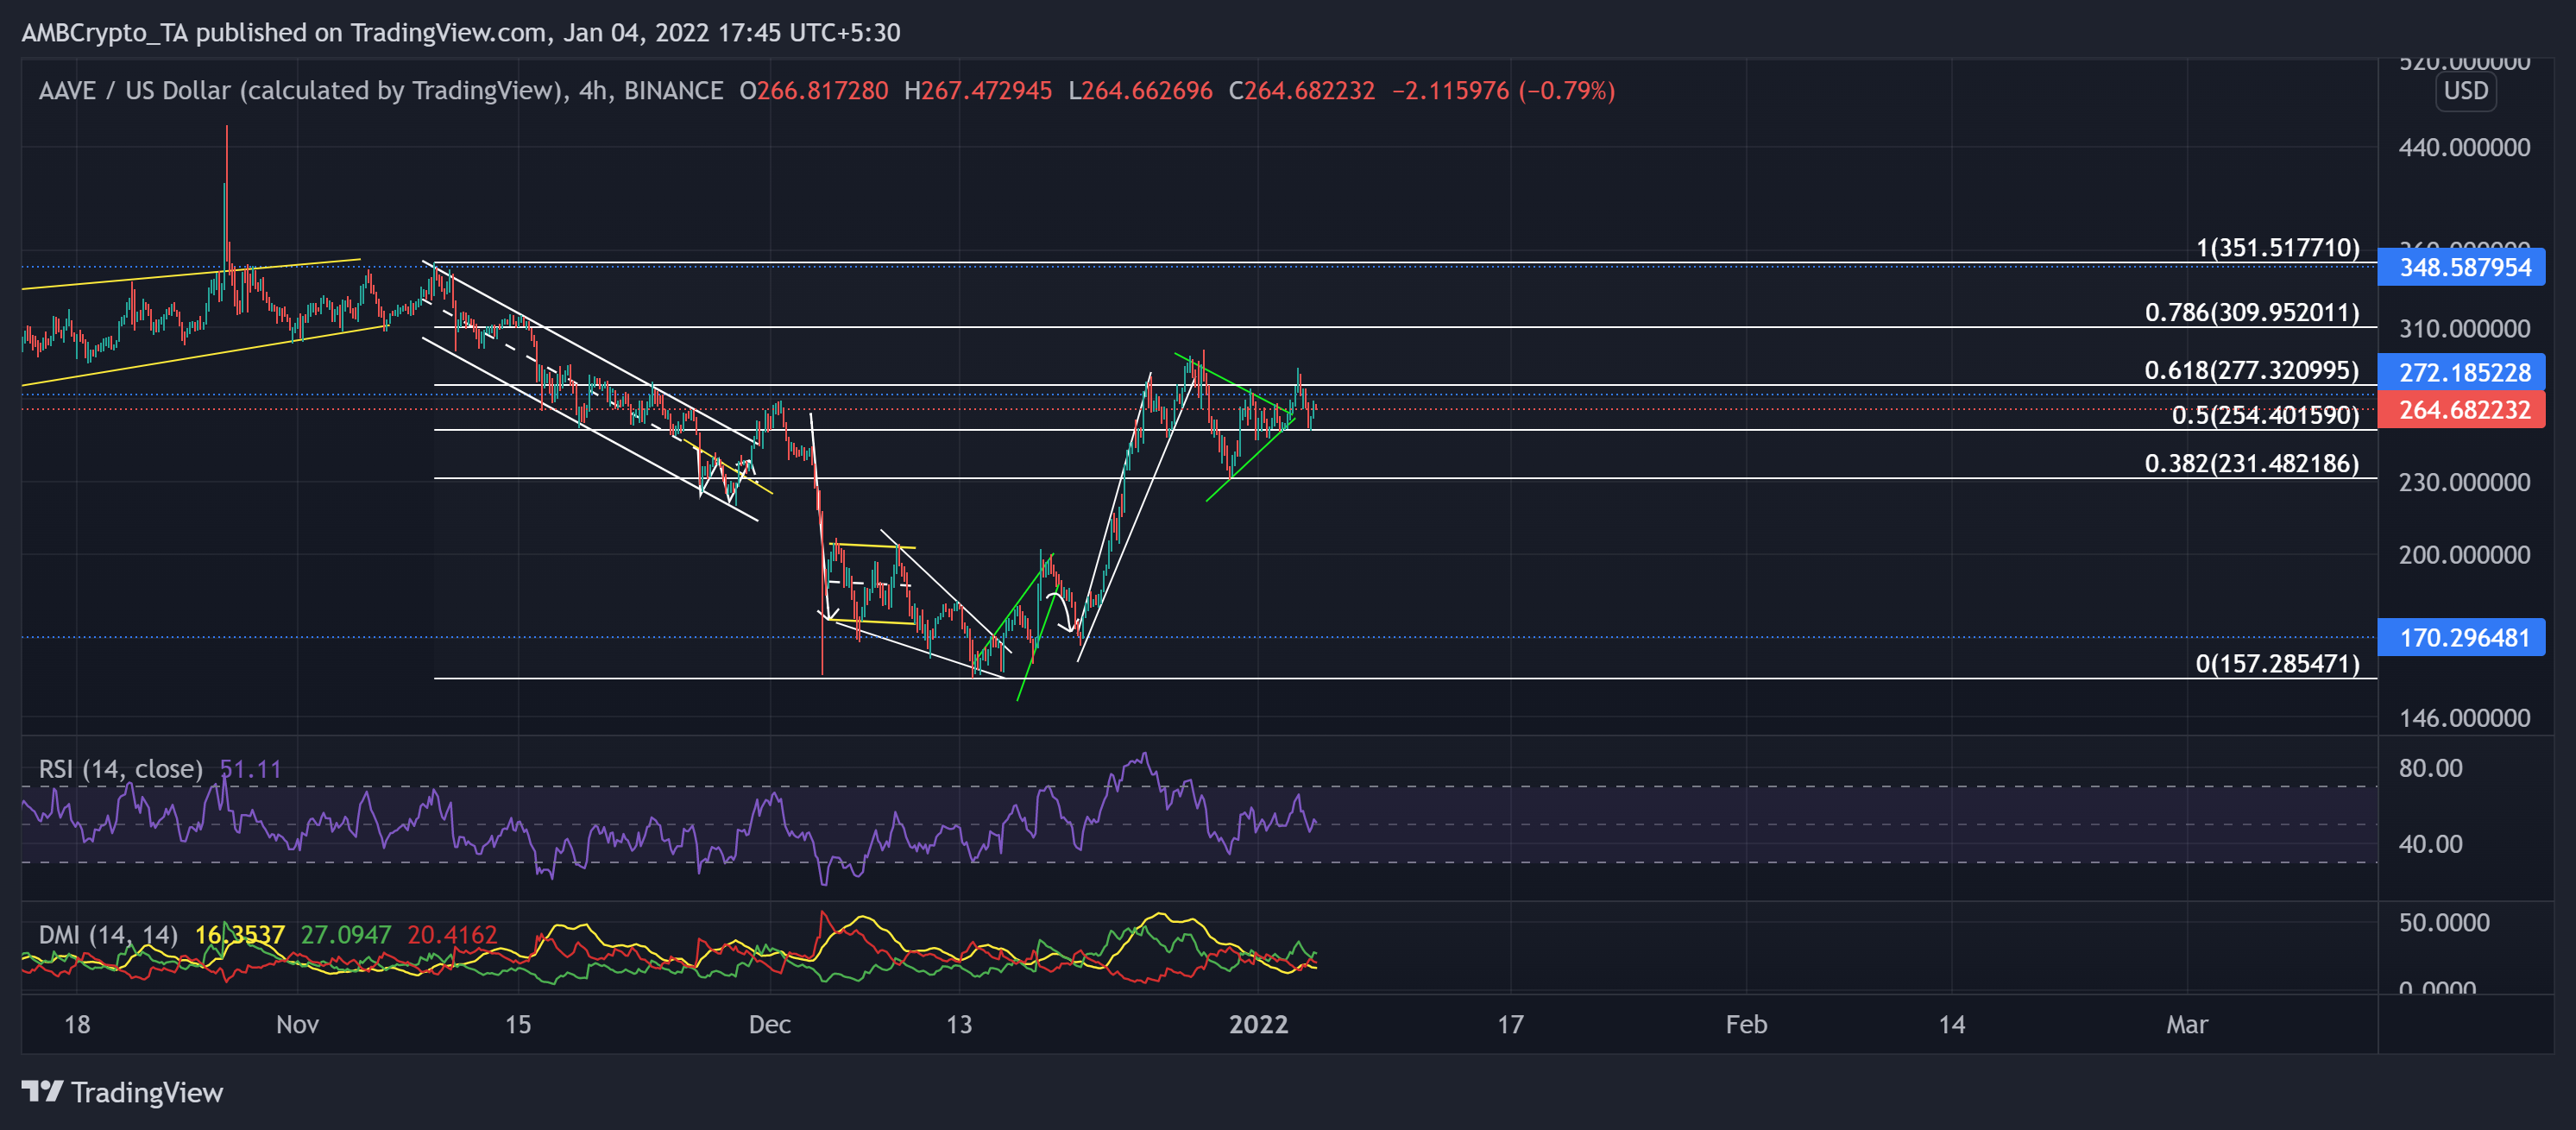
The alt reversed its descent from the crucial $170-support on 20 December. It saw a staggering 76.79%ROI (from 20 December low) until it poked its six-week high on 28 December.
Since then, the bears have ensured the 61.8% Fibonacci resistance as the price action fell after marking a symmetrical triangle on its 4-hour chart. Over the past two days, the patterned breakout halted at the 61.8% resistance.
At press time, AAVE traded at $264.68 after noting a 5.6% 24-hour loss. The RSI wavered near the half-line and flashed neutrality. While the DMI displayed a bearish edge, the ADX displayed a weak directional trend for the alt.