Bitcoin
Bitcoin defies September slump: Bullish RSI divergence signals more gains
Despite a decline on daily charts, BTC is experiencing positive market sentiment. RSI divergence has confirmed the continuation of bullish trend
- BTC has surged by 4.16% over the past week, with fundamentals indicating positive sentiments.
- Despite the lows, RSI confirms a bullish trend with a bullish RSI divergence.
Bitcoin [BTC] has experienced a strong upward momentum throughout the month. Historically, September is associated with a bearish trend. However, this month has seen a dramatic shift with BTC making higher lows.
In fact, as of this writing, Bitcoin was trading at $65,530. This marked a 10.52% increase on monthly charts with the extension of the uptrend by a 4.16% surge over the past week.
However, the last 24 hours have seen a minor correction with Bitcoin declining by 0.46%.
Therefore, the current market conditions have left analysts talking over Bitcoin’s trajectory. One of them is the popular crypto analyst Caleb Franzen
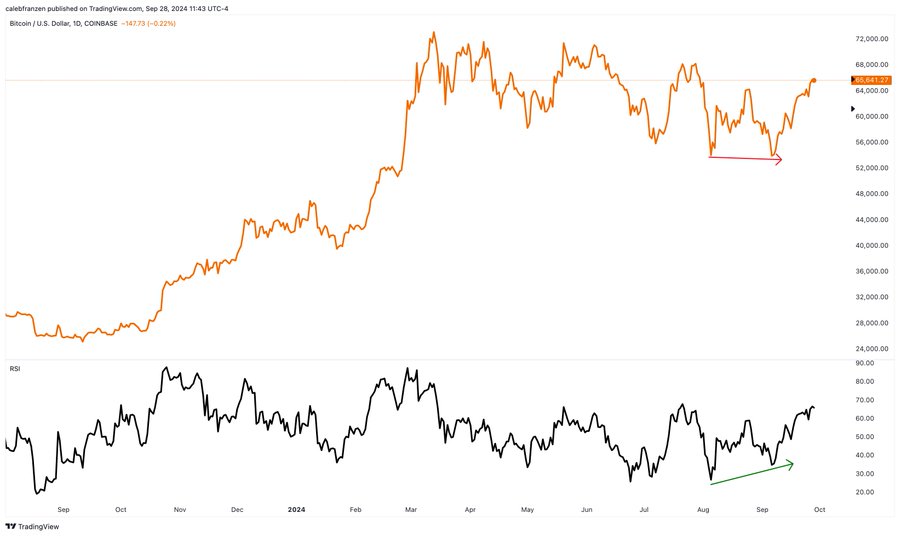
who suggested that a bullish trend is set to continue citing bullish RSI divergence.What market sentiment says
In his analysis, Franzen Cited bullish RSI divergence to argue that, the bulls are dominating the market.
Source: X
According to the analyst, RSI has not formed a bearish RSI divergence on daily charts. However, the RSI is continuing to confirm the bullish trend off the lows. Therefore, it has been confirming the bullish RSI divergence.
In context, the fact that there is no bearish divergence implies that the price increase is supported by momentum and there’s no significant sign of a reversal at this time.
When a bearish RSI divergence occurs, it indicates a weakening upward momentum and could suggest that a price correction is imminent.
Thus, although BTC might have made lower lows recently, the RSI is making higher lows indicating that momentum is building despite lower prices.
Usually, a bullish RSI divergence suggests that selling pressure is weakening and buying interest is growing leading to a further upside.
What BTC charts say
As observed by Frazen, Bitcoin is enjoying favorable market conditions. Therefore, these market conditions could set BTC for further gains on price charts.
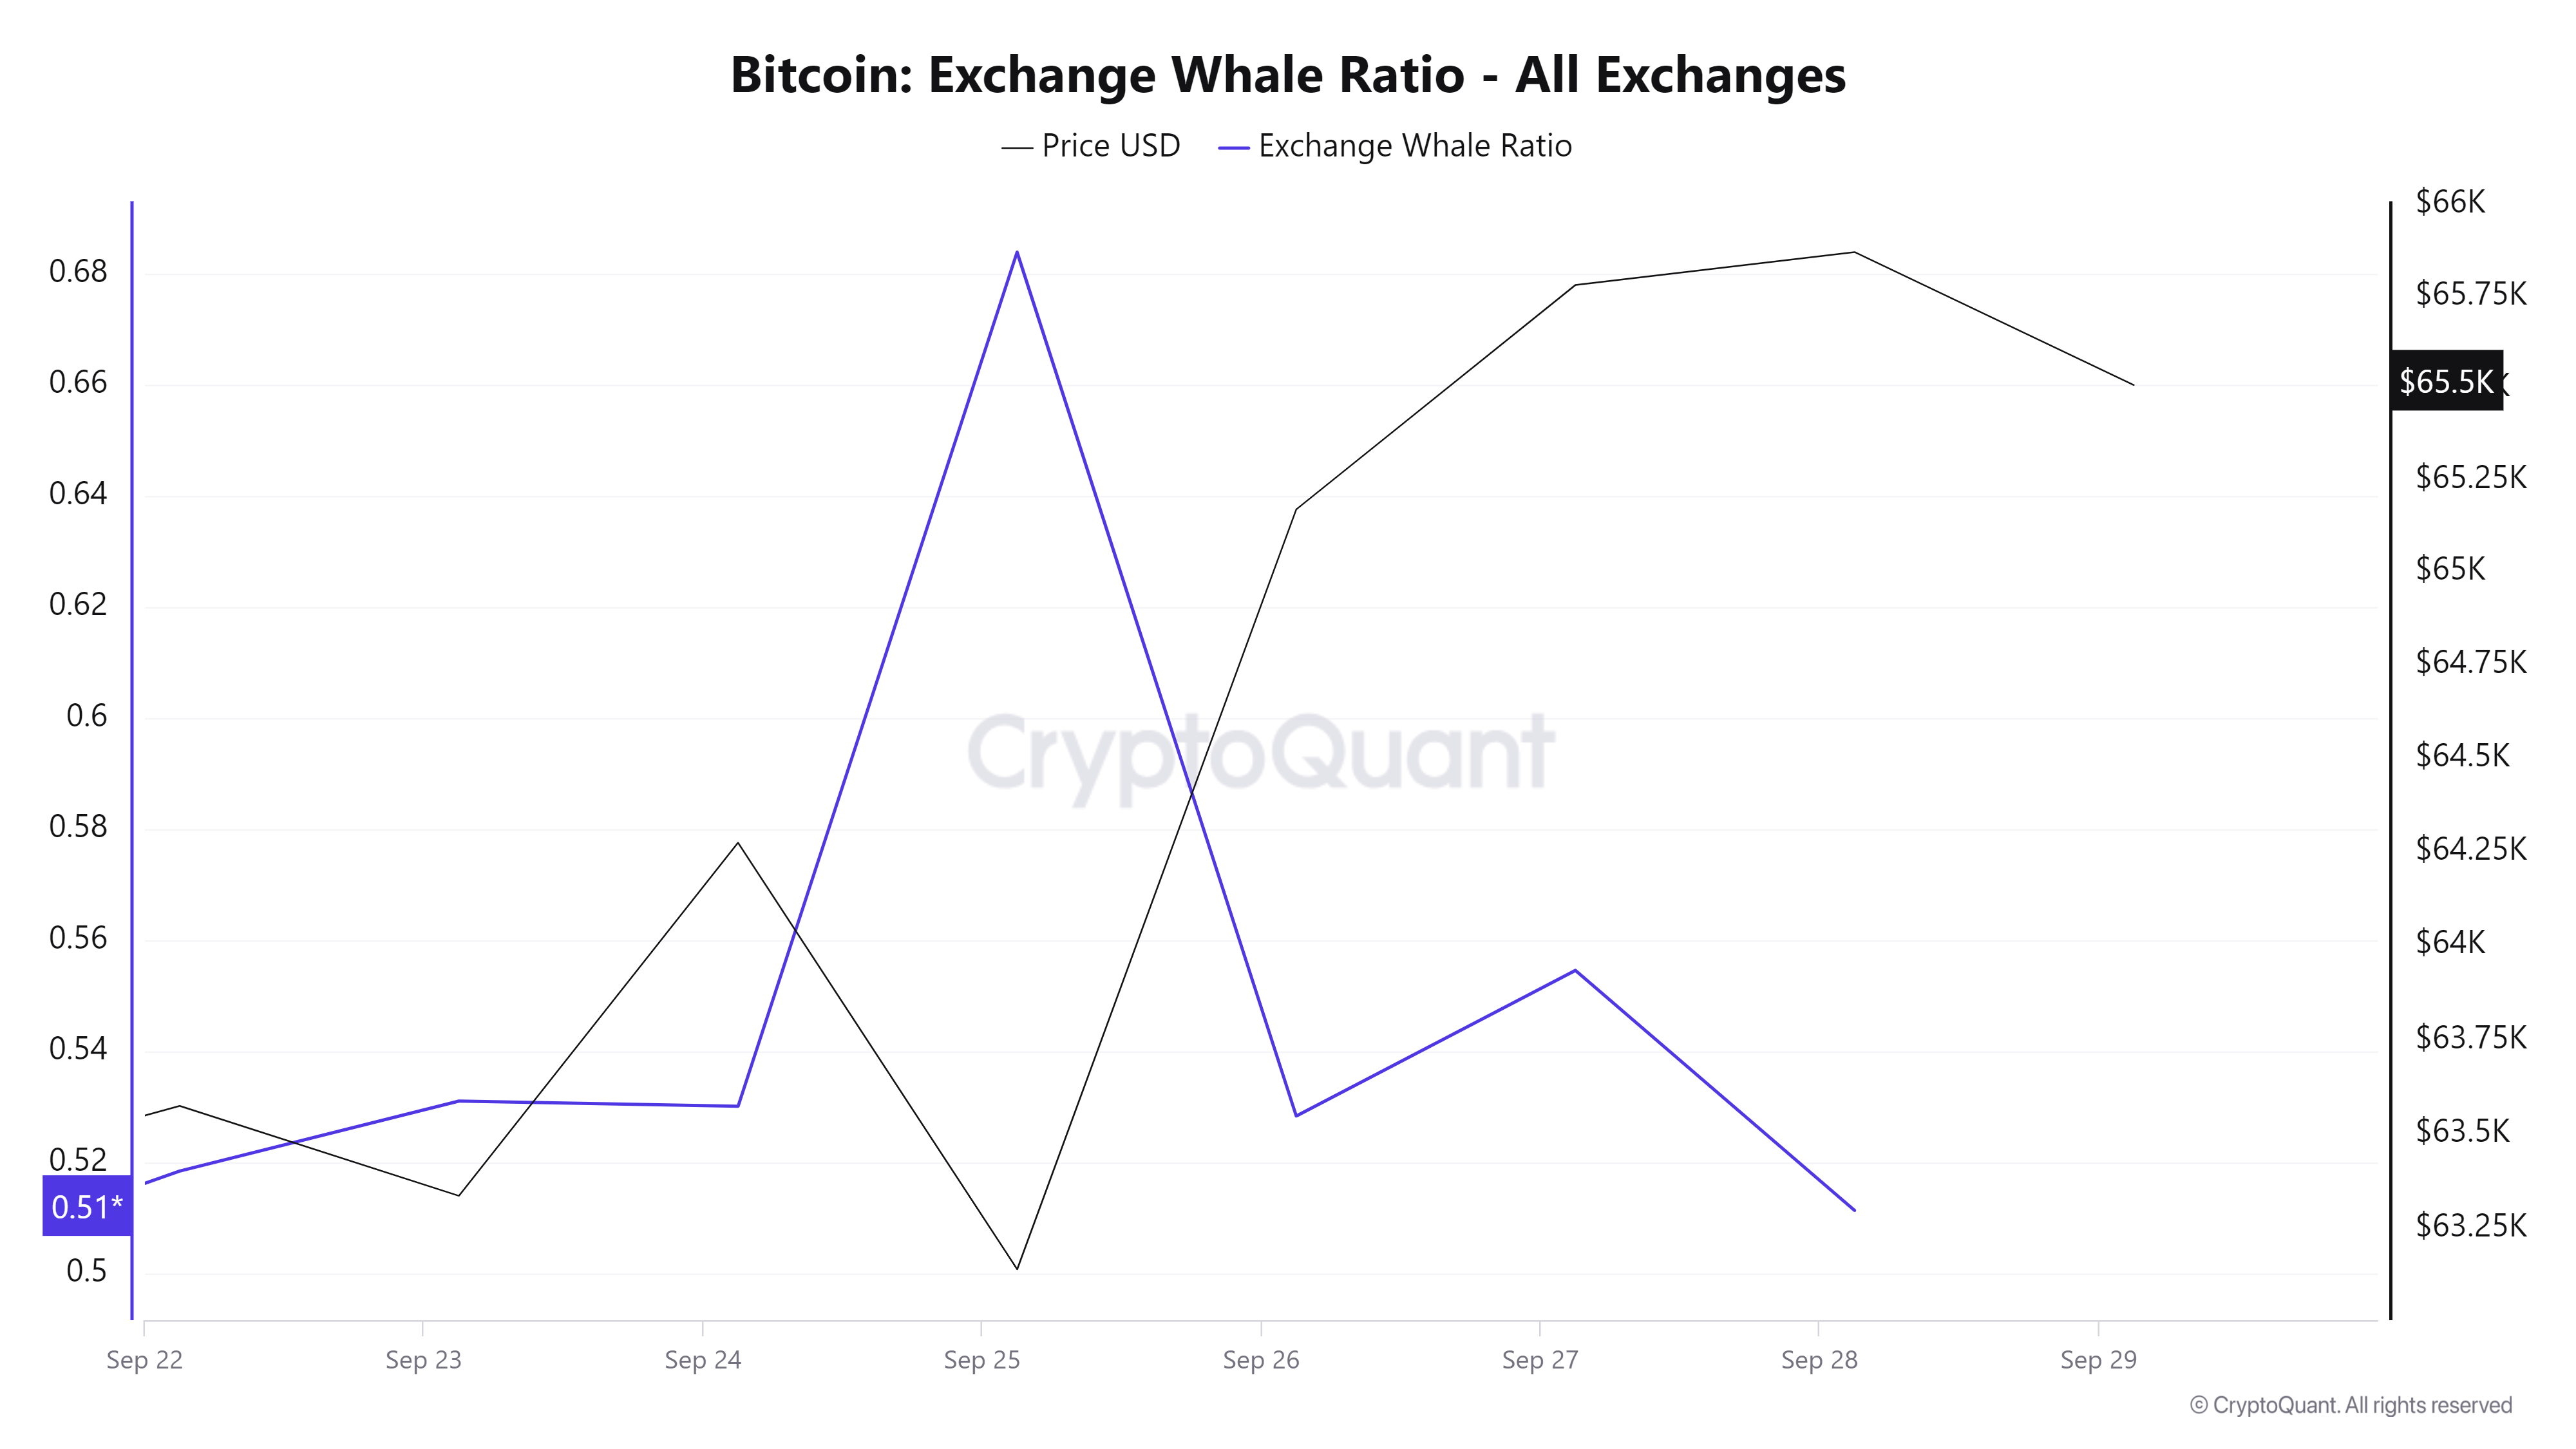
Source: Cryptoquant
For example, the Exchange whale ratio has declined from a high of 0.68 to 0.511 at press time. This decline suggests that whales are moving their BT off exchanges into private wallets.
Such market behavior is a bullish signal indicating that large holders have no plan to sell in the short term.
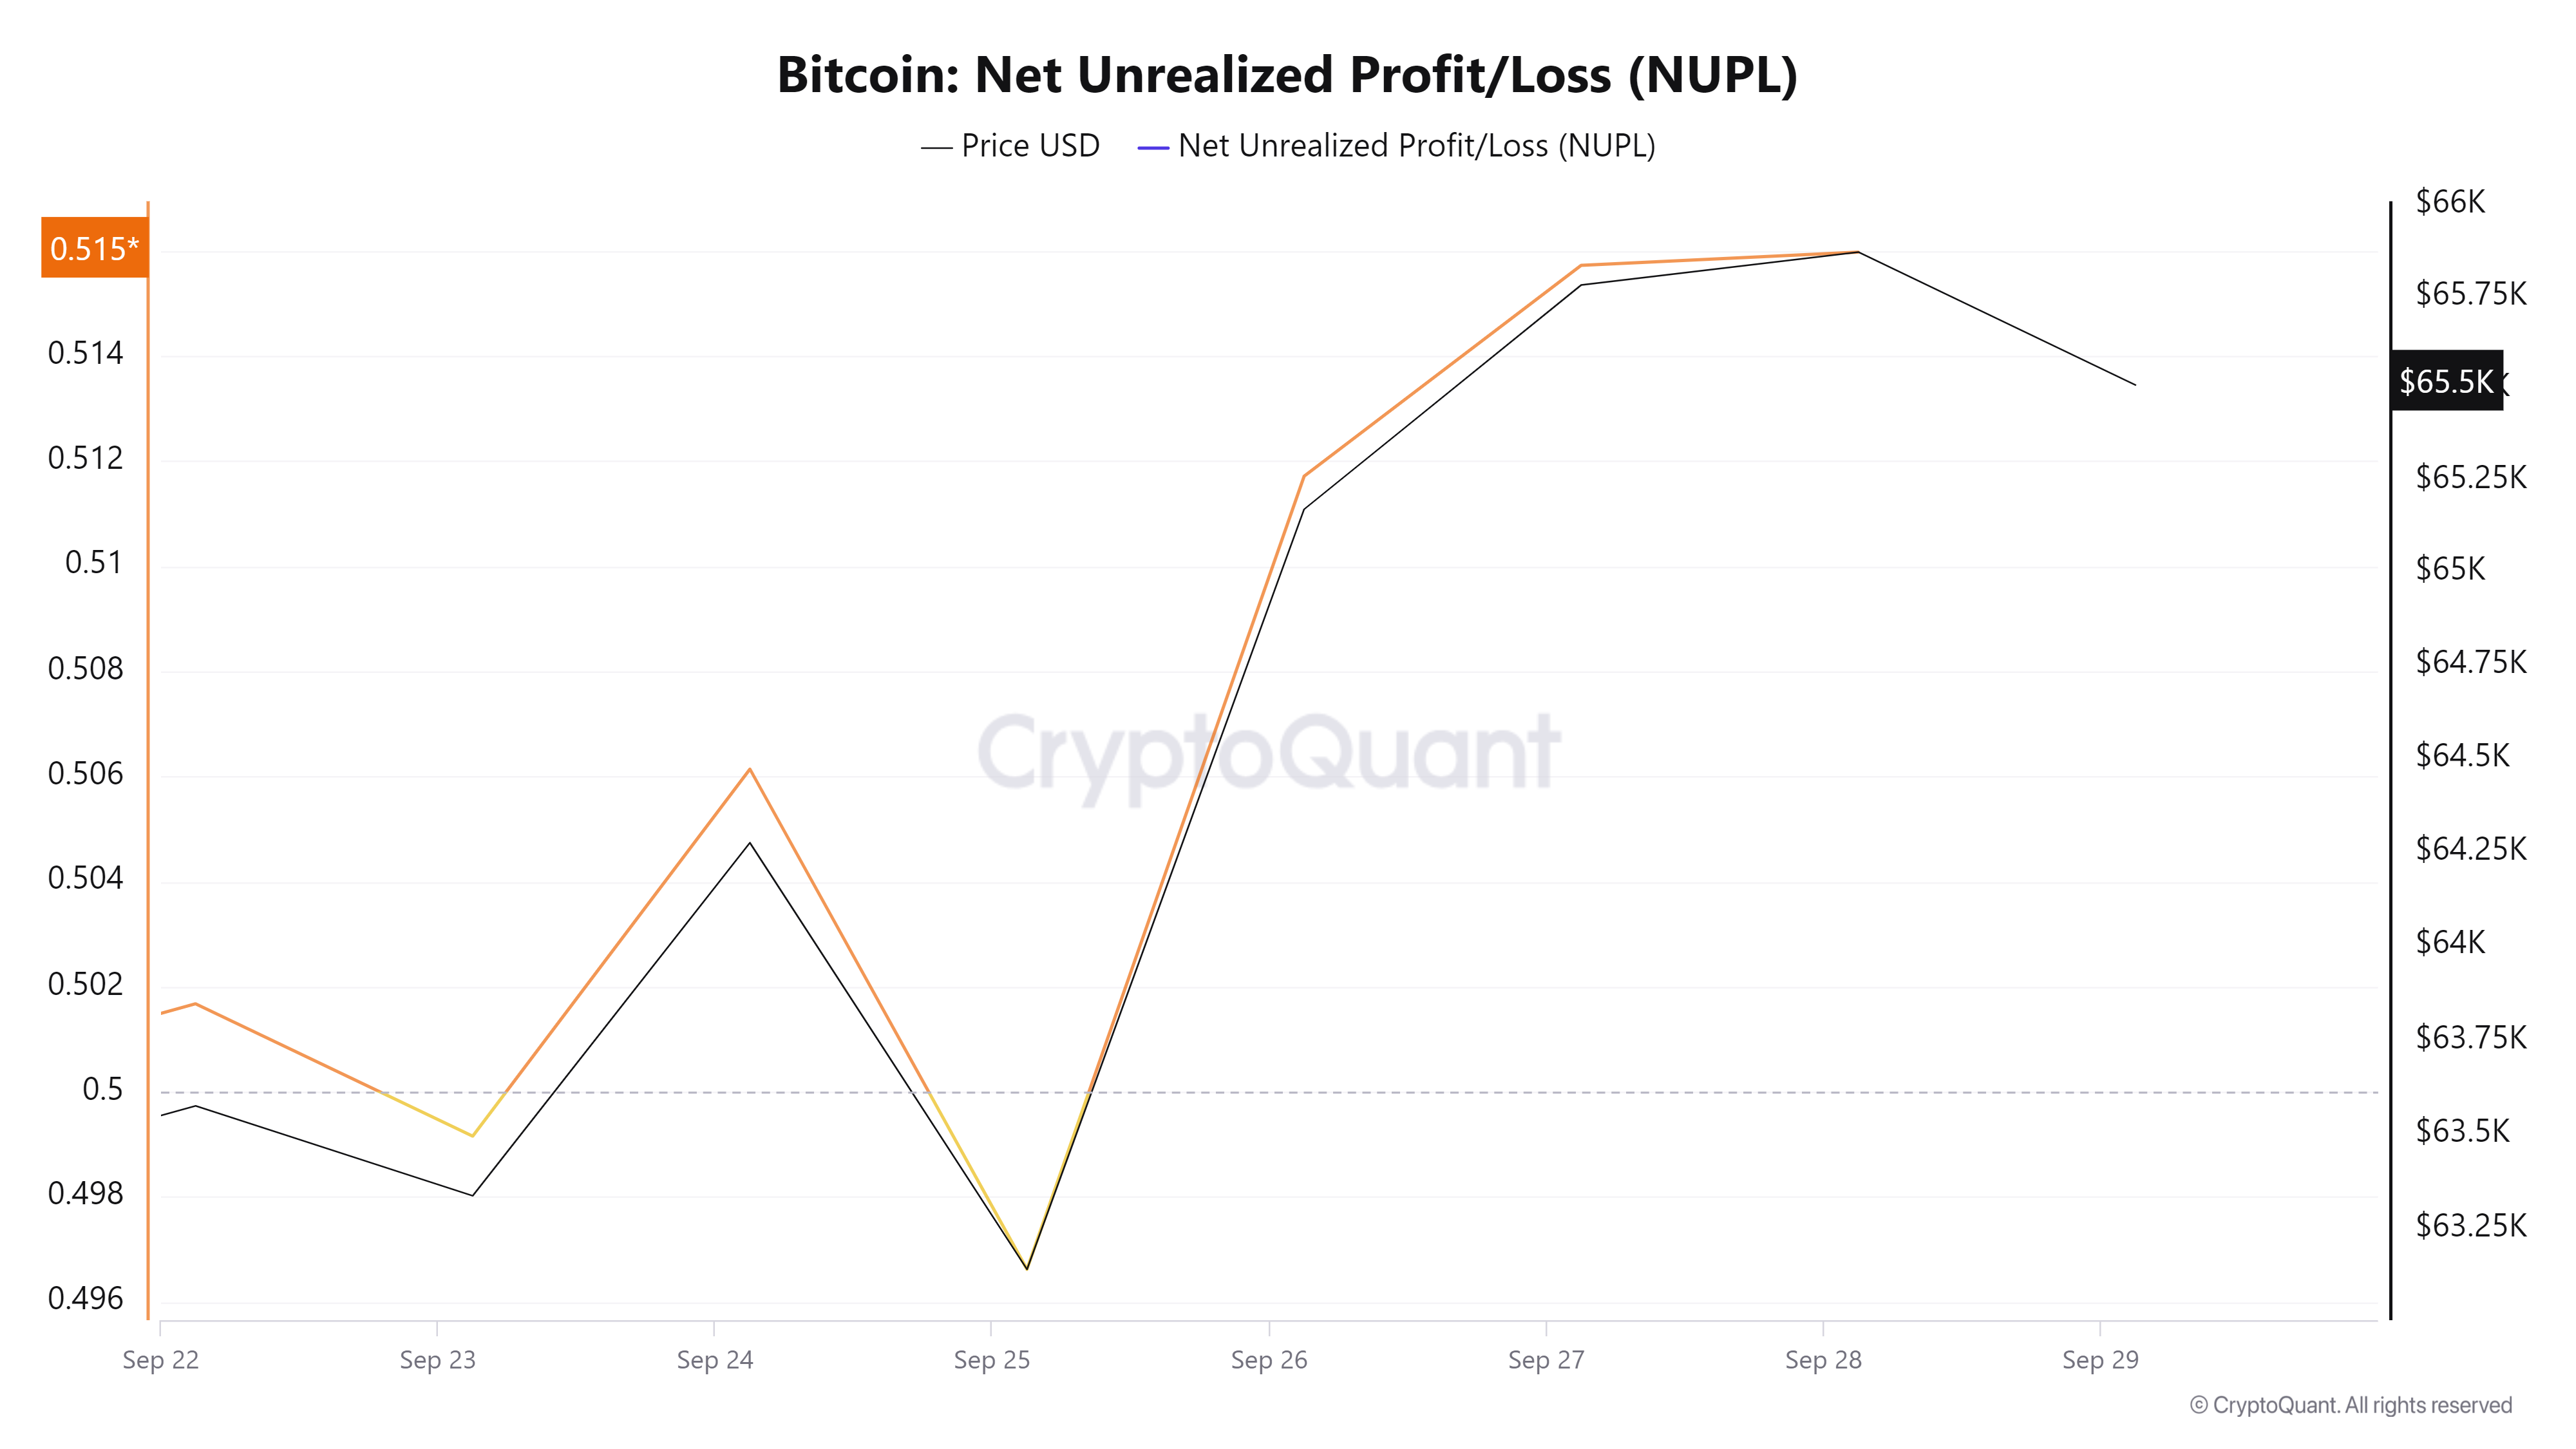
Source: Cryptoquant
Additionally, Bitcoin’s Net Unrealized profit/loss (NUPL) has risen from a low of 0.4 to 0.51 over the past week. As NUPL rises, it indicates that investors are seeing profits.
This usually occurs during the market bullish phase as prices increase exceeding the purchasing value. Therefore, it results in increased optimism as participants feel more confident in the market’s future potential, expecting further price gains.

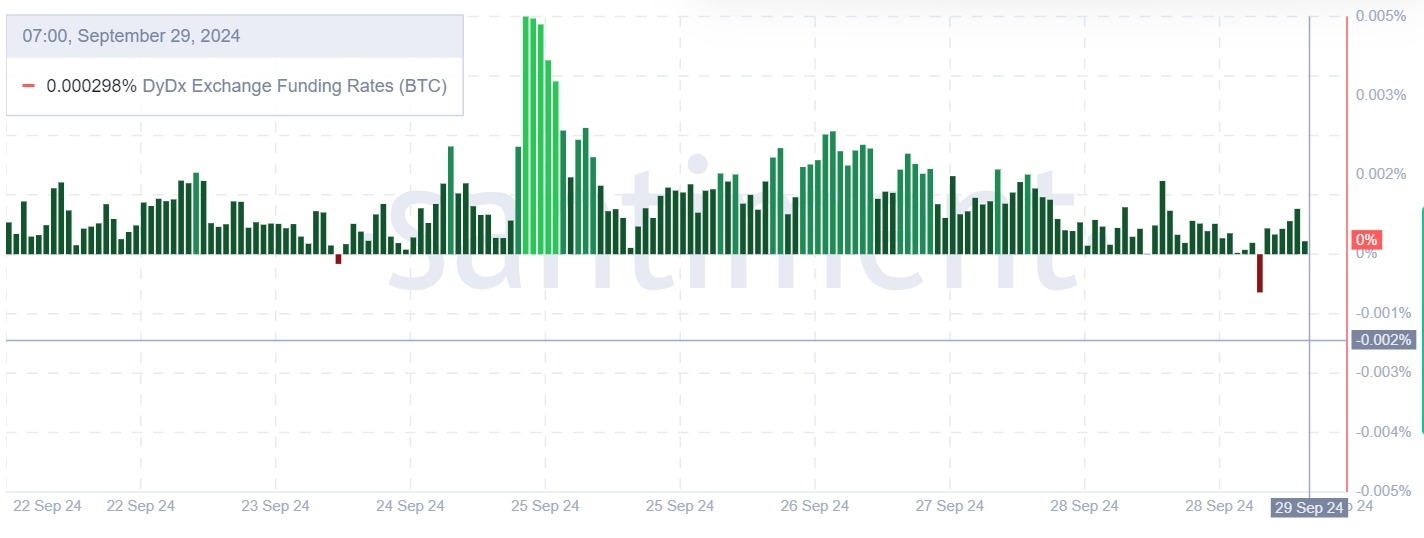
Source: Santiment
Finally, Bitcoin’s DyDx exchange funding rate has remained positive over the past week. A positive DyDx exchange funding rate suggests long position holders are paying those taking shorts to hold their position.
Is your portfolio green? Check out the BTC Profit Calculator
In such a market situation, investors are more inclined to take long positions anticipating prices to rise.
Simply put, Bitcoin is experiencing a strong upward momentum will bulls dominating the market. Therefore, in these conditions, BTC will make further gains on price charts by reclaiming the $66500 resistance level in the short term.