Bitcoin demand has stayed negative for months—Here’s what it means for BTC
The weakening demand and multi-month trends of realized losses showed Bitcoin holders were under immense pressure

On June 24, $700 million worth of long positions were liquidated across the crypto market. A Bitcoin [BTC] sell-off led to fearful market conditions and hunted down speculative long positions trying to buy the dip.
The leading crypto was trading below $60k once more, and more losses appeared likely.
Bitcoin demand has been drying up for months
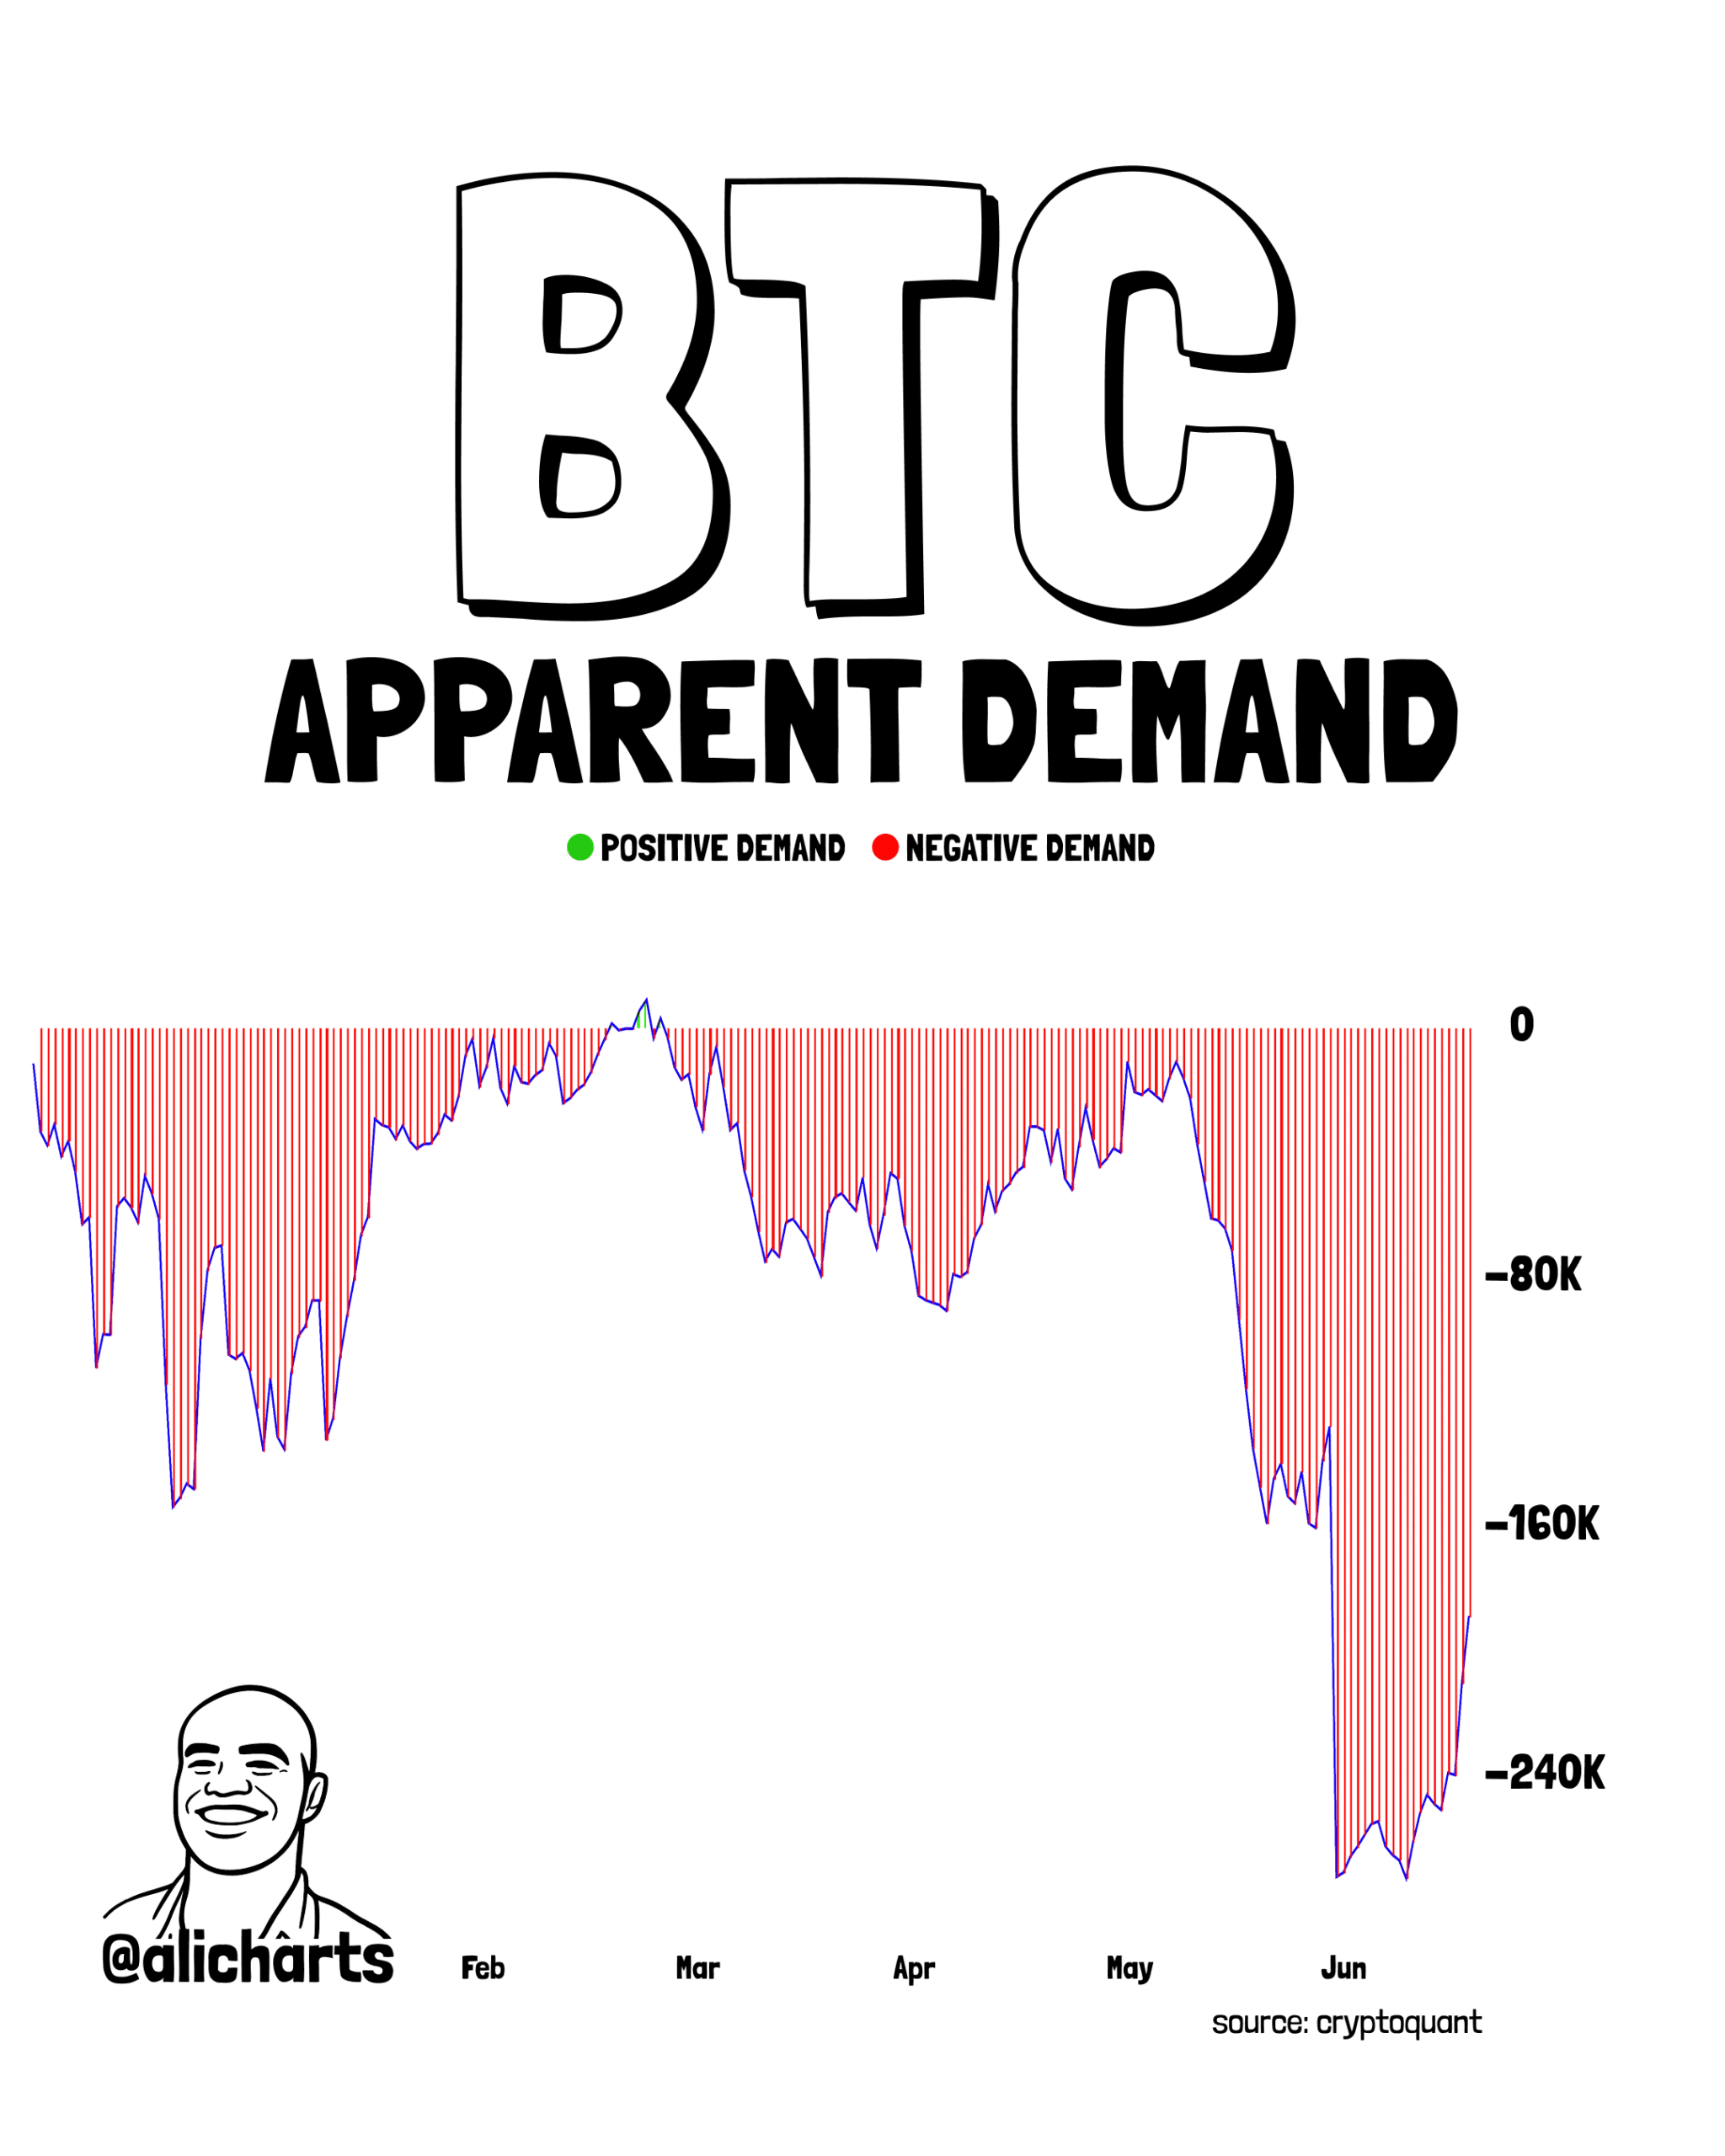
In a post on X, analyst Ali Martinez showed that BTC’s apparent demand has been negative for 208 days. The metric measures if spot demand is strong enough to absorb the supply from new miner production and old supply moving onto exchanges.
Negative values indicate that selling pressure outweighs demand, creating significant resistance to price bounces.
AMBCrypto reported that though the Bitcoin OI was down from its 2025 peaks, the volatility remained high.
The Coinbase Premium Index has been negative for over a month, signaling a lack of demand from investors in the U.S. Sustained spot ETF outflows showed a lack of confidence as the price action continued to weaken.
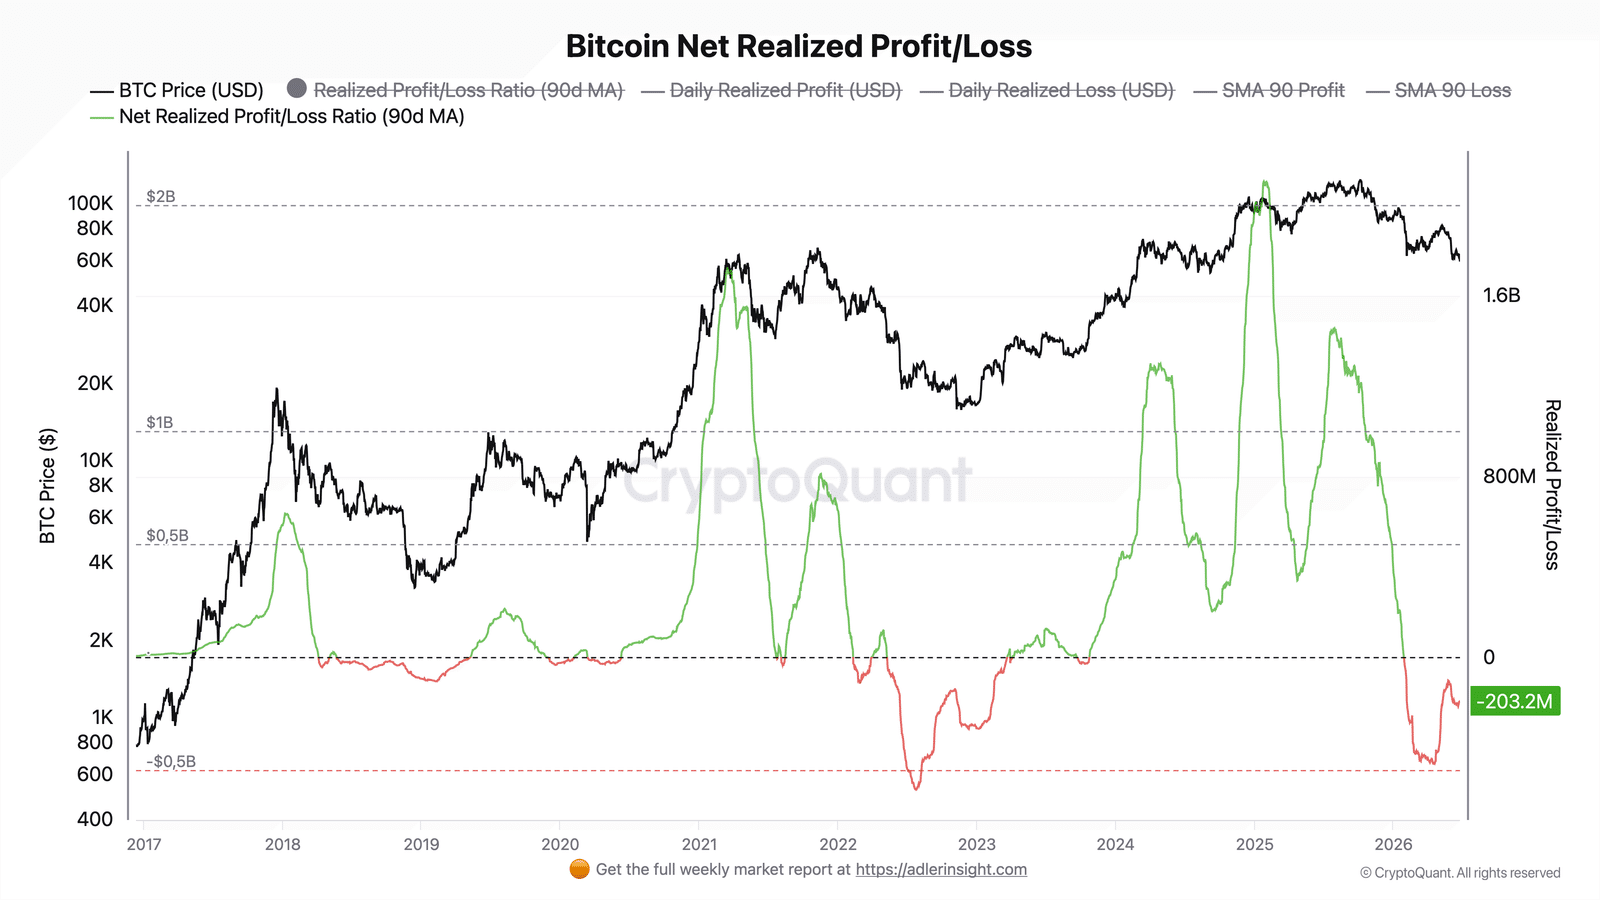
Crypto analyst Axel Adler Jr. noted that the net realized P/L has been in negative territory for five months. This metric uses the difference between realized profit and loss, and the 90-day moving average to smooth out the data.
The continuous state of realized losses the market witnessed in 2026 is characteristic of bear market cycles. A similar scenario developed in mid-2022, too.
Did on-chain data foreshadow Bitcoin’s latest sell-off?
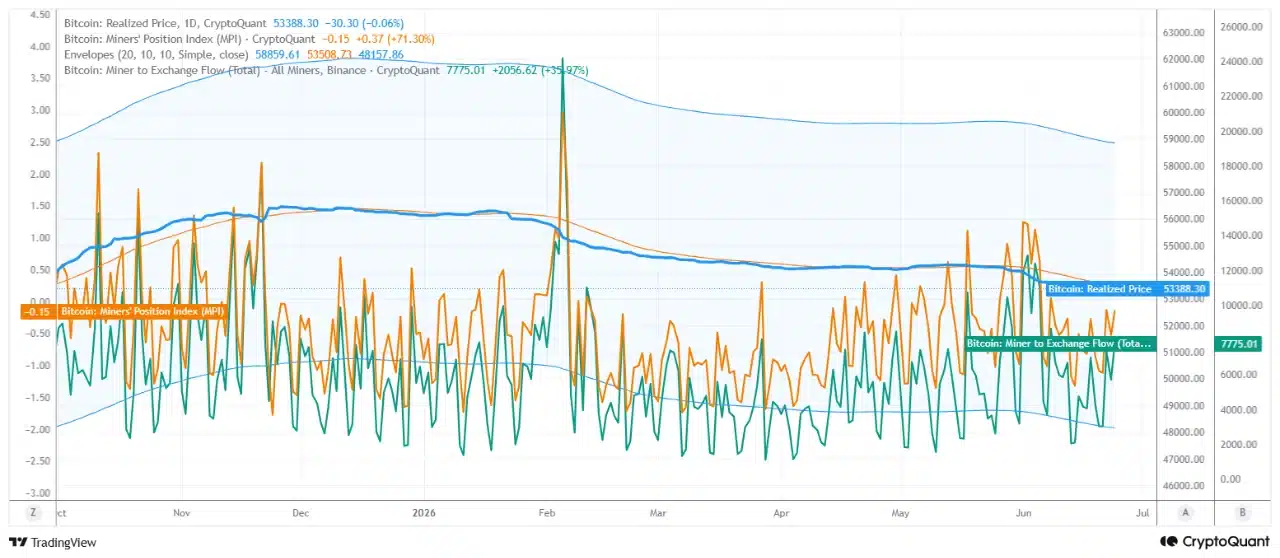
The foundation for the recent losses was already visible back in February, claimed crypto analyst PelinayPA on CryptoQuant. The Miner’s Position Index had been rising from March to June, and was at -0.15 now.
Though negative, it showed that miners were moving relatively more coins onto exchanges. It also came alongside increased Miner to Exchange flows. Together, they showed more supply was made ready for selling.
Hindsight is 20/20, but the signals were there. The realized price of $53,888 represents the average cost basis for BTC, making it the next price target and a significant support level.
Final Summary
- The latest Bitcoin price drop was driven by heightened long leverage and the subsequent liquidation event.
- The weakening demand and multi-month trends of realized losses showed holders were under immense pressure.


